Abstract
Pharmacokinetic properties of IV busulfan are more predictable than those of oral. While this results in lower toxicity, it is unclear if clinical results are superior. 55 consecutive patients with hematologic malignancies (35 AML/MDS, 10 lymphoma/CLL, 7 CML/MPD, 3 ALL) allografted after oral busulfan (14 mg/kg) with cyclophosphamide (120 mg/kg) (BuCy; n=24; cyclosporine-MTX) or IV busulfan (520 mg/m2) with fludarabine (160 mg/m2) (BuFlu; n=31; tacrolimus-MTX) were studied. The donors were HLA-identical sibs (n=41), 10/10 allele-matched unrelated (n=10), or 9/10 allele-matched individuals (n=4; 2 unrelated). Busulfan levels were not monitored. G/GM-CSF were not given routinely. Supportive care was uniform. 11 patients died of transplant-related causes, 21 relapsed (12 dead), and 32 were alive at the last follow-up (23 in continuous CR). The actuarial 2-y overall (OS) and event-free (EFS) survival was 50% (95% CI: 34–67%) and 34% (95% CI: 19–49%). The following pre-HSCT prognostic factors affected OS adversely in univariate analysis: refractory disease, ECOG performance status (PS) 2/3, elevated LDH, albumin <3, CD34+ cell dose ≤6 × 10⁶/kg, HLA mismatch, and platelets <100 × 109/L. The table shows comparison of the BuCy and BuFlu by patient and donor age, type of donors, and the factors found to influence survival. The two groups were comparable.
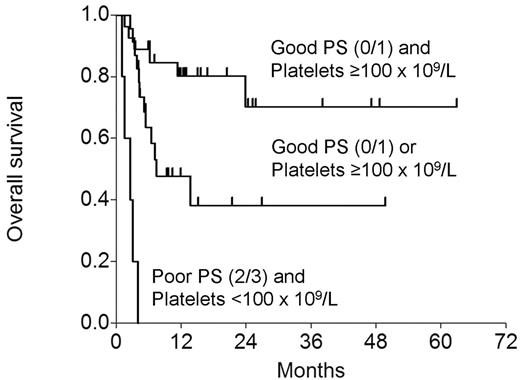
In a Cox model that included the conditioning regimen and the above variables, low platelets (RR 0.285; P=0.013) and poor PS (RR 0.244; P=0.023) affected OS adversely. EFS was adversely affected by poor PS (RR=0.304; P=0.032), with borderline effect of low platelets (RR=0.451; P=0.062) and refractory disease (RR=0.502; P=0.095). The figure below shows OS by the presence or absence of the 2 adverse variables.
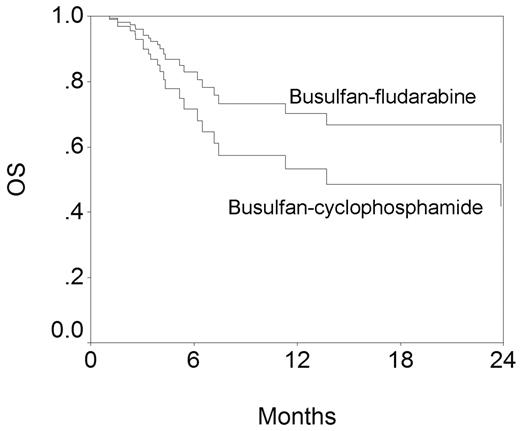
The figure below shows OS by the conditioning regimen. These curves have been generated from the Cox model and have been adjusted for the other variables in the model. While the difference is not statistically significant, BuFlu appears superior. However, similarly generated EFS curves for BuCy and BuFlu are superimposable.
We conclude that with limited patient numbers and follow-up, BuCy and BuFlu appear identical in efficacy although the appearance of the OS curves suggest that differences may emerge with loner follow-up and bigger patient numbers.
Figure
Figure
| Characteristic . | BuCy . | BuFlu . | P . |
|---|---|---|---|
| Patient age | 44 (27–62) | 40 (20–61) | 0.23 |
| Donor age | 46 (25–65) | 39 (25–66) | 0.25 |
| MSD | 22/24 (92%) | 19/31 (61%) | 0.013 |
| Refractory disease | 12/24 (50%) | 16/31 (52%) | 0.91 |
| ECOG PS 2/3 | 6/24 (25%) | 4/31 (13%) | 0.30 |
| Elevated LDH | 6/24 (25%) | 4/31 (13%) | 0.30 |
| Albumin < 3 | 7/24 (29%) | 8/31 (26%) | 0.78 |
| CD34+ cell dose ≤6 × 10⁶/kg | 21/24 (88%) | 21/31 (68%) | 0..12 |
| HLA mismatch | 1/24 (4%) | 3/31 (10%) | 0.62 |
| Platelets <100 × 109/L | 9/24 (38%) | 14/31 (45%) | 0.57 |
Disclosure: No relevant conflicts of interest to declare.
Author notes
Corresponding author


This feature is available to Subscribers Only
Sign In or Create an Account Close Modal