Abstract
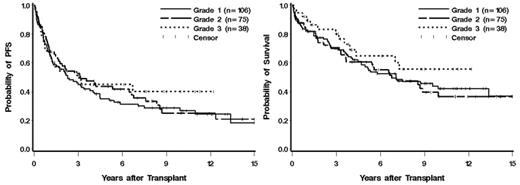
Follicular lymphomas (FL) represent approximately one-fourth of all non-Hodgkins lymphomas (NHL) and are the most common indolent lymphomas. Studies suggest that patients (pts) with relapsed FL treated with high-dose therapy (HDT) and autologous stem cell transplantation (ASCT) have prolonged progression-free survival (PFS) and overall survival (OS) as compared to those treated with standard chemotherapy alone, yet the impact of histologic grade on these outcomes has not been established. In order to address this issue, we evaluated all FL pts that underwent HDT and ASCT at our center from Dec 1985 to June 2005 (n=219). Pts with transformation to diffuse large B-cell lymphoma were excluded. Histologic grades 1, 2, and 3 were present in 106 (48%), 75 (34%), and 38 (17%) pts, respectively. Other baseline characteristics at the time of transplant for this cohort included: Female = 39%, median age = 48 (range 24 – 66), stage III/IV = 93%, elevated LDH = 27%, median number of prior regimens = 3 (range 1 to 11), prior radiation therapy (RT) = 16%, bulk ≥5cm = 19%, chemosensitive = 68%, complete remission = 18%. 53% of pts are alive and 36% are alive without relapse at last contact leading to 5- and 10-year estimates of 60% and 42% for OS and 39% and 28% for PFS, respectively. The median follow-up for surviving patients was 7.8 years. The 5- and 10-year OS estimates for the histologic grades were grade 1: 57% and 42%, 2: 60% and 36%, and 3: 65% and 55% (Figure). Five- and 10-year PFS estimates were grade 1: 35% and 27%, grade 2: 44% and 25%, and grade 3: 45% and 40% (Figure). In order to adjust for any potential imbalances of critical prognostic factors between the three grades, we performed a multivariable analysis adjusting for criteria that were found to be associated with OS and/or PFS (age, # of prior regimens, prior RT, chemosensitivity, and LDH) and obtained the hazard ratios (HR) and p-values noted (Table). These data suggest that 1) prolonged OS and PFS can be attained via HDT and ASCT in FL pts, 2) histologic grade does not statistically significantly impact outcomes, and 3) other factors noted above should be utilized to predict outcome and counsel patients.
| Grade . | HR for Death (95% CI) . | p . | HR for Death or Progression (95% CI) . | p . |
|---|---|---|---|---|
| 1 | 1 (– –) | – | 1 (– –) | – |
| 2 | 1.00 (0.66–1.54) | 0.98 | 0.92 (0.63–1.34) | 0.69 |
| 3 | 0.66 (0.35–1.24) | 0.20 | 0.79 (0.48–1.33) | 0.38 |
| Grade . | HR for Death (95% CI) . | p . | HR for Death or Progression (95% CI) . | p . |
|---|---|---|---|---|
| 1 | 1 (– –) | – | 1 (– –) | – |
| 2 | 1.00 (0.66–1.54) | 0.98 | 0.92 (0.63–1.34) | 0.69 |
| 3 | 0.66 (0.35–1.24) | 0.20 | 0.79 (0.48–1.33) | 0.38 |
Figure
Author notes
Corresponding author


This feature is available to Subscribers Only
Sign In or Create an Account Close Modal