Abstract
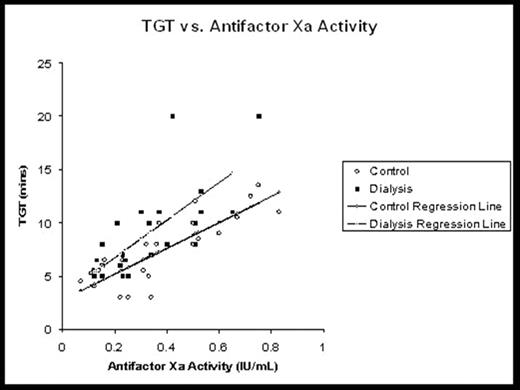
Patients with renal dysfunction that receive hemodialysis (HD) are highly sensitive to low molecular weight heparin (LMWH) drugs such as Enoxaparin. There have been numerous reports of hemorrhagic effects with these drugs in this population. Although current guidelines recommend judicious monitoring of antifactor Xa activity in HD patients to prevent adverse events, this parameter is poorly correlated to efficacy and toxicity. Newer, more specific parameters such as thrombin generation time (TGT), platelet contractile force (PCF) and clot elastic modulus (CEM) may play a role in monitoring LMWH drugs in high-risk populations such as those with renal dysfunction. To determine the utility of monitoring TGT, PCF and CEM for this purpose, we conducted a prospective clinical trial in 8 non-thrombosed HD and 8 control subjects. All subjects received escalating doses of Enoxaparin 0.25, 0.50 and 1.0 mg/kg subcutaneously during this study. Blood samples were obtained four hours post-dose to capture the peak effect of Enoxaparin on antifactor Xa activity, TGT, PCF and CEM. Pearson’s correlation was used to determine the relationships between antifactor Xa activity and TGT, PCF and CEM at each dose, respectively. Repeated measures analysis of covariance was used to assess for intergroup differences in the slopes of each regression line using the group status and antifactor Xa concentration as the covariates. The correlation coefficient (r), coefficient of determination (r2) and p-value for each parameter in each group are listed in the Tables. The figure illustrates the relationship between antifactor Xa and TGT in both controls and ESRD patients. These findings suggest that TGT, PCF and CEM are highly correlated to antifactor Xa activity in patients with and without renal dysfunction. There were no differences in the slopes of the regression lines between groups. Further studies are needed to determine if TGT, PCF and CEM provide more useful clinical information regarding the level of anticoagulation in high-risk patients receiving low-molecular weight heparin therapy.
TGT vs. Antifactor Xa Activity
Correlation Parameters for Antifactor Xa and TGT, PCF and CEM for Control Subjects
| Model . | r . | r2 . | P-value . |
|---|---|---|---|
| Antifactor Xa vs. TGT | 0.88 | 0.77 | 0.001 |
| Antifactor Xa vs.PCF | 0.85 | 0.73 | 0.0003 |
| Antifactor Xa vs. CEM | 0.80 | 0.63 | 0.02 |
| Model . | r . | r2 . | P-value . |
|---|---|---|---|
| Antifactor Xa vs. TGT | 0.88 | 0.77 | 0.001 |
| Antifactor Xa vs.PCF | 0.85 | 0.73 | 0.0003 |
| Antifactor Xa vs. CEM | 0.80 | 0.63 | 0.02 |
Correlation Parameters for Antifactor Xa and TGT, PCF and CEM for HD subjects
| Model . | r . | r2 . | P-value . |
|---|---|---|---|
| Antifactor Xa vs. TGT | 0.91 | 0.82 | 0.0002 |
| Antifactor Xa vs. PCF | 0.90 | 0.80 | 0.0004 |
| Antifactor Xa vs. CEM | 0.90 | 0.80 | 0.0005 |
| Model . | r . | r2 . | P-value . |
|---|---|---|---|
| Antifactor Xa vs. TGT | 0.91 | 0.82 | 0.0002 |
| Antifactor Xa vs. PCF | 0.90 | 0.80 | 0.0004 |
| Antifactor Xa vs. CEM | 0.90 | 0.80 | 0.0005 |
Author notes
Corresponding author


This feature is available to Subscribers Only
Sign In or Create an Account Close Modal