Abstract
Background: Essential thrombocythemia(ET) is a clonal disorder involving a hematopoietic progenitor cell and is manifested by the overproduction of platelets. There is as yet no pathognomonic diagnostic test. In our study, to identify the biomarkers for an initial diagnosis by a lesser invasive method, serum proteins reflecting alteration their proteomes were analysed.
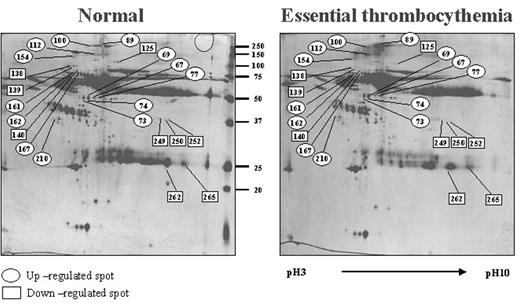
Methods: We compared two-dimensional electrophoresis patterns of human sera of twelve patients with ET with that of normal twelve subjects. The differentially expressed spots were identified by matrix-assisted laser desorption/ionization-time-of flight(MALDI-TOF) and electrospray ionization quadupole time of flight(ESI-Q-TOF)mass spectrometry.
Results: Twenty two spots that expressed differentially in ET group were found. The expression levels of fibrinogen γ, fibrinogen γ-A chain precursor, ALB protein, α-2 macroglobulin, H factor-1, α-2-macroglobulin precursor, ceruloplasmin, α-1-B-glycoprotein, α-2-plasmin inhibitor, α-1-B-glycoprotein and an unknown protein were up-regulated in serum of ET patients, whereas the other proteins including complement fator B preproprotein, afamin precursor, inter-α inhibitor H4, immunoglobulin heavy chain constant region γ 1, immunoglobulin κ light chain and an unknown protein down-regulated.
Conclusion: These results suggest that these proteins can be used as less invasive diagnostic and follow-up biomarkers of ET if further studies were done.
The proteins significantly changed in sera of ET
| Spot no. . | Name . | Accession no. . | % coverage . | Mw(KDa)/pI(Measured) . | Mw(KDa)/pI(database) . | ET(%) . |
|---|---|---|---|---|---|---|
| 67 | fibrinogen γ | 223170 | 39 | 50.57/5.6 | 46.82/5.5 | 2.54±0.52 |
| 69 | ” | 223170 | 33 | 50.57/5.6 | 46.83/5.5 | 3.93±1.19 |
| 73 | fibrinogen γ-A chain precursor | 71827 | 23 | 48.93/5.6 | 50.11/5.7 | 3.89±0.98 |
| 74 | ” | 71827 | 22 | 48.93/5.8 | 50.11/5.7 | 3.10±0.91 |
| 77 | ALB protein | 27692693 | 21 | 50.57/5.9 | 48.65/6.0 | 3.77±0.58 |
| 89 | α-2-macroglobulin | 177872 | 14 | 263.89/6.1 | 71.35/5.5 | 1.95±0.32 |
| 100 | H factor 1 | 4504875 | 20 | 248.95/5.7 | 143.79/6.3 | 5.8±1.78 |
| 112 | α-2-macroglobulin precursor | 4557225 | 9 | 151.38/5.7 | 164.69/6.0 | 2.18±0.38 |
| 125 | complement factor B preproprotein | 4502397 | 14 | 151.38/5.7 | 86.86/6.6 | 0.49±0.07 |
| 138 | afamin precursor | 4501987 | 12 | 65.01/5.1 | 85.53/6.3 | 0.31±0.07 |
| 139 | ” | 4501987 | 12 | 65.01/5.1 | 85.53/6.3 | 0.36±0.09 |
| 140 | inter- α inhibitor H4 | 31542984 | 12 | 93.33/5.3 | 103.57/6.5 | 0.36±0.08 |
| 154 | ceruloplasmin | 4557485 | 8 | 132.89/5.3 | 123.04/5.4 | 3.34±0.80 |
| 161 | α-1-B-glycoprotein | 69990 | 21 | 84.50/5.0 | 52.49/5.6 | 4.23±0.98 |
| 162 | α-2-plasmin inhibitor | 11386143 | 14 | 78.58/5.0 | 54.92/5.8 | 1.95±0.38 |
| 167 | α-1-B-glycoprotein | 69990 | 28 | 80.87/5.3 | 52.49/5.6 | 1.73±0.04 |
| 210 | Not identified | - | - | 38.47/4.6 | - | 2.77±0.20 |
| 249 | immunoglobulin heavy chain constant regionγ 1 | 12054072 | 15 | 39.021/8.1 | 36.65/8.8 | 0.40±0.09 |
| 250 | ” | 12054072 | 18 | 38.79/8.2 | 36.65/8.8 | 0.34±0.14 |
| 252 | ” | 12054072 | 19 | 38.50/8.3 | 36.65/8.8 | 0.37±0.09 |
| 262 | unknown | 15679996 | 36 | 24.73/8.2 | 23.32/8.6 | 0.30±0.13 |
| 265 | immunoglobulinκ light chain | 2765423 | 22 | 25.75/8.8 | 25.93/9.2 | 0.28±0.12 |
Figure
Author notes
Corresponding author


This feature is available to Subscribers Only
Sign In or Create an Account Close Modal