Abstract
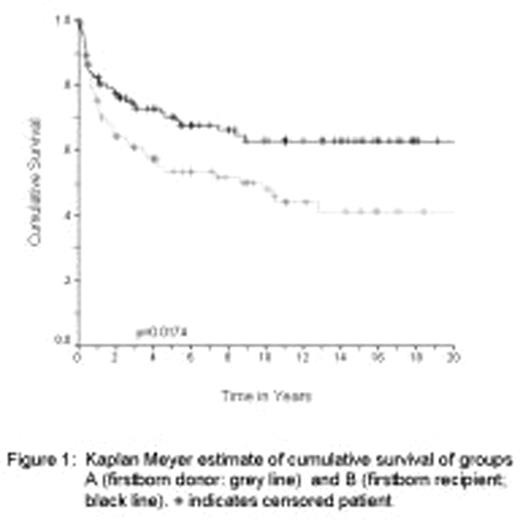
Fetomaternal and maternofetal cell transfer have been described. Their clinical relevance is unknown. We hypothesized that firstborn siblings could tolerize their siblings born thereafter through sequential fetomaternal-maternofetal cell transfer. Hence, stem cell transplants within a family from a firstborn sibling (group A) should result more graft-versus-host disease (GvHD) and worse overall survival than transplants to a firstborn donor (group B). Results of a retrospective single center cohort analysis of 321 HLA-identical sibling donor hemopoietic stem cell transplants showed a survival of 48.3% (+/−10.9%) at 10 years in the group with firstborn donors (group A, 110 patients) as compared to 63.2 (+/−10.6%) in the group with firstborn recipients (group B, 105 patients; p<0.02) and a RR of death after adjustment for other risk factors of 2.6 (CI 1.45–4.66; p<0.001) for the group with firstborn donors. These results support the concept of a clinically relevant tolerizing effect of birth order, possibly mediated by fetomaternal cell transfer in man.
Patients characteristics and outcomes
| Birth Order . | . | Donor First Sibling . | Recipient First Sibling . | . |
|---|---|---|---|---|
| n | 110 | 105 | ||
| Donor Age | median (range) | 30.1 (4.9–68) | 25.4 (0.4–59.1) | p=0.005 |
| Recipient Age | median (range) | 25.4(3.2–62.1) | 30.8 (2.2–63.0) | |
| Number of Siblings | 2 | 67 | 69 | n.s. |
| 3 | 26 | 22 | ||
| >3 | 17 | 14 | ||
| Diagnosis | n.s. | |||
| Acute myeloid leukemia | n | 33 | 26 | |
| Acute lymphoblastic leukemia | n | 24 | 24 | |
| Chronic myeloid leukemia | n | 23 | 23 | |
| Lymphoproliferative disorders | n | 14 | 13 | |
| Severe aplastic anemia | n | 11 | 12 | |
| Myelodysplastic syndromes | n | 5 | 7 | |
| Stem Cell Source | n.s. | |||
| Bone Marrow | n | 71 | 73 | |
| PBSCT | n | 39 | 32 | |
| Conditioning | n.s. | |||
| With totoal body irradiation | n | 18 | 22 | |
| Without total body irradiation | n | 92 | 83 | |
| Outcomes | ||||
| Survival at 10 yrs | % | 48.3 | 63.2 | p<0.02 |
| Relapse at 3 yrs. | % | 26 | 20 | n.s. |
| Acute GvHD | p=0.017 | |||
| < Grade II | n | 46 | 61 | |
| >= Grade II | n | 64 | 44 | |
| Chronic GvHD | n.s. | |||
| none | n | 28 | 30 | |
| n.a. | n | 29 | 17 | |
| Limited | n | 32 | 30 | |
| Extensive | n | 21 | 23 |
Kaplan Meyer estimate of cumulative survival of groups A(firstborn donor: gray line) and B (firstborn recipient: black line). + indicates censored patient.
Kaplan Meyer estimate of cumulative survival of groups A(firstborn donor: gray line) and B (firstborn recipient: black line). + indicates censored patient.
Author notes
Corresponding author


This feature is available to Subscribers Only
Sign In or Create an Account Close Modal