Abstract
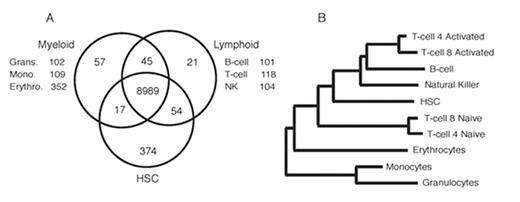
A single hematopoietic stem cell (HSC) gives rise to unique and divergent progeny to provide a complete hematologic and immune system. The mechanisms controlling this process are poorly defined, however several genes regulating development of specific lineages have been identified. The genetic manipulation of these molecules results in aberrant differentiation, and many are implicated in the development of leukemias and lymphomas. Our lab has focused on expression profiling of the HSC in an effort to understand the underlying mechanisms of self-renewal and quiescence. To determine the factors governing cell fate and differentiation, we have examined the transcriptome of mature hematopoietic cells (erythrocytes, granulocytes, monocytes, NK cells, activated/naive T-cells, and B-cells), in addition to long-term HSC, by using high-density oligonucleotide microarrays incorporating approximately two thirds of the mouse transcriptome. Bioinformatic analysis revealed a transcriptional fingerprint unique to each lineage of 100 to 400 genes as well as nearly 9000 genes in common to all hematopoietic cells examined (Figure 1A). Some of the lineage-specific genes are recognized markers or regulators of the specific cell type in which they were identified such as 9 distinct NK cell lectin-like receptor family members, Gata1 in erythrocytes, and macrophage scavenger receptor 1 on monocytes. A significant proportion of genes (40%) are poorly studied or completely novel, including, sox 13 in granulocytes, tbl1x in T-cells, and zfp105 in NK cells. Remarkably, over one-half of the 539 genes described to have a hematopoietic system phenotype in the Mouse Genome Informatics (MGI 3.22) knockout database, were highlighted in our study as having a lineage-specific expression pattern, illustrating the functional importance of the genes singled out in this study. Early B-cell factor 1 (Ebf1), an example in our B-cell fingerprint, when disrupted results in ablation of mature B-cells. Of the 374 genes that are unique to HSC, transcription factors and signalling molecules were 2-fold and 3-fold enriched, respectively, relative to that expected by chance for the whole microarray. Interestingly, gene expression cluster analysis indicates that HSC share many transcriptional similarities with lymphocytes, in particular, B-cells, NK cells, and activated T-cells (Figure 1B). This cluster analysis also supports a developmental model in which erythrocytes are a unique lineage. Ongoing promoter analysis and over-expression studies are aimed at determining the role some of the novel genes identified in our lineage fingerprinting play in hematopoiesis. These studies represent the first comprehensive attempt to examine the transcriptome of individual components of any tissue system, and illustrate the small number of genes required to uniquely define specific differentiated cell types.
A) Venn diagram of hematopoietic fingerprints showing the number of genes exclusive to a given population. B) Dendrogram illustrating relatedness of each cell population according to the transcriptional profile. Relative similarity is determined by distance from nearest shared branch-point.
A) Venn diagram of hematopoietic fingerprints showing the number of genes exclusive to a given population. B) Dendrogram illustrating relatedness of each cell population according to the transcriptional profile. Relative similarity is determined by distance from nearest shared branch-point.
Author notes
Corresponding author


This feature is available to Subscribers Only
Sign In or Create an Account Close Modal