Abstract
Recent studies demonstrate that recombinant adeno-associated virus (rAAV)–based antigen loading of dendritic cells (DCs) generates significant and rapid (one stimulation per week) cytotoxic T-lymphocyte (CTL) responses in vitro against viral antigens. As a more extensive analysis of the rAAV system, we have used a self-antigen, HM1.24, expressed in multiple myeloma (MM). Again, with one stimulation, significant major histocompatibility complex (MHC) class 1–restricted, anti-HM1.24–specific CTL killing was demonstrated against MM cells. Furthermore, higher expression of interferon-γ (IFN-γ) in T cells and higher expression levels of, in order of significance, CD80 (2.6- to 3.8-fold increase), CD86, and CD40 on DCs were also observed. The use of synthetic HM1.24-positive target cells further demonstrated the antigen specificity of these CTLs. There was also no evidence of natural killer cell involvement. These data extend our earlier studies and suggest that the rAAV-loading of DCs may be a particularly good protocol for generating CTLs against self-antigens, which may not otherwise be considered good targets because of their low immunogenicity. We also show that HM1.24 may be an effective antigen for targeting MM.
Introduction
Multiple myeloma (MM) is a malignancy characterized by clonal proliferation and accumulation of immunoglobulin-producing plasma cells, which are terminally differentiated B cells.1 It is important to note that patients who have not responded to high-dose chemotherapy treatment plus autologous stem cell transplantation respond well to allogeneic transplantation and that a graft-versus-myeloma effect can be extremely powerful.2 These studies suggest that immunologic manipulations might be an appropriate treatment avenue for myeloma, especially if a state of minimal residual disease can be achieved after autotransplantation. In the search for an appropriate anti-MM antigenic target for immunotherapy, the self-antigen HM1.24 protein appears plausible. The HM1.24 antigen is defined by a monoclonal antibody (mAb HM1.24) that appears to be a novel terminal B-cell–restricted antigen3,4 expressed on tumor cells and on mature immunoglobulin-secreting B cells (plasma cells and lymphoplasmacytoid cells) but not on other cells in the peripheral blood, bone marrow, liver, spleen, kidney, or heart of healthy persons or patients with non–plasma-cell–related malignancies. HM1.24 effectiveness against MM has been demonstrated through tumor cell lysis by mAb and complement.5,6 The HM1.24 coding sequence is 1 kb long, an ideal size for ligation into any viral vector including adeno-associated virus (AAV).4
Manipulating antigen-presenting cells, such as dendritic cells (DCs), is a recognized approach toward developing effective immunotherapeutic protocols. DCs are potent, professional antigen-presenting cells that can initiate a primary immune response to antigens by naive T cells.7 Various protocols for generating DCs in vitro from peripheral blood have recently been developed. These new technologies permit in vitro manipulation of DCs for clinical studies.8,9 The protocols include loading DCs with tumor fragments, antigen peptides, defined tumor antigens, or antigen genes by way of retrovirus and adenovirus vectors.10-22 We have recently shown that AAV-based vectors are appropriate for viral antigen and cytokine gene delivery into DCs.20,22 In head-to-head comparisons, AAV-based viral antigen gene loading of DCs was found to be superior to protein-loading in the ability to generate significant cytotoxic T lymphocytes (CTLs) in a short period of time.21,22 In this study, we test the ability of recombinant AAV loading of DCs to generate CTLs specific for a self-antigen, whose responding T-cell precursors are usually 100-fold more rare than antiviral responders.
Materials and methods
Generating HM1.24 cDNA and RT-PCR analysis for HM1.24 expression
Total RNA from 2 human MM cell lines, ARK-B and ARP-1, was used to obtain HM1.24 mRNA by reverse transcription–polymerase chain reaction (RT-PCR). HM1.24 expression of rAAV-loaded DCs was also analyzed by RT-PCR. Total RNA was first isolated from these cells with TRIzol (Gibco BRL/Life Technologies, Rockville, MD) and was treated with 10 U/g RNase-free DNase I (Promega, Madison, WI) for 1 hour at 37°C. Messenger RNA was then separated with the use of the Oligotex mRNA kit (Qiagen, Valencia, CA). First-strand cDNA synthesis was performed at 37°C for 1 hour in a final volume of 25 μL reaction buffer (0.5 μg mRNA; 50 mM Tris-HCl, pH 8.3; 75 mM KCl; 3 mM MgCl2; 10 mM dithiothreitol [DTT]; 0.5 g oligo(dT)15 (Promega); 0.5 mM each of the 4 deoxynucleotide triphosphates; 30 U RNasin ribonuclease inhibitor (Promega); and 200 U M-MLV reverse transcriptase (Promega). PCR amplification of the cDNA was performed in a 100-μL reaction volume containing 2.5 U TaKaRa Z-Taq polymerase according to the manufacturer's protocol (TaKaRa Shuzo, Otsu, Japan). The HM1.24 primer set was designed from the HM1.24 sequences described by Ohtomo et al.4 This primer set (upstream, 5′-TCATGGCATCTACTTCGTATGAC-3′; downstream, 5′-GGATCTCACTGCAGCAGAGC-3′) targeted the amplification of the HM1.24-coding sequences from nucleotides 8 to 557.23 Control RT-PCR analysis of expression of the housekeeping gene TFIIB was also undertaken with the primer set 5′-GTGAAGATGGCGTCTACCAG-3′ and 5′-GCCTCAATTTATAGCTGTGG-3′, which amplified nucleotides 356 to 1314 of that mRNA. To ensure that DNA did not contribute to the results, direct PCR (no RT step) was also undertaken.
Constructing the AAV/HM1.24/Neo genome and generation and titer of virus stocks
The HM1.24 cDNA was sequenced before it was ligated into an AAV vector, dl6-95. The AAV/HM1.24/Neo genome was constructed as a plasmid in a manner similar to that previously described for other AAV vectors.20,22 AAV/HM1.24/Neo virus stocks were generated using either complementary plasmids ins96-0.8 or pSH3 using 293 cells as described previously.20,22,23 To generate purified recombinant AAV virus, the technique described by Auricchio et al was used.24 Purity of the viral preparation was assessed on sodium dodecyl sulfate–polyacrylamide gel electrophoresis (SDS-PAGE), and AAV capsid proteins were detected by Coomassie blue staining (data not shown). The titer of purified virus, in encapsidated genomes per milliliter (eg/mL), was calculated by dot-blot hybridization, as previously described.20,22 Lysates of 293T cells were used as a virus-negative control for mock infection.
Cellular materials
Two myeloma cell lines, ARP-1 and ARK-B (gifts from J. Epstein, University of Arkansas for Medical Sciences), were used. The ARP-1 and ARK-B cell lines were established from bone marrow aspirate of patients with multiple myeloma. Peripheral blood mononuclear cells (PBMCs) were obtained from 3 healthy male and female donors. Anti–syndecan-1 (CD138) antibody-sorted tumor cells were obtained from 4 patients with multiple myeloma. The HLA phenotypes of these patients' cells and cell lines and from donor cells are shown in Table 1. All clinical materials were obtained with each patient's consent and with approval from the local ethics committee.
HLA typing of donors and cell lines
Donors and cell lines . | Type . |
|---|---|
| ARP-1 | HLA-A1; B15, 27; Cw2, Cw3 |
| ARK-B | HLA-A66, A68; B41, B44, Cw5, Cw17 |
| Donor 1 | HLA-A1; B44, B27, Cw2 |
| Donor 2 | HLA-A1, A2; B7, B44, Cw7 |
| Donor 3 | HLA-A1; B7, B51; Cw3, Cw5 |
| Patient1 | HLA-A1, A11; B8, B18, Cw7 |
| Patient2 | HLA-A1; B7, B8, B44; Cw7 |
| Patient3 | HLA-A1, A11, B51, B44; Cw5 |
| Patient4 | HLA-A1, B15, B44; Cw2, Cw5 |
Generation and infection of monocyte-derived DCs
DCs (2 × 10⁵ adherent monocytes) were generated and infected (0.5 mL virus [109 eg/mL]) as previously described.20,22 Recombinant granulocyte macrophage–colony-stimulating factor (GM-CSF) (sargramostim [Leukine]; Immunex, Seattle, WA) at a final concentration of 800 IU/mL was included in the medium throughout the culture. To induce the maturation of monocytes into DCs, human interleukin-4 (IL-4) (R&D Systems, Minneapolis, MN) at 1000 IU/mL was added on day 3.
Generation of autologous HM1.24-positive target cells
Nonadherent peripheral blood mononuclear cells (PBMCs) isolated from healthy donors were infected with AAV/HM1.24 virus (no Neo), at a multiplicity of infection of 100, 4 days before chromium Cr 51 labeling and the 51Cr release assay. All clinical materials were obtained with patient consent and with approval from the local ethics committee.
Detection of viral integration by PCR/Southern blot analysis
Chromosomal integration of the AAV/HM1.24/Neo genome was undertaken by vector-chromosome junction PCR amplification and Southern blot analysis, as previously described.20-22
Generation and testing of HM1.24-specific CTLs
CTL experiments were performed in quadruplicate using cells from 3 donors. For each experiment the nonadherent PBMCs from the same healthy donor (A1) were washed and resuspended in AIM-V at 10 to 20 × 106 cells per well in 6-well culture plates with AAV/HM1.24/Neo-loaded DC (ratios of responders to DCs from 20:1). The cultures were supplemented with GM-CSF (800 U/mL) and recombinant human IL-2 (10 U/mL). After 7 days of coculture, the cells were used for cytotoxicity assays in a 6-hour 51Cr assay, as previously described.21,22 To determine the HLA dependency of the CTL activity, 50 μL antibodies against HLA class 1 (W6/32) and class 2 (L243), at a concentration of 50 μg/mL, were preincubated with the target cells for 30 minutes before addition of the stimulated T cells. K562 cells were used as targets to observe natural killer (NK) cell activity. In all these CTL killing assays, spontaneous release of chromium never exceeded 25% of maximum release.
Flow cytometry analysis of intracellular cytokines
Statistics
All results are expressed as mean ± SD. Data were analyzed using nonparametric analysis of variance (ANOVA). If differences were detected between means, the Newman-Keuls test was used for multiple comparison. Differences were considered significant if P < .05.
Results
AAV/HM1.24/Neo-transduced DCs express HM1.24
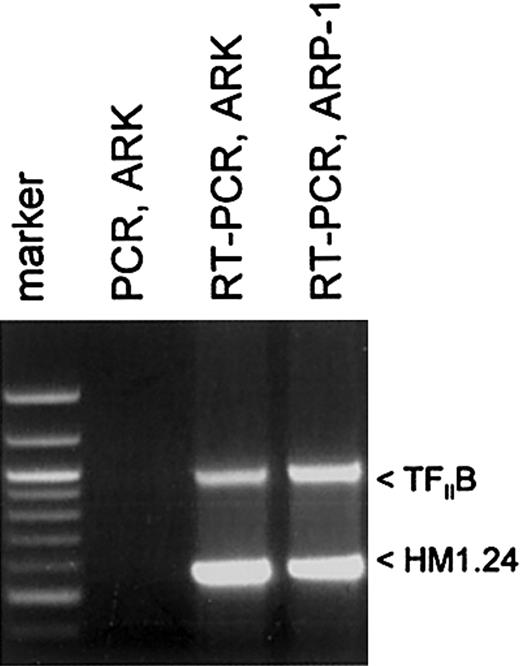
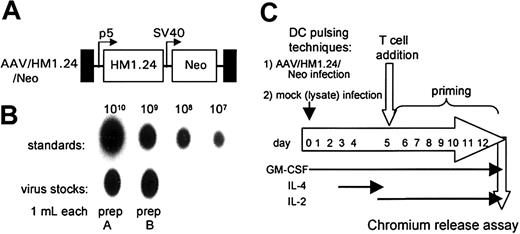
The goal of this study was to determine whether recombinant adeno-associated virus (rAAV)–based gene loading of the multiple myeloma autoantigen HM1.24 gene into DCs could elicit a significant CTL response against HM1.24-positive targets and MM. The myeloma cell lines ARK-B and ARP-1 were each used to generate an HM1.24 cDNA. Figure 1 shows the RT-PCR amplification of the HM1.24-coding sequences from both the ARK-B and the ARP-1 cell lines. The PCR-only control (no RT step), lacking an HM1.24-amplified product, indicated that no DNA was present in our RNA samples. The HM1.24 cDNA from ARK-B was inserted into a gutted AAV vector (dl6-95) to generate an AAV/HM1.24/Neo vector as described in “Materials and methods.” Figure 2A shows a structural map of the resultant AAV/HM1.24/Neo vector. In this vector, the HM1.24 gene was expressed from the AAV p5 promoter, which is known to be active in DCs.20-22 Before use the AAV/HM1.24/Neo vector was sequenced and found to contain only the HM1.24 and Neo genes. No extraneous genes or DNA sequences were found. A 2-step process was used to generate an AAV/HM1.24/Neo virus stock, as previously described.20 Two clones were isolated and used to generate AAV/HM1.24/Neo viral stocks. Figure 2B shows that the titer of the virus stocks was approximately 109 eg/mL.
Analysis and generation of HM1.24 cDNA in myeloma cell lines. RT-PCR was performed on polyA-selected RNA to generate HM1.24 cDNA, as described in “Materials and methods.” Note that ARK-B and ARP-1 cell lines expressed HM1.24, as indicated by the appropriately sized band. All the MM cell lines and MM primary cells used in this study were found to express HM1.24 by RT-PCR (data not shown).
Analysis and generation of HM1.24 cDNA in myeloma cell lines. RT-PCR was performed on polyA-selected RNA to generate HM1.24 cDNA, as described in “Materials and methods.” Note that ARK-B and ARP-1 cell lines expressed HM1.24, as indicated by the appropriately sized band. All the MM cell lines and MM primary cells used in this study were found to express HM1.24 by RT-PCR (data not shown).
AAV/HM1.24/Neo vector, producer cell lines, and experimental scheme. (A) A structural map of the AAV/HM1.24/Neo virus (also known as dl6-95/HM1.24p5/NeoSV40) shows the names of the components at the top. TR (black boxes) refers to the AAV terminal repeats. P5 (bent arrow) refers to the AAV p5 promoter. SV40 (bent arrow) refers to the SV40 early enhancer/promoter. Boxes labeled HM1.24 and Neo represent the indicated open-reading frames. (B) Titer analysis of the AAV/HM1.24/Neo stock used in these experiments. (C) Depiction of the experimental protocol.
AAV/HM1.24/Neo vector, producer cell lines, and experimental scheme. (A) A structural map of the AAV/HM1.24/Neo virus (also known as dl6-95/HM1.24p5/NeoSV40) shows the names of the components at the top. TR (black boxes) refers to the AAV terminal repeats. P5 (bent arrow) refers to the AAV p5 promoter. SV40 (bent arrow) refers to the SV40 early enhancer/promoter. Boxes labeled HM1.24 and Neo represent the indicated open-reading frames. (B) Titer analysis of the AAV/HM1.24/Neo stock used in these experiments. (C) Depiction of the experimental protocol.
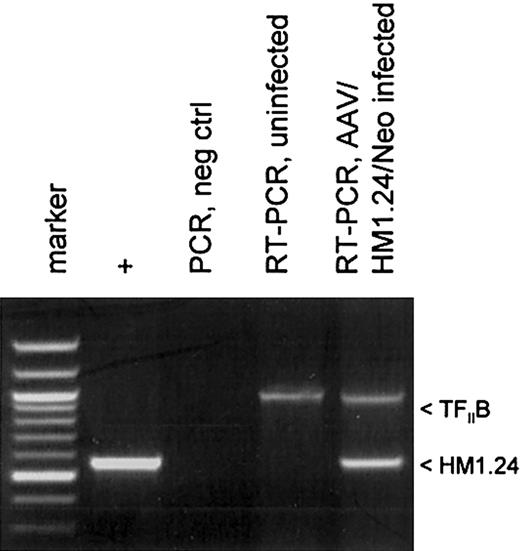
Protocols for generating DCs by differentiating PBMCs usually involve treating adherent monocytes with GM-CSF and IL-4. We modified this protocol to promote AAV vector transduction in DC precursor monocytes by treating adherent monocytes just after AAV infection with GM-CSF alone for several days before adding IL-4 on day 3.21 This allows for a brief period of monocyte proliferation which promotes higher levels of AAV transduction.20 A schematic diagram of the experimental protocol is shown in Figure 2C. The transduction of the monocyte/DC population was confirmed by measuring polyadenylated RNA expression of the HM1.24 transgene. At day 10, polyadenylated RNA was isolated from AAV/HM1.24/Neo-infected and mock-infected DC culture. This mRNA was then analyzed by RT-PCR for HM1.24 expression. A cellular gene, TFIIB, was included as a control. As shown in Figure 3, HM1.24 mRNA expression took place only in virally infected DC. A PCR-only control (no RT step) failed to generate a product, indicating that there was no DNA contamination in our samples.
HM1.24 mRNA expression in infected DCs. Total RNA was isolated from 2 cell populations: mock-infected and AAV/HM1.24/Neo-infected adherent monocytes at 72 hours after infection. These samples were analyzed by RT-PCR and PCR, as indicated, for the presence of HM1.24 RNA, as described in “Materials and methods.” The positive control was the PCR product resulting from using the AAV/HM1.24/Neo vector plasmid as a template. Another control was RT-PCR analysis for the cellular TFIIB mRNA. Note that only RNA from cells infected with AAV/HM1.24/Neo virus resulted in an appropriate RT-PCR–sized product, whereas mock-infected cells did not.
HM1.24 mRNA expression in infected DCs. Total RNA was isolated from 2 cell populations: mock-infected and AAV/HM1.24/Neo-infected adherent monocytes at 72 hours after infection. These samples were analyzed by RT-PCR and PCR, as indicated, for the presence of HM1.24 RNA, as described in “Materials and methods.” The positive control was the PCR product resulting from using the AAV/HM1.24/Neo vector plasmid as a template. Another control was RT-PCR analysis for the cellular TFIIB mRNA. Note that only RNA from cells infected with AAV/HM1.24/Neo virus resulted in an appropriate RT-PCR–sized product, whereas mock-infected cells did not.
AAV/HM1.24/Neo infection results in chromosomal integration
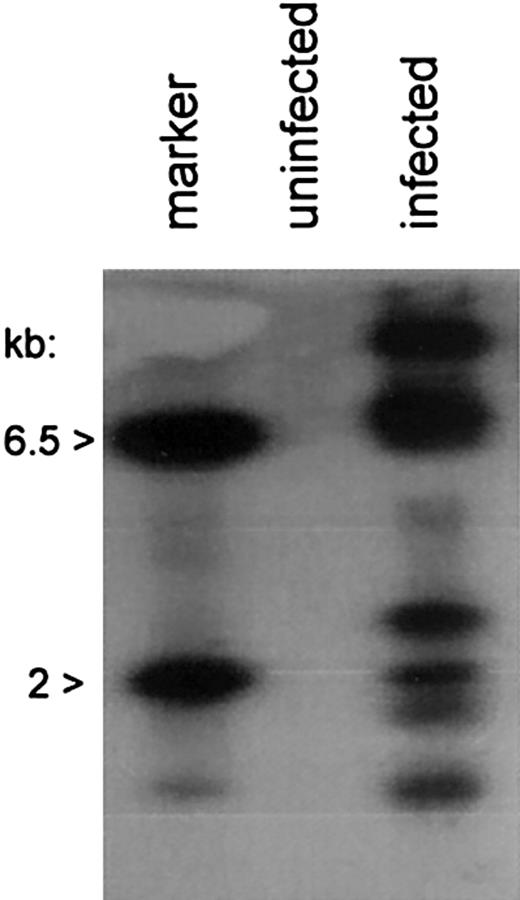
We next investigated chromosomal integration of the AAV/HM1.24/Neo vector in DCs. Chromosomal integration, though not essential for gene expression by AAV vectors, signifies a permanent genetic alteration of the DC and is often desirable for viral transduction. Analysis was carried out by PCR amplification of vector-chromosome junctions with primers complementary to the SV40 promoter within the vector and the AluI repetitive chromosomal element.20 rAAV-cell junction products were analyzed by PCR amplification and Southern blot analysis, with probing for the Neo gene sequences. Multiple vector-chromosomal junction products were observed in the AAV/HM1.24/Neo-infected DCs, but not in mock-infected (uninfected) DCs (Figure 4), indicating vector-chromosomal integration in the DC population.
Chromosomal integration by AAV/HM1.24/Neo in DCs. Cells, treated as indicated and as described in “Materials and methods” and sorted for CD83 expression, were further analyzed for chromosomally integrated AAV/HM1.24/Neo viral genomes. Total cellular DNA (0.1 μg) from infected, CD83+-selected, and uninfected cells served as a template in PCR amplification assays using primers targeting the SV40 early promoter of the vector and the cellular repetitive AluI element. The products underwent Southern blotting and were probed with 32P-Neo DNA. The positive control lane contained 100 ng BamHI-digested AAV/HM1.24/Neo plasmid (6.5 kb and 2 kb). Note that multiple Neo-positive bands resulted from the infected cell population, indicating chromosomal integration by the vector, and that multiple vector-positive cell clones were present in the population.
Chromosomal integration by AAV/HM1.24/Neo in DCs. Cells, treated as indicated and as described in “Materials and methods” and sorted for CD83 expression, were further analyzed for chromosomally integrated AAV/HM1.24/Neo viral genomes. Total cellular DNA (0.1 μg) from infected, CD83+-selected, and uninfected cells served as a template in PCR amplification assays using primers targeting the SV40 early promoter of the vector and the cellular repetitive AluI element. The products underwent Southern blotting and were probed with 32P-Neo DNA. The positive control lane contained 100 ng BamHI-digested AAV/HM1.24/Neo plasmid (6.5 kb and 2 kb). Note that multiple Neo-positive bands resulted from the infected cell population, indicating chromosomal integration by the vector, and that multiple vector-positive cell clones were present in the population.
AAV/HM1.24/Neo-transduced DCs stimulated HM1.24-specific CTLs
Next, the ability of the AAV/HM1.24/Neo vector to generate effective CTLs was analyzed. DCs were loaded by 1 of 2 techniques—lysate or vector (Figure 2C). In our 51Cr assays (Figures 5, 6, 7, 8, 9, 10), we used 8 target cell types. One type consisted of autologous PBMCs. Because late B cells are only a small percentage of PBMCs, PBMCs serve as an autologous, antigen-negative control as verified by RT-PCR. PBMCs were transfected with an HM1.24 expression plasmid to yield an autologous, antigen-positive control. Two additional targets were the HM1.24-positive myeloma cell lines ARK-B and ARP-1.22,26 A final target type was primary multiple myeloma cells taken from 4 patients (patients 1-4). To determine the ability of AAV/HM1.24/Neo-transduced DCs to stimulate HM1.24-specific CTLs, we carried out a standard 6-hour 51Cr assay on day 7 using the T-cell populations primed in coculture with the rAAV-transduced DCs.
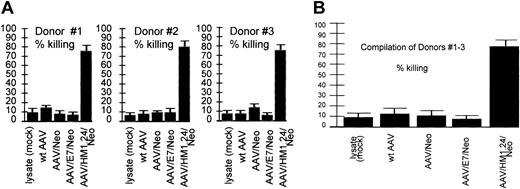
Loading specificity. CTL response generated by various AAV vectors against an HM1.24-positive autologous target. Shown are CTL responses of 3 donors (each experiment performed in quadruplicate) at the top and a compilation of the results from all 3 donors below. Error bars indicate standard deviation from the mean in all figures. These data demonstrate the cytotoxic response resulting from the indicated AAV vector loading techniques in a fully autologous system. Target cells were generated by the introduction of the HM1.24 gene into autologous PBLs 4 days before the CTL assay, as described in “Materials and methods.” Equivalent encapsidated genomes of the indicated vectors were used to load the DCs. Note that T cells stimulated by lysate (mock-infected, no virus)–loaded DCs, wild-type (wt) AAV-loaded DCs, AAV/Neo-loaded DCs, or AAV/E7/Neo-loaded DCs did not kill HM1.24-positive targets. However, T cells stimulated by AAV/HM1.24/Neo-loaded DCs did kill HM1.24-positive target cells. These data strongly suggest high antigen-loading specificity of the CTLs generated by AAV/HM1.24/Neo infection of DCs.
Loading specificity. CTL response generated by various AAV vectors against an HM1.24-positive autologous target. Shown are CTL responses of 3 donors (each experiment performed in quadruplicate) at the top and a compilation of the results from all 3 donors below. Error bars indicate standard deviation from the mean in all figures. These data demonstrate the cytotoxic response resulting from the indicated AAV vector loading techniques in a fully autologous system. Target cells were generated by the introduction of the HM1.24 gene into autologous PBLs 4 days before the CTL assay, as described in “Materials and methods.” Equivalent encapsidated genomes of the indicated vectors were used to load the DCs. Note that T cells stimulated by lysate (mock-infected, no virus)–loaded DCs, wild-type (wt) AAV-loaded DCs, AAV/Neo-loaded DCs, or AAV/E7/Neo-loaded DCs did not kill HM1.24-positive targets. However, T cells stimulated by AAV/HM1.24/Neo-loaded DCs did kill HM1.24-positive target cells. These data strongly suggest high antigen-loading specificity of the CTLs generated by AAV/HM1.24/Neo infection of DCs.
Target specificity (autologous targets). AAV/HM1.24 generated a CTL response against (A) HM1.24-positive (▪) and –negative (□) autologous targets. (A) Shown are CTL responses of 3 donors (each experiment performed in quadruplicate) and (B) a compilation of the results from all 3 donors. These data demonstrate that the cytotoxic response resulting from AAV/HM1.24/Neo vector loading of DC is antigen specific in a fully autologous system. CTLs were generated by AAV/HM1.24/Neo-loading (1 mL virus or approximately 2 × 10⁹ eg) DCs and T cells stimulated as described in Figure 2. Two target types were used: autologous PBMCs (no HM1.24 antigen) and PBMCs that had been preloaded with M1.24 antigen 4 days before the chromium release assay. Note that only the HM1.24-positive PBMC targets were killed by the CTLs.
Target specificity (autologous targets). AAV/HM1.24 generated a CTL response against (A) HM1.24-positive (▪) and –negative (□) autologous targets. (A) Shown are CTL responses of 3 donors (each experiment performed in quadruplicate) and (B) a compilation of the results from all 3 donors. These data demonstrate that the cytotoxic response resulting from AAV/HM1.24/Neo vector loading of DC is antigen specific in a fully autologous system. CTLs were generated by AAV/HM1.24/Neo-loading (1 mL virus or approximately 2 × 10⁹ eg) DCs and T cells stimulated as described in Figure 2. Two target types were used: autologous PBMCs (no HM1.24 antigen) and PBMCs that had been preloaded with M1.24 antigen 4 days before the chromium release assay. Note that only the HM1.24-positive PBMC targets were killed by the CTLs.
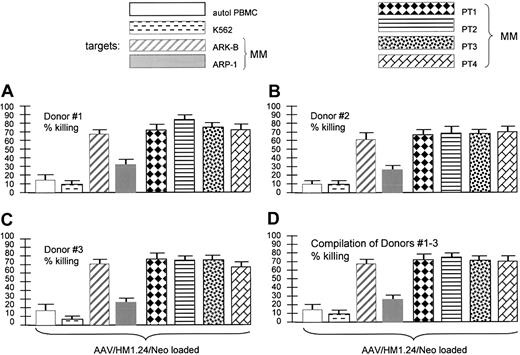
Target specificity (matched targets). AAV/HM1.24 generated a CTL response against various HM1.24-positive and -negative HLA-matched targets. The key shows the 8 target cells used in the experiments displayed in panels A-D. Stack of CTL experiments from each of 3 donors (panels A-C, each experiment performed in quadruplicate) and a compilation of the 3 experiments (D), as indicated. Of the target cells used, only autologous PBMCs and K562 cells were HM1.24 negative. All others displayed some level of HM1.24 expression by RT-PCR analysis (data not shown). Note that the 4 primary MM (HM1.24-positive) and both MM cell lines were killed by the HM1.24-stimulated CTLs. However, also note that HM1.24-negative PBMCs and K562 cells were not killed, indicating strong antigen specificity of the CTLs generated by AAV/HM1.24 loading.
Target specificity (matched targets). AAV/HM1.24 generated a CTL response against various HM1.24-positive and -negative HLA-matched targets. The key shows the 8 target cells used in the experiments displayed in panels A-D. Stack of CTL experiments from each of 3 donors (panels A-C, each experiment performed in quadruplicate) and a compilation of the 3 experiments (D), as indicated. Of the target cells used, only autologous PBMCs and K562 cells were HM1.24 negative. All others displayed some level of HM1.24 expression by RT-PCR analysis (data not shown). Note that the 4 primary MM (HM1.24-positive) and both MM cell lines were killed by the HM1.24-stimulated CTLs. However, also note that HM1.24-negative PBMCs and K562 cells were not killed, indicating strong antigen specificity of the CTLs generated by AAV/HM1.24 loading.
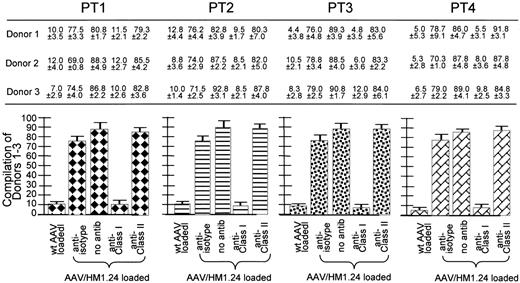
Class 1 restriction by the AAV/HM1.24-generated CTL response. The cell key is the same as that in Figure 7. These experiments are similar to those discussed in Figure 5 except here the target cells were preincubated with either anti-isotype, anti–class 1 antibody (W6/32), anti–class 2 antibody (L243), or no antibody. Shown at the top are the CTL responses (as percentage of killing) of 3 donors (each experiment performed in quadruplicate) against the MM cells from 4 patients. The experimental labels at the bottom of the figure identify these CTL responses. At the bottom are 4 subfigures, each a compilation of the results from all 3 donors against one of the patients. Note that the addition of anti–class 1 antibody significantly inhibited killing, whereas the addition of the others did not. Also note that the CTLs generated from wild-type AAV-loading DCs did not kill the HM1.24-positive targets. All donors HLA matched to the primary MM cells, as indicated by the key to Figure 7, are used in place of the HM1.24-positive autologous PBL targets. Note that, again, only the anti–class 1 antibody inhibited killing, strongly suggesting class 1–restricted killing by these CTLs.
Class 1 restriction by the AAV/HM1.24-generated CTL response. The cell key is the same as that in Figure 7. These experiments are similar to those discussed in Figure 5 except here the target cells were preincubated with either anti-isotype, anti–class 1 antibody (W6/32), anti–class 2 antibody (L243), or no antibody. Shown at the top are the CTL responses (as percentage of killing) of 3 donors (each experiment performed in quadruplicate) against the MM cells from 4 patients. The experimental labels at the bottom of the figure identify these CTL responses. At the bottom are 4 subfigures, each a compilation of the results from all 3 donors against one of the patients. Note that the addition of anti–class 1 antibody significantly inhibited killing, whereas the addition of the others did not. Also note that the CTLs generated from wild-type AAV-loading DCs did not kill the HM1.24-positive targets. All donors HLA matched to the primary MM cells, as indicated by the key to Figure 7, are used in place of the HM1.24-positive autologous PBL targets. Note that, again, only the anti–class 1 antibody inhibited killing, strongly suggesting class 1–restricted killing by these CTLs.
Dosage-dependent CTL killing. Shown are CTLs that resulted from AAV loading-dose responses of 3 donors (each experiment performed in quadruplicate) at the top and a compilation of the results from all 3 donors at the bottom. These experiments were similar to those discussed in Figure 5 except that the DCs were initially loaded (infected at day 0) with different amounts of the AAV/HM1.24/Neo virus, as indicated. “Lysate” refers to 293T cell lysates. This cell lysate contained no virus and was thus a mock infection. Target cells were generated by introduction of the HM1.24 gene into autologous PBLs 4 days before the CTL assay, as described in “Materials and methods.” Note that the resultant CTLs effected a level of killing that directly correlated with the amount of virus originally used for loading DCs at day 0.
Dosage-dependent CTL killing. Shown are CTLs that resulted from AAV loading-dose responses of 3 donors (each experiment performed in quadruplicate) at the top and a compilation of the results from all 3 donors at the bottom. These experiments were similar to those discussed in Figure 5 except that the DCs were initially loaded (infected at day 0) with different amounts of the AAV/HM1.24/Neo virus, as indicated. “Lysate” refers to 293T cell lysates. This cell lysate contained no virus and was thus a mock infection. Target cells were generated by introduction of the HM1.24 gene into autologous PBLs 4 days before the CTL assay, as described in “Materials and methods.” Note that the resultant CTLs effected a level of killing that directly correlated with the amount of virus originally used for loading DCs at day 0.
CTL killing at various effector-target ratios. The cell key is the same as that in Figure 7. These experiments are similar to those discussed in Figure 5 except that here the target cells were incubated with different amounts of effector T cells (giving different effector/target [E/T] ratios). As in Figure 5, these target cells were also preincubated with anti–class 1 antibody (W6/32), anti–class 2 antibody (L243), or no antibody. Shown is a 2-layer panel, and each panel includes the results using 2 MM targets (4 patients total). At the top of each panel are the CTL responses (as percentage of killing with standard deviation) of 3 donors (each experiment performed in quadruplicate) against the MM cells from 2 patients, as indicated. The experimental labels at the bottom of the figure and the target cell key identify these CTL responses, with the E/T ratio indicated at the bottom of each panel. Note that all donors' resultant CTLs effected a level of killing that directly correlated with the E/T ratio, with increasing ratios (increasing addition of CTLs) resulting in increasing target killing. Also note, as in Figure 8, the addition of anti–class 1 antibody-inhibited killing (again, anti–class 2 antibody did not inhibit killing).
CTL killing at various effector-target ratios. The cell key is the same as that in Figure 7. These experiments are similar to those discussed in Figure 5 except that here the target cells were incubated with different amounts of effector T cells (giving different effector/target [E/T] ratios). As in Figure 5, these target cells were also preincubated with anti–class 1 antibody (W6/32), anti–class 2 antibody (L243), or no antibody. Shown is a 2-layer panel, and each panel includes the results using 2 MM targets (4 patients total). At the top of each panel are the CTL responses (as percentage of killing with standard deviation) of 3 donors (each experiment performed in quadruplicate) against the MM cells from 2 patients, as indicated. The experimental labels at the bottom of the figure and the target cell key identify these CTL responses, with the E/T ratio indicated at the bottom of each panel. Note that all donors' resultant CTLs effected a level of killing that directly correlated with the E/T ratio, with increasing ratios (increasing addition of CTLs) resulting in increasing target killing. Also note, as in Figure 8, the addition of anti–class 1 antibody-inhibited killing (again, anti–class 2 antibody did not inhibit killing).
Experiments shown in Figure 5 were designed to test the antigen specificity of AAV-based DC loading. In this experimental type, 4 different DC loading treatments were carried out, each using 1 of 4 different AAV vectors (each containing a different transgene or wild-type AAV). Only one vector, AAV/HM1.24/Neo, contained the HM1.24 gene. The 4 different DC treatments by these vectors were then compared for their ability to stimulate CTL killing of HM1.24-positive cells. As can be seen, only T cells incubated with AAV/HM1.24/Neo-loaded DC were able to kill the HM1.24-positive autologous target cells. When used to load DCs, the other 3 AAV viruses—wt AAV, AAV/Neo, and AAV/E7/Neo, all lacking HM1.24—failed to stimulate killing of the HM1.24-positive targets. All 3 donors gave similar results. These data are fully consistent with a strong antigen-specific CTL response.
Experiments shown in Figure 6 were designed to test the specificity of killing by T cells stimulated by AAV/HM1.24/Neo-loaded DCs in a fully autologous system. We generated autologous targets by infecting donor PBMCs with AAV/HM1.24 virus (no Neo) 4 days before the CTL assay. These HM1.24-infected PBMCs were found to express HM1.24 by RT-PCR analysis, whereas unaltered PBMCs did not express HM1.24 (data not shown). The results show that only HM1.24-expressing autologous cells were targeted for killing, consistent with strong antigen specificity.
Experiments shown in Figure 7 were also designed to test the specificity of killing by T cells stimulated by AAV/HM1.24/Neo-loaded DCs. This time many different HLA-matched antigen-positive and antigen-negative targets were used. Although unaltered PBMCs and K562 cells did not express HM1.24, the MM cells from patients 1 to 4 did (data not shown), as did the 2 MM cell lines (Figure 1). The results showed that only HM1.24-expressing cells were targeted for killing. These data and those in Figure 6 are fully consistent with the resultant CTLs being highly HM1.24 specific.
Next class 1 restriction was examined using the 4 different PT1-4 cells as targets, as seen in Figure 8. Where indicated, the targets were preincubated with anti-isotype, anti–class 1, or anti–class 2 antibody. Anti–class 1 antibody, but not anti-isotype or anti–class 2 antibody, blocked CTL killing, strongly suggesting class 1 restriction.
A CTL assay type, shown in Figure 9 and similar to that in Figure 5, was designed to test the dose-dependent nature of AAV-based DC loading on CTL killing. In this experiment, 3 different dosages of AAV/HM1.24/Neo vector were used for DC loading and a zero virus control (lysate). The percentage of target killing effected by the stimulated T cells directly correlated with the amount of AAV/HM1.24/Neo used to load the DCs at day 0. Finally, in Figure 10, different effector-target ratios were used to test how robust CTL killing efficiency was. Killing of the targets was indeed dependent on the effector-target ratio, with a higher ratio resulting in higher killing.
Immunophenotypes and cytokine profiles of T cells
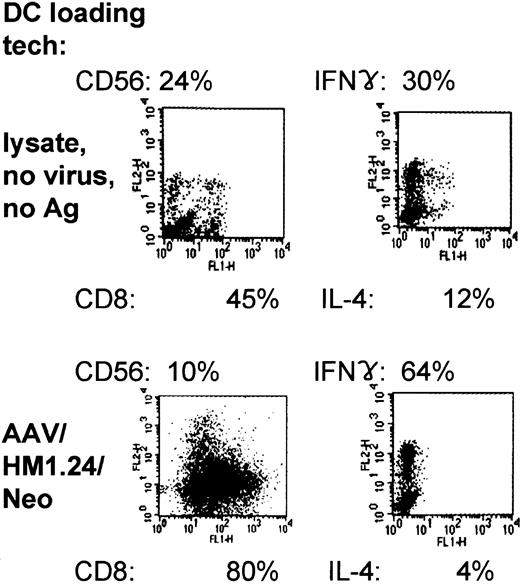
Immunophenotyping of the AAV/HM1.24/Neo-loaded, DC-primed T-cell populations showed that they expressed predominantly CD8 (80%), in contrast to lysate-loaded, mock-infected cells (45%) (Figure 11). Furthermore, the CD8/CD56 ratio was substantially higher inAAV loading, increasing from a ratio of 1.9:8. To determine the cytokine profile of the T cells generated from coculture with AAV/HM1.24/Neo-loaded DCs or lysate-loaded DCs, we carried out intracellular staining of these T cells for IFN-γ and IL-4. Figure 11 demonstrates that most (64%) of the AAV/HM1.24-loaded or -primed T cells expressed IFN-γ and that few (4%) expressed IL-4, suggesting that these cells are of the TH1 (helper) and TC1 (cytotoxic) phenotypes. A smaller proportion (30%) of IFN-γ–producing T cells were observed in the T-cell populations primed by lysate (mock)–loaded DCs (zero virus control).
Two-color flow cytometric characterization and intracellular cytokine expression in primed T-cell populations. Representative experiment of 3 independent experiments (each using a different donor). Shown are the results of FACS analysis, giving CD8 and CD56 prevalence within the primed population resulting from lysate- or AAV/HM1.24/Neo-loading techniques. In addition, the intracellular prevalences of IFN-γ and IL-4 within primed and stimulated mixed T-cell populations are shown, resulting from lysate- and AAV/HM1.24/Neo-loading techniques. Note that the use of AAV/HM1.24/Neo loading resulted in a higher IFN-γ/IL-4 ratio and a lower CD56/CD8 ratio.
Two-color flow cytometric characterization and intracellular cytokine expression in primed T-cell populations. Representative experiment of 3 independent experiments (each using a different donor). Shown are the results of FACS analysis, giving CD8 and CD56 prevalence within the primed population resulting from lysate- or AAV/HM1.24/Neo-loading techniques. In addition, the intracellular prevalences of IFN-γ and IL-4 within primed and stimulated mixed T-cell populations are shown, resulting from lysate- and AAV/HM1.24/Neo-loading techniques. Note that the use of AAV/HM1.24/Neo loading resulted in a higher IFN-γ/IL-4 ratio and a lower CD56/CD8 ratio.
Characterization of DCs by various manipulations
Finally, we phenotyped the DCs generated from the lysate-loaded, wild-type, AAV-loaded, and AAV/HM1.24/Neo-loaded DC populations from 4 patients (4 times each) using flow cytometry. DCs generated by all 3 techniques share common DC markers (Table 2). As can be further seen in Table 3, the mean fluorescence intensity (MFI) for all 3 markers—costimulatory CD80, CD86, and CD40— was significantly increased (P = .000 to P = .042) by AAV/HM1.24/Neo and wild-type AAV compared with the lysate control. Of the 3 markers, CD80 was up-regulated the most (2.6- to 3.8-fold increase), followed by CD86 and CD40 (both approximately 1.5-fold). The percentage of cells expressing these markers was also higher in wild-type AAV and AAV/HM1.24. Thus, in addition to the ability of AAV vectors to transduce high percentages of DCs,21,22 the up-regulation of these multiple costimulatory molecules could help to explain the rapid CTL expansion observed.
Characterization of DCs on day 7 under different conditions: quantification of data from 4 donors
DC surface markers . | DC treatment: (4 donors) . | . | . | ||
|---|---|---|---|---|---|
| . | lysate (mock) . | wt AAV . | AAV/HM1.24/Neo . | ||
| CD14 | |||||
| % | 11.8 ± 4 | 12.3 ± 2 | 11.3 ± 2 | ||
| MFI | 148.3 ± 58 | 118.3 ± 41 | 112.0 ± 45 | ||
| CD80 | |||||
| % | 70.0 ± 8 | 77.8 ± 6.6 | 91.0 ± 6 | ||
| MFI | 713.0 ± 195 | 1857.0 ± 165* | 2729.0 ± 751* | ||
| CD86 | |||||
| % | 72.2 ± 5 | 83.0 ± 5 | 86.0 ± 6 | ||
| MFI | 1216.0 ± 275 | 1983.0 ± 87* | 1709.0 ± 127 | ||
| CD40 | |||||
| % | 65.5 ± 6 | 74.5 ± 5 | 81.8 ± 1 | ||
| MFI | 937.0 ± 122 | 1401.0 ± 291 | 1356.0 ± 187 | ||
Monocytes from 4 donors were generated by the 3 loading techniques and were stimulated to differentiate into DCs by GM-CSF and IL-4, as indicated in “Materials and Methods” and shown in Figure 2. Values shown indicate mean ± SD. Three DC populations were analyzed using FACS for MFI and percentage of positivity. For the analysis of DCs, a panel of mAbs recognizing the following antigens was used: anti-CD40 (Immunotech, Marseilles, France), anti-CD14, anti-CD80 (BD Biosciences), and anti-CD86 (BD Biosciences-PharMingen, San Diego, CA). Data represent 4 independent experiments performed in quadruplicate.
MFI indicates mean fluorescence intensity.
% indicates percentage of positivity.
indicates the largest difference from the lysate control.
P values for indicated comparisons of DCs on day 7
. | MFI P values . | . | . | ||
|---|---|---|---|---|---|
| Marker . | Lysate vs wt AVV . | Lysate vs AAV/HM1.24/Neo . | AAV/HM1.24/Neo vs wt AVV . | ||
| CD14 | NS | NS | NS | ||
| CD80 | .016 | .000 | NS | ||
| CD86 | .001 | .010 | NS | ||
| CD40 | .033 | .042 | NS | ||
. | MFI P values . | . | . | ||
|---|---|---|---|---|---|
| Marker . | Lysate vs wt AVV . | Lysate vs AAV/HM1.24/Neo . | AAV/HM1.24/Neo vs wt AVV . | ||
| CD14 | NS | NS | NS | ||
| CD80 | .016 | .000 | NS | ||
| CD86 | .001 | .010 | NS | ||
| CD40 | .033 | .042 | NS | ||
Data represent 4 independent experiments performed in quadruplicate.
NS indicates not significant.
Discussion
Other investigators and we21,22 have hypothesized that antigen gene delivery into DCs may be more efficient for generating CTLs than delivering the antigen as a lipofected, exogenous protein. Although there is some controversy as to AAV effectiveness at transducing DCs and some other hematopoietic cells, we have not yet found a donor whose monocytes/DCs are unable to be transduced by AAV-2.20-22 Furthermore, in various studies, AAV has been shown to be an effective gene-delivery vector for immortalized tissueculture cells and primary hematopoietic cells.20-22,27-35 We recently showed that it is possible to successfully transduce, with chromosomal integration, the GM-CSF cytokine and the human papillomavirus (HPV) E6 and E7 antigen genes into monocytes and derived DCs by rAAV.20-22 In fact, this DC-loading technique was found to be highly effective, generating significant CTLs with only one DC–T-cell coincubation and in only 1 week. To our knowledge no other group is using our technique of transducing monocyte-derived DCs with rAAV. This occurs by first treating the rAAV-infected monocytes with only GM-CSF and then adding IL-4 after several days to induce differentiation into DCs. This technique converts more than 90% of DCs.22
Our previous studies show that rAAV-loading DCs can rapidly generate antigen-specific CTLs against viral antigens.21,22 Here we have increased the difficulty of CTL generation by studying a self-antigen, the late B-cell marker HM1.24. Generating a rapid CTL response against a self-antigen would likely be a more difficult task because putatively there would be a lower (approximately 1% that for viral antigens) precursor T-cell frequency against such autoantigens. We have demonstrated here that rAAV-loading of DCs with HM1.24 generated antigen-specific CTLs in substantial numbers, in only 1 week and 1 stimulation, as we have found for generating CTLs against viral antigens.21,22 Another group has also recently demonstrated that AAV is effective at stimulating T-cell response against self antigens.36 Based on this and our previous studies, we hypothesize that the AAV vector causes a fundamental change in DC performance, perhaps by modifying costimulatory ligand expression on DCs that results in more efficient generation of antigen-specific CTLs.21,22 In fact, Tables 2 and 3 illustrate high CD80, CD86, and CD40 upregulation stimulated by either rAAV infection or wild-type AAV. The similarity of up-regulation of these costimulatory molecules by wild-type AAV and AAV/HM1.24/Neo suggests that most likely something within the virus particle itself causes this increase in expression, possibly the AAV viral capsid proteins. This hypothesis can be tested. For CD80, with the marker most strongly upregulated, AAV and the HM1.24 transgene may contribute to this up-regulation.
Some may argue that the CTL expansion we observe is simply too rapid to be antigen specific and that what we observe is possibly nonspecific killing or NK activity. Yet our controls show strong antigen specificity and MHC class 1 restriction. For example, the second lane of Figure 5B demonstrates that autologous PBLs are not targeted for killing unless these target cells have been preloaded with antigen (lanes 3-5). Without loading the antigen, there is no significant killing. Furthermore, the lack of involvement of NK cells in the killing we observe is demonstrated in 2 different assay systems. First, K562 cells are shown in Figures 5B and C not to be significant targets. Second, our stimulated T-cell populations contain only low levels of NK cells, as shown in Figure 6. We can find no evidence of significant, nonspecific killing activity.
This issue can be further addressed on a mathematical level if the frequency of self-antigen–recognizing T cells and the speed of T-cell replication are known. It has been reported that once activated, T cells are capable of dividing 2 to 6 times in 24 hours.37,38 It has also been reported that self-antigen–specific T cells, for any particular protein, are usually present at frequencies of 10–5 cells—approximately 100-fold more rare than virus-specific T cells.39,40 Therefore, when we use approximately 107 T cells for stimulation in our assays, it is mathematically possible to generate anywhere from 105 to 109 antigen-specific T cells in a 1-week expansion. In any case, our data strongly support that AAV-loading–derived CTLs are antigen/HM1.24 specific.
We believe it likely that there are multiple reasons why AAV loading of DCs is effective. One reason is the high transduction frequency we have observed (more than 90% DC transduction, viral genetic alteration). The increased expression of CD80, CD86, and CD40 may also contribute to generating the robust CTL response. Ultimately, we would like to uncover all the mechanisms of action that make AAV-based loading so effective. This study also suggests that HM1.24 may be a useful target for antimyeloma immunotherapy. The ARK-B myeloma cell line and the 3 patient MM cells were shown to be excellent targets for anti-HM1.24–sensitized T cells (more than 70% killing), whereas the other cell line (ARP-1) showed lower target killing (30%). Our findings suggest that rAAV/antigen gene loading of DCs may be a particularly good protocol for CTL generation against self-antigens that may not otherwise be considered good targets because of low immunogenicity (for example, the MM idiotype).
Prepublished online as Blood First Edition Paper, July 10, 2003; DOI 10.1182/blood-2002-11-3580.
Supported in part by a grant from the Women's Health Research Institute, Texas Tech University Health Sciences Center at Amarillo Internal Grant Program.
M.C.-I. and Y.L. contributed equally to this work.
The authors declare that they have no competing financial interests.
The publication costs of this article were defrayed in part by page charge payment. Therefore, and solely to indicate this fact, this article is hereby marked “advertisement” in accordance with 18 U.S.C. section 1734.
We thank Drs Carlo Croce and Soldano Ferrone for reviewing this manuscript and for many helpful discussions. We also thank the University of Arkansas for Medical Sciences Office of Grants and Scientific Publications for editorial assistance during the preparation of this manuscript.



![Figure 10. CTL killing at various effector-target ratios. The cell key is the same as that in Figure 7. These experiments are similar to those discussed in Figure 5 except that here the target cells were incubated with different amounts of effector T cells (giving different effector/target [E/T] ratios). As in Figure 5, these target cells were also preincubated with anti–class 1 antibody (W6/32), anti–class 2 antibody (L243), or no antibody. Shown is a 2-layer panel, and each panel includes the results using 2 MM targets (4 patients total). At the top of each panel are the CTL responses (as percentage of killing with standard deviation) of 3 donors (each experiment performed in quadruplicate) against the MM cells from 2 patients, as indicated. The experimental labels at the bottom of the figure and the target cell key identify these CTL responses, with the E/T ratio indicated at the bottom of each panel. Note that all donors' resultant CTLs effected a level of killing that directly correlated with the E/T ratio, with increasing ratios (increasing addition of CTLs) resulting in increasing target killing. Also note, as in Figure 8, the addition of anti–class 1 antibody-inhibited killing (again, anti–class 2 antibody did not inhibit killing).](https://ash.silverchair-cdn.com/ash/content_public/journal/blood/102/9/10.1182_blood-2002-11-3580/6/m_h82135182010.jpeg?Expires=1769162923&Signature=DPT-y26RRFW~mUbUkjNSzLc6-F2I1cd6sgL0FWNlpJM2MsV4MbTfvvPqlMWOFxz02BEMo7sTP-4ZV1PEbd4FYsLMJqEMKvLPdHdocUiAYJ1W-QPFzOCZYAc8Cfq6-QuE7wUxlDHXExBR0URL5rilyON7DmkuierR83FY7ookNOK6rVNL9OoGelwayRVImxH0SkMyxmUZY3uSZMxsWMnCfm4krVauSIwHzFKGX90-eV2veS3nVm6FxKp57CXT-i3x8vPY8JSn8QrqmCkI6NFeMRgY~Gn-EM8EHRwfmgxJdBZ1uSP7lQKU3fvTyMd16tvzjxhYWcTSa243wo5QPqzFIA__&Key-Pair-Id=APKAIE5G5CRDK6RD3PGA)
This feature is available to Subscribers Only
Sign In or Create an Account Close Modal