Abstract
LIGHT is a tumor necrosis factor (TNF) family member and is expressed on activated T cells. Its known receptors are TR2 and LTβR on the cell surface, and TR6/DcR3 in solution. TR6/DcR3 is a secreted protein belonging to the TNF receptor family. It binds to Fas ligand (FasL), LIGHT, and TL1A, all of which are TNF family members. In the present study, we report that solid-phase TR6-Fc costimulated proliferation, lymphokine production, and cytotoxicity of mouse T cells upon T-cell receptor (TCR) ligation. A monoclonal antibody against LIGHT similarly costimulated mouse T cells in their proliferation response to TCR ligation. These data suggest LIGHT, although a ligand, can receive costimulation when expressed on the T-cell surface. Mechanistically, when T cells were activated by TCR and CD28 co–cross-linking, TCR and rafts rapidly formed caps where they colocalized. LIGHT rapidly congregated and colocalized with the aggregated rafts. This provided a molecular base for the signaling machinery of LIGHT to interact with that of TCR. Indeed, LIGHT cross-linking enhanced p44/42 mitogen-activated protein kinase activation after TCR ligation. This study reveals a new function and signaling event of LIGHT.
Introduction
LIGHT/TL5 is a new member of the tumor necrosis factor (TNF) family, with its protein expressed on activated T cells1 and immature dendritic cells.2 It is a ligand for TR2/HVEM, LTβR, and TR6/DcR3, all of which are TNF receptor (TNFR) family members.1,3,4Recent studies show that LIGHT can costimulate T-cell responses via TR2.2,5,6 LIGHT can also induce apoptosis in cells expressing both TR2 and LTβR,7 although Rooney et al8 reported that LTβR is necessary and sufficient for LIGHT-mediated apoptosis in tumor cells. However, LTβR is not expressed on lymphocytes.9
Several TNF members on cell surfaces can reversely transduce signals into cells. Cayabyab et al10 and Van Essen et al11 have shown that CD40L transduces costimulation signals into T cells. Wiley et al12 have reported that CD30L cross-linking activates neutrophils, and Cerutti et al13 showed that such reverse signaling inhibits the immunoglobin class switch in B cells. Reverse signaling through membrane TNF-α confers resistance of monocytes and macrophages to lipopolysaccharide.14 Cross-linking of TRANCE enhances interferon-γ (IFN-γ) secretion by activated Th1 cells.15 Reverse signaling through Fas ligand (FasL) can promote maximal proliferation of CD8 cytotoxic T cells.16-18 Cross-linking of TRAIL by its solid-phase death receptor 4 increases IFN-γ production and T-cell proliferation.19 Whether LIGHT can reversely transduce signals into T cells has not been assessed.
TR6/DcR3 is a new member of the TNFR family. Human TR6 lacks an apparent transmembrane domain in its sequence and is a secreted protein.3,20 Mouse TR6 has not been cloned. Human TR6 has 3 known ligands, FasL,13 LIGHT,3,4 and TL1A.21 FasL binding by TR6 interferes with the interaction between Fas and FasL. Consequently, FasL-induced apoptosis of lymphocytes and of several tumor cell lines can be repressed by TR6.20 We have recently reported that soluble human TR6-Fc can suppress cytotoxic T lymphocyte (CTL) and lymphokine production of mouse lymphocytes and inhibit mouse heart allograft rejection.3 These findings have raised the possibility that TR6 inhibits LIGHT-triggered costimulation via TR2 in T cells.
We have presented evidence in this article that TR6 can trigger LIGHT to transduce signals into T cells and enhance the T-cell response to TCR stimulation in a mouse model. Such signaling is preceded by rapid congregation of LIGHT into the T-cell cap on the cell surface, followed by p42/44 mitogen-activated protein kinase (MAPK) activation. Thus, although a ligand, LIGHT can function as a receptor as well. The biologic significance of this finding is discussed.
Materials and methods
Lymphocyte preparation and culture
Mouse total spleen cells were prepared by lysing red blood cells with 0.84% NH4Cl, as described elsewhere.22Spleen T cells were purified by deleting Ig+ and adhesion cells with T-cell columns according to the manufacturer's instructions (Cedarlane, Hornby, ON, Canada). CD4 and CD8 T cells were prepared from total spleen cells by positive selection, using magnetic beads according to the manufacturer's instructions (Miltenyi Biotec, Auburn, CA). The cells were cultured in RPMI 1640 supplemented with 10% fetal calf serum (FCS), l-glutamine, and antibiotics. RPMI 1640, FCS, penicillin-streptomycin, and l-glutamine were purchased from Invitrogen (Burlington, ON, Canada). Solid phase TR6-Fc and anti-CD3 were prepared by coating Nunc plates with 5 μg/mL goat anti–human IgG (Southern Biotechnology, Birmingham, AL) along with various concentrations of anti-CD3 in phosphate-buffered saline (PBS) overnight at 4°C. After washing, the plates were incubated with TR6-Fc or a control fusion protein TR11-Fc of desired concentrations in PBS at 37°C for 2 hours. After washing, the coated plates were used for culture. 3H-thymidine uptake was measured as described previously.23 24
Lymphokine assays
Interleukin 2 (IL-2) and IFN-γ in culture supernatants were measured by commercial enzyme-linked immunosorbent assay (ELISA) kits from R & D Systems (Minneapolis, MN).
Cytotoxic T-cell assay
The assay was performed as detailed previously.3Briefly, 2C mouse spleen cells (4 × 10⁶ cells/2 mL/well, H-2b) were stimulated with an equal amount of mitomycin C–treated BALB/c mouse spleen cells (4 × 10⁶ cells/2 mL/well, H-2d) in flat-bottomed 24-well plates, which were precoated with goat anti–human IgG (5 μg/mL) followed by TR6-Fc (10 μg/mL) or normal human IgG (10 μg/mL), in the presence of 10 U/mL IL-2 for 6 days. Human LIGHT (20 μg/mL) was added to the culture in the beginning of certain cultures. On day 6, cells receiving the same treatment in 24-well plates were pooled and counted, and their CTL activity was measured by a standard 4-hour 51Cr-release assay, using 51Cr-labeled P815 cells (H-2d) as targets at different effector-target ratios. The lysis percentage of the test sample was calculated as follows:
Flow cytometry
Mouse spleen cells, cultured in medium or stimulated with concanavalin A (Con-A; 2 μg/mL) for 24 hours, were first cross-linked by anti-CD3 and anti-CD28 hamster monoclonal antibody (mAb) followed by goat anti–hamster IgG, as detailed in the section on confocal microscopy below. After fixing with 3.7% formalin, the cells were stained with a human anti–human LIGHT mAb (clone 1.2.2, 0.1 μg/106 cells), followed by phycoerythrin (PE)–F(ab)′2 of goat anti–human IgG (Southern Biotechnology) and fluorescein isothiocyanate (FITC)–anti–Thy-1.2 (clone 53-2.1, Pharmingen, San Diego, CA). In some samples, TR6 without the Fc tag (5 μg/sample) or human LIGHT (5 μg/sample) was present as inhibitors during the staining process. Thy-1.2+ cells were gated and analyzed for anti-LIGHT intensity.
Confocal microscopy
Five million BALB/c T cells were first blocked with 100 μL PBS containing 2% bovine serum albumin (BSA) for 30 minutes. Then, 5 μg anti-CD28 (clone 37.51.1, hamster mAb, Cedarlane) and 2 μg biotinylated anti-CD3 (clone 2C11, hamster mAb) were added to the cell suspension, which was incubated for an additional 30 minutes. After washing with cold PBS, the cells were reacted with goat anti–hamster IgG (5 μg/sample) for 30 minutes. All the procedures above were conducted at 4°C. The cells were washed with cold PBS and transferred to 200 μL warm PBS to start the 10-minute cross-linking process at 37°C. They were then fixed immediately with 3 mL 3.7% formalin at room temperature for an additional 10 minutes. For T-cell receptor (TCR) and LIGHT staining, the fixed cells were reacted with TR6-Fc (2 μg/106 cells) for 30 minutes on ice. After washing with PBS, the cells were stained with Alexa 488-goat anti–human IgG (1 μg/106cells) and Alexa 594–streptavidin (1 μg/106 cells) on ice for another 30 minutes. For raft and LIGHT staining, the procedure was similar to that described above, but Alexa 594–conjugated cholera toxin (1 μg/sample) was used instead of Alexa 594–streptavidin. The stained cells were then washed with PBS and mounted on slides with Prolong antifade mounting medium (Molecular Probes, Eugene, OR). The slides were examined under a confocal microscope. Digital images were processed with Photoshop (Adobe, Seattle, WA).
Immunoblotting
Plates (24-well) were coated with anti–human IgG (5 μg/mL, 300 μL/well) and a suboptimal concentration of anti-CD3 (0.2 μg/mL, 300 μL/well) overnight at 4°C. After washing, the wells were incubated with TR6-Fc (10 μg/mL, 300 μL/well) or a control fusion protein TR11-Fc (10 μg/mL, 300 μL/well) at 37°C for 2 hours. Mouse spleen T cells were treated with cytochalasin D (15 μM) in complete culture medium or medium containing a similar percentage of vehicle (dimethyl sulfoxide [DMSO]) for 2 hours. After washing, the cells were seeded in precoated plates at 5 × 10⁶cells/well, and the plates were centrifuged at 228g for 5 minutes to achieve rapid contact between the cells and the bottom of the culture wells. The cells were then cultured at 37°C for 90 minutes before being harvested. The remaining procedures were detailed in our previous publication.22 Briefly, the cells were washed and lysed in lysis buffer for 10 minutes; the cleared lysates were resolved by 10% sodium dodecyl sulfate–polyacrylamide gel electrophoresis (SDS-PAGE). The proteins were then transferred to nitrocellulose membranes, which were sequentially hybridized with rabbit anti–phospho-p44/42 MAPK and anti-p44/42 MAPK antibody (New England Biolabs, Mississauga, ON, Canada). Immunoreactive protein bands were visualized using horseradish peroxidase–conjugated goat anti–rabbit IgG followed by enhanced chemiluminescence.
Results
Solid-phase TR6-Fc enhances proliferation of mouse T cells stimulated by suboptimal concentrations of anti-CD3
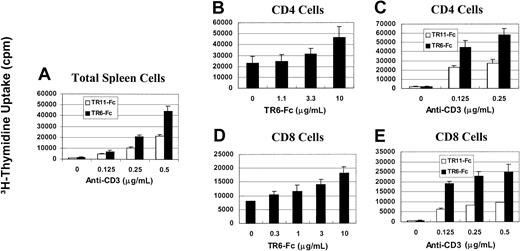
We investigated whether LIGHT, although a ligand, could transduce stimulating signals reversely into T cells. To this end, we used one of the receptors of LIGHT, TR6, in solid phase to cross-link LIGHT on mouse T cells. Because mouse TR6 has not been cloned, and human TR6 can bind to mouse LIGHT,3 recombinant human TR6 with an Fc tag was used. As shown in Figure 1A, human TR6 in solid phase (10 μg/mL, all the concentrations in this section refer to those used during coating of the wells) could enhance the proliferation of total spleen cells stimulated with anti-CD3 in solid phase, compared with a control fusion protein TR11-Fc. The enhancement was obvious with anti-CD3 at 0.25 μg/mL or 0.5 μg/mL. To assess whether both CD4 and CD8 cells were responsive to the TR6 stimulation, they were purified from total spleen cells with magnetic beads and stimulated with a fixed amount of anti-CD3 (0.2 μg/mL) and various concentrations of TR6-Fc. At 10 μg/mL, TR6-Fc had an obvious stimulatory effect on the proliferation of both CD4 and CD8 cells (Figure 1B,D). Next, TR6-Fc was tested at a fixed optimal concentration of 10 μg/mL along with different concentrations of anti-CD3. As shown in Figure 1, panels C and E, both CD4 and CD8 T cells were responsive to TR6 costimulation when anti-CD3 was used at several suboptimal concentrations from 0.125 to 0.5 μg/mL. The results of this section show that LIGHT ligation by TR6 costimulates CD4 and CD8 T cells in their proliferation response to TCR cross-linking.
Solid-phase TR6-Fc promotes proliferation of anti-CD3–stimulated total spleen cells and CD4 and CD8 T cells.
Mouse spleen cells (A), CD4 cells (B,C) or CD8 cells (D,E) were stimulated with solid-phase anti-CD3 and TR6-Fc. When anti-CD3 was used at different doses, TR6-Fc and its control, TR11-Fc, were tested at an optimal dose of 10 μg/L. When TR6-Fc was used at different doses, anti-CD3 was used at a suboptimal dose of 0.2 μg/mL. These concentrations referred to those used during the well-coating process. Cell proliferation was measured by 3H-thymidine uptake between 48 and 64 hours after the initiation of culture. Means ± SD of the counts per minute from triplicate samples are shown. The experiments were performed more than 3 times, and a representative set of data is presented.
Costimulation through LIGHT enhances lymphokine secretion by T cells
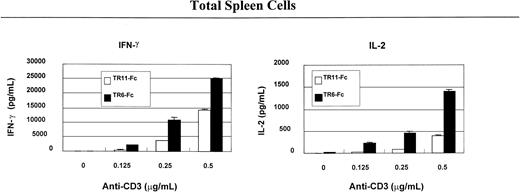
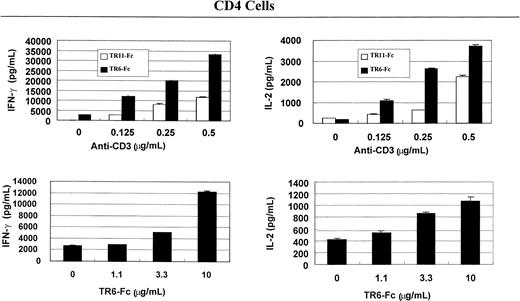
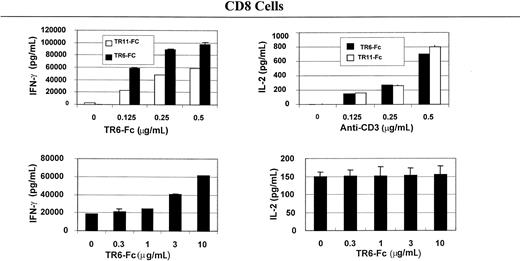
To understand the immunologic consequences of costimulation through LIGHT, we examined lymphokine secretion by total spleen cells and CD4 and CD8 T cells. As shown in Figure2, solid-phase TR6-Fc (10 μg/mL, the concentrations indicated in this section refer to those used during coating of the wells), compared with control fusion protein TR11-Fc, significantly augmented IFN-γ and IL-2 secretion of total spleen cells stimulated with 0.25 μg/mL or 0.5 μg/mL anti-CD3, which was also in solid phase. Lymphokine secretion by CD4 (Figure3) and CD8 (Figure4) cells was evaluated next. TR6-Fc in solid phase dose-dependently enhanced IFN-γ and IL-2 secretion by CD4 cells in the presence of a suboptimal concentration of anti-CD3 (0.125 μg/mL). With an optimal concentration of TR6-Fc (10 μg/mL), an increased amount of anti-CD3 dose-dependently augmented the secretion of these lymphokines (Figure 3), compared with cultures stimulated with TR11-Fc. CD8 T cells produced more IFN-γ than CD4 cells on costimulation through LIGHT, but did not augment IL-2 secretion when different TR6-Fc or anti-CD3 concentrations were used in combination (Figure 4). These data show that costimulation through LIGHT differentially augments lymphokine production by CD4 and CD8 T cells in mice.
TR6-Fc strongly augments lymphokine production by anti-CD3–stimulated spleen cells.
Mouse total spleen cells were stimulated with solid-phase anti-CD3 and TR6-Fc. The culture conditions were the same as described in Figure 1. The culture supernatants were harvested at 48 hours after the initiation of the culture and were tested for lymphokines with ELISA. Samples were studied in duplicate, and the means ± SD of lymphokine levels are shown. The experiments were conducted at least twice with similar results. A representative set of data is shown.
TR6-Fc strongly augments lymphokine production by anti-CD3–stimulated CD4 cells.
Mouse spleen CD4 cells were stimulated with solid-phase anti-CD3 and TR6-Fc, and cytokines in the supernatants were measured with ELISA, as described in Figure 2. Data are represented as means ± SD.
TR6-Fc strongly augments lymphokine production by anti-CD3–stimulated CD4 cells.
Mouse spleen CD4 cells were stimulated with solid-phase anti-CD3 and TR6-Fc, and cytokines in the supernatants were measured with ELISA, as described in Figure 2. Data are represented as means ± SD.
TR6-Fc strongly augments lymphokine production by anti-CD3–stimulated CD8 cells.
Mouse spleen CD8 cells were stimulated with solid-phase anti-CD3 and TR6-Fc, and cytokines in the supernatants were measured with ELISA, as described in Figure 2. Data are represented as means ± SD.
TR6-Fc strongly augments lymphokine production by anti-CD3–stimulated CD8 cells.
Mouse spleen CD8 cells were stimulated with solid-phase anti-CD3 and TR6-Fc, and cytokines in the supernatants were measured with ELISA, as described in Figure 2. Data are represented as means ± SD.
Costimulation through LIGHT augments CTL activity
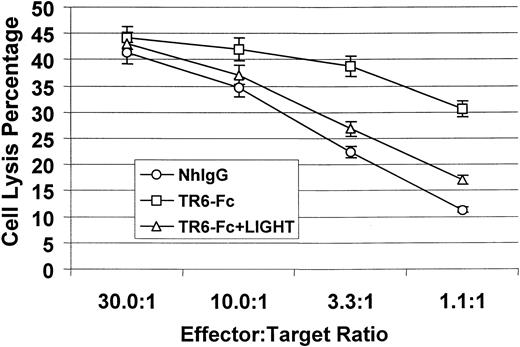
To further assess the functional consequence of LIGHT costimulation, we examined CTL development in the presence of solid-phase TR6-Fc. We used an established CTL assay system, in which the responders were spleen cells from transgenic 2C mice (in H-2b background), and the stimulators were mitomycin C–treated BALB/c (H-2d) spleen cells.3 Almost all T cells in 2C mice carry transgenic Ld-specific TCR, and the majority (about 75%) of their T cells are CD8+.25 Compared with control human IgG, in the presence of solid phase TR6-Fc, CTL development was significantly enhanced, as shown in Figure 5. Such enhancement could be neutralized by soluble human LIGHT, indicating that the stimulation by TR6-Fc was specific. Therefore, costimulation through LIGHT enhances CTL activity.
Effect of LIGHT reverse signaling on CTL development.
2C mouse spleen cells (4 × 10⁶ cells/2 mL/well) were mixed with an equal amount of mitomycin C– treated BALB/c mouse spleen cells (4 × 10⁶cells/2 mL/well) and seeded in flat-bottomed 24-well plates, which were precoated with TR6-FC (10 μg/mL) or normal human IgG (NhIgG, 10 μg/mL) as a control. Soluble human LIGHT (20 μg/mL) was added at the beginning of the culture in certain samples as indicated. The cells were cultured in the presence of 10 U/mL IL-2 for 6 days. CTL activity in the stimulated cells was then measured by a standard 4-hour51Cr-release assay, using P815 cells as targets. The samples were tested in triplicate, and means ± SD of percentage of target cell lysis are shown. The experiments were performed twice with similar results, and the data of a representative experiment are presented.
Anti–human LIGHT mAb binds to mouse LIGHT and costimulates mouse T cells
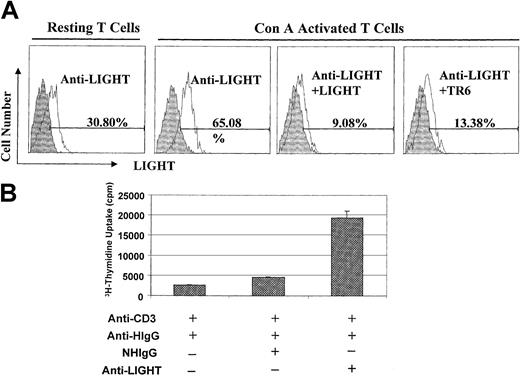
In the previous sections, human TR6 was used to engage mouse LIGHT, because human TR6 can bind to mouse LIGHT and because it is a physiologically relevant receptor for LIGHT. However, we could not exclude the possibility that human TR6 exerted its effect through FasL or other so-far unidentified TNF family members other than LIGHT. We, therefore, used a human anti–human LIGHT mAb to further pinpoint LIGHT on mouse T cells as the molecule receiving costimulation. We showed that it could bind to about 30% of resting spleen T cells, and binding increased to 65% after T-cell activation with Con-A overnight (Figure6A). This binding pattern was consistent with the documented expression pattern of LIGHT in T cells in that its expression was augmented after T-cell activation.26 The binding could be blocked by soluble human LIGHT, indicating that the mAb was specific. Moreover, the binding could also be blocked by soluble TR6, suggesting that both TR6 and the mAb competitively interacted with the same ligand on the T-cell surface. Taken together, these results indicate that the anti–human LIGHT mAb binds to mouse LIGHT. We next assessed whether the mAb could costimulate T cells, as with TR6-Fc. This human mAb (10 μg/mL) was anchored on plates via goat anti–human IgG (5 μg/mL) in the presence or absence of a suboptimal concentration of anti-CD3 (0.2 μg/mL). As shown in Figure6B, the anti-LIGHT mAb significantly promoted T-cell proliferation, compared with control normal human IgG. Thus, these data confirm that LIGHT on T cells can indeed receive costimulation.
Anti–human LIGHT mAb binds to mouse LIGHT and costimulates mouse T cells.
(A) Anti-LIGHT mAb binds to mouse T cells according to flow cytometry. Resting BALB/c spleen cells or spleen cells activated by Con-A (2 μg/mL) for 24 hours were cross-linked with anti-CD3 and anti-CD28 hamster mAb followed by goat-anti–hamster IgG. After fixing with 3.7% formalin, the cells were stained with anti–human LIGHT mAb (clone 1.2.2) followed by PE-F(ab)′2 of goat anti–human IgG, along with FITC–anti-Thy1.2. In some samples, soluble human LIGHT (5 μg/sample) or TR6 without the Fc tag (5 μg/sample) was added as inhibitors during the staining process. The cells were analyzed by 2-color flow cytometry, and LIGHT expression on Thy1.2+cells is shown in the histograms. Shaded areas represent cells stained with an isotypic control mAb, and solid lines represent cells stained with anti-LIGHT mAb. (B) Anti-LIGHT mAb costimulates mouse T-cell proliferation. Nunc 96-well plates were coated with a suboptimal concentration of anti-CD3 (0.2 μg/mL) along with goat anti–human IgG (anti-HIgG, 5 μg/mL) overnight at 4°C. After washing, the wells were reacted with normal human IgG (10 μg/mL) or human mAb against human LIGHT (10 μg/mL) at 37°C for 2 hours. The wells were washed and BALB/c T cells were seeded into the wells at 4 × 10⁵cells/well. 3H-thymidine uptake was measured between 48 and 64 hours. The samples were in triplicate, and the means ± SD of counts per minute are shown. The experiments were performed twice with similar results, and the data of a representative experiment are presented.
Signaling events after costimulation through LIGHT
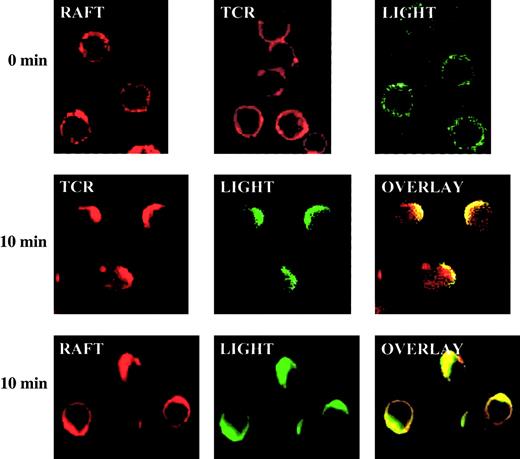
To understand the molecular basis of LIGHT costimulation, we examined the molecular migration of LIGHT and TCR and their relationship with lipid rafts on T-cell membranes immediately after TCR and CD28 co–cross-linking. T cells were preincubated with anti-CD3 and anti-CD28, followed by a second antibody on ice. CD3 and CD28 co–cross-linking started when the cells were transferred to 37°C. The lipid rafts in the T-cell membrane were stained by Alexa 594–cholera toxin in red; TCR was stained by Alexa 594–streptavidin in red; LIGHT was stained in green by TR6-Fc followed by Alexa 488–anti–human IgG. TCR and LIGHT were distributed throughout the surface in the resting T cells, with TCR spreading more evenly, whereas rafts and LIGHT appeared in speckles (first row, Figure7). After 10 minutes of co–cross-linking with anti-CD3 and anti-CD28, TCR rapidly polarized and formed a cap in one end of the cell. LIGHT also congregated, and it colocalized with TCR (second row, Figure 7). LIGHT obviously comigrated and colocalized with rafts as shown in row 3 of Figure 7. Taken together, these data indicate that TCR and LIGHT both congregate to a raft cap on the cell surface immediately after TCR and CD28 cross-linking. This provides a molecular base for LIGHT to enhance TCR signaling because now both of them are closely associated and located in aggregated rafts, which are scaffolds accommodating many signaling molecules.
LIGHT rapidly translocates into caps of TCR and rafts on the surface of activated T cells.
BALB/c spleen T cells were cross-linked with anti-CD3 and anti-CD28 for 0 or 10 minutes. The locations of TCR (stained with biotin–anti-CD3 followed by Alexa 594–streptavidin in red), rafts (stained with Alexa-cholera toxin in red) and LIGHT (stained with TR6-Fc followed by Alexa 488–anti–human IgG in green) were revealed by confocal microscopy. Original magnification, ×600.
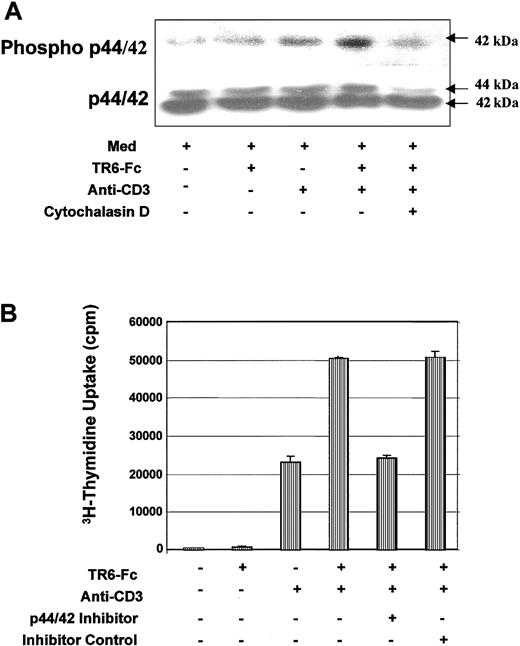
We also investigated signaling events further downstream from the cell membrane. Mouse spleen T cells were plated on wells coated with TR6-Fc alone, a suboptimal concentration of anti-CD3 alone, or both, for 90 minutes, and p44/42 MAPK activation was monitored according to their phosphorylation. As shown in Figure 8A, the level of phosphorylated p42 MAPK was augmented in cells stimulated with both anti-CD3 and TR6-Fc, compared with anti-CD3 or TR6-Fc alone, whereas p44/42 MAPK protein levels remained unchanged in all treatments. When cells were preincubated for 2 hours in cytochalasin D, which prevents actin polymerization, the level of phospho-p42 MAPK no longer increased in the presence of anti-CD3 and TR6-Fc costimulation. This suggests that MAPK activation depends on actin polymerization. MAPK activation in this case was an essential and relevant event in T-cell activation after TCR and LIGHT cross-linking because a p44/42 MAPK-specific inhibitor PD98059, but not its nonfunctional analog SB202474, strongly suppressed the T-cell proliferation triggered by CD3 and LIGHT stimulation (Figure 8B).
Costimulation through LIGHT enhances MAPK activity.
(A) MAPK activity is enhanced after LIGHT costimulation. BALB/c T cells were precultured in medium for 2 hours in the presence of 0.1% DMSO, or 0.1% DMSO plus 15 μM cytochalasin D. After washing, the cells were cultured in medium (MED), or stimulated with solid phase TR6-Fc, a suboptimal concentration of anti-CD3, or both, for 90 minutes at 37°C. The levels of phosphorylated p44/42 MAPK and total p44/42 MAPK were assessed by immunoblotting with the same membrane. The 42-kDa band representing phosphorylated MAPK and the 44-kDa and 42-kDa bands representing total p44/42 MAPK protein are indicated by arrows. (B) P44/42 MAPK activity is essential for LIGHT-enhanced T-cell proliferation. BALB/c T cells were cultured in wells coated with TR6-Fc (10 μg/mL), a suboptimal concentration of anti-CD3 (0.2 μg/mL), or both. The cells were cultured in medium, or in the presence of a p44/42 MAPK inhibitor PD98059 (15 μM) or its noninhibitory structural homologue SB202474 (15 μM). The 3H-thymidine uptake of these cells was measured between 48 and 64 hours. The samples were tested in triplicate, and means ± SD of counts per minute are shown. The experiments were performed twice with similar results, and the data of a representative experiment are presented.
These results indicate that LIGHT can indeed transduce signals into T cells, and such transduction depends on early membrane events, actin polymerization and MAPK activation.
Discussion
In this study, we have reported that costimulation through LIGHT enhances T-cell proliferation, cytokine production, and CTL development. Immediately after T activation by anti-CD3 and anti-CD28, LIGHT congregates to the raft cap where it colocalizes with TCR. This membrane event is followed by MAPK activation.
Because mouse TR6 has not been cloned, we used human TR6 to cross-link LIGHT on mouse T cells. This was a legitimate choice because human TR6 cross-reacts with mouse LIGHT.3 However, the observed stimulatory effect of solid-phase TR6 could operate via molecules other than LIGHT, because TR6 is known to bind FasL, which is also capable of reversely transducing signals into T cells,16-18 and because human TR6 binds to mouse FasL (data not shown). Moreover, TNF and TNFR family members are known to cross-react among themselves, as discussed in the “Introduction” on interactions among TR6, LIGHT, FasL, TL-1A, TR2, and LTβR. To ascertain that LIGHT could receive costimulation, we used mAb against human LIGHT, which shares 67% homology with mouse LIGHT in its amino acid sequence, for costimulation. The binding of this mAb to activated mouse T cells could be inhibited by soluble TR6, indicating that TR6 and the mAb share a common ligand. Considering the fact that the mAb is specific to human LIGHT, unless there was an extremely rare and unlikely coincidence in which the mAb and TR6 both bind to an unknown molecule X on the T-cell surface, we have to conclude that the anti–human LIGHT mAb is specific to mouse LIGHT as well. Because this mAb could costimulate T cells in the presence of TCR ligation, reverse signaling through LIGHT was thus established. Although we cannot totally exclude the possibility that the costimulating effect of TR6 on T cells might, to a certain extent, be due to its binding to molecules other than LIGHT, we believe that the major effect of TR6 occurs via LIGHT, because the binding of mouse T cells by TR6 was largely eliminated when the LIGHT gene was knocked out (data not shown).
Questions are inevitably raised regarding whether the stimulatory effect of TR6 is due to its positive stimulation to LIGHT or due to its blocking of an existing negative autocrine loop in which LIGHT acts as a receptor. The latter possibility is best argued against by the fact that in our model, solid-phase TR6 could stimulate T cells. When TR6-Fc was used to coat the plate, although a concentration of 1 to 2 μg/100 μL/well was used, only a very small fraction of it actually went onto the plate, and more than 99.9% of the protein was washed away after the coating process. Thus, no more than 2 ng TR6 was actually coated on a well. If we consider how small a fraction of this will leak into solution, it is unlikely such a minute amount of soluble TR6 could interfere with an autocrine loop. Indeed, soluble TR6-Fc up to 10 μg/mL had no effect on anti-CD3–stimulated T cells (data not shown). Can TR6 on the solid phase block an autocrine loop? We are not aware of any example in an experimental system that this can be achieved. Because a cell is a 3-dimensional entity, solid-phase TR6 can interfere only with a part of the cell surface that has contact with the well. Therefore, the solid-phase TR6 cannot prevent the interaction between a putative soluble suppressive autocrine and LIGHT on most part of the cell surface that is not in contact with TR6. Consequently, most LIGHT molecules on a cell surface should still receive negative signals from the putative suppressive autocrine, if there is one. It is therefore very difficult to explain the positive effect of solid-phase TR6. In addition, recent studies showed that LIGHT transgenic mice overexpressing LIGHT on T cells have enhanced immune response.27 28 This result does not fit to the model in which LIGHT transduces negative signals into T cells, because if so, the LIGHT transgenic mice should have suppressed immune response instead. Lastly, there are about 4 to 5 TNF family members capable of transducing signals into cells, but none of them transduces a negative one. Based on these arguments, it is concluded that TR6 exerts its effect by stimulating T cells via LIGHT, but not by interfering with a putative negative autocrine loop.
Several studies have explored the pathways of reverse signaling. In the case of CD40L, its ligation results in general protein tyrosine phosphorylation, Ca++ influx, and activation of Lck, PKC, JNK, and p38 MAPK in EL4 thymoma cells.29,30 TRAIL cross-linking also induces p38 MAPK activation.19 We examined the mechanisms of reverse signaling through LIGHT. A recent study showed that plasma membrane compartmentation plays an essential role in T-cell activation and costimulation. Detergent-insoluble, glycolipid-enriched rafts function as scaffolds and contain many signaling molecules such as Src kinases.31 After cross-linking, TCR translocates to the rafts, where it gains access to the signaling pathways.32 33 We explored the interaction among TCR, LIGHT, and rafts in this study. Anti-CD3 and anti-CD28 were used to mimic antigen-presenting cells (APCs) for T-cell activation. TCR rapidly formed caps, which colocalized with aggregated rafts, as expected. We found that LIGHT immediately congregated and colocalized with the TCR cap and aggregated rafts. This is a novel finding and is consistent with the costimulatory function of LIGHT. If LIGHT were to costimulate T cells, the best place it should go is aggregated rafts, where its own signaling machinery can interact with that of TCR, and enhance the latter. It is to be noted that in our T-cell activation model, we used TR6 along with suboptimal anti-CD3 to stimulate T cells in the absence of anti-CD28. Under such a condition, the percentage of T suboptimal anti-CD3 alone and the capping was not as drastic and clear-cut as with anti-CD3 plus anti-CD28 treatment (data not shown). It is still possible that a small degree of colocalization of LIGHT, TCR, and raft is present and is sufficient for the costimulation of LIGHT for TCR, but such a small degree is not discernable by our current technology. The anti-CD3 plus anti-CD28 model gave a much stronger stimulation and proves in principle that TCR and LIGHT can lodge together in the raft scaffold. Under the physiologic condition, TCR ligation is normally accompanied by CD28 costimulation. Therefore, LIGHT will be likely recruited to the TCR-raft complex, and our model using anti-CD3 plus anti-CD28 is physiologically relevant.
The activity of p42 MAPK, which is a downstream signaling molecule in the TCR signaling pathway, was enhanced by LIGHT signaling. How this is achieved is not presently clear. LIGHT has a short and featureless cytoplasmic tail incapable of signaling by itself1; hence, its signaling most likely depends on molecules with which it associates. In our experiment, a MAPK inhibitor was able to inhibit TR6-augmented T-cell proliferation in the presence of suboptimal anti-CD3. Because anti-CD3–induced T-cell proliferation is also dependent on MAPK, this kinase might be in the common pathway shared by TCR and LIGHT, and its activation is augmented by upstream signals from both TCR and LIGHT. The MAPK inhibitor obviously will not differentiate TCR-derived signals from those that are LIGHT derived.
What is the biologic significance of reverse signaling through LIGHT? LIGHT-expressing T cells can costimulate TR2-expressing T cells. Reverse signaling through LIGHT allows TR2-expressing T cells to stimulate LIGHT-expressing T cells as well, and such 2-way stimulation provides a theoretical base for T cell-to-T cell cooperation, which is not a well-explored topic. It is known that T cells need to reach a certain density in culture to optimally respond to TCR stimulation, and such a phenomenon is often attributed to the need for cytokines in culture. Without discounting the importance of cytokines, bidirectional costimulation via TR2 and LIGHT between T cells may well contribute to the cell density requirement during their activation. Such T cell-to-T cell cooperation can also explain why in vivo T-cell responses tend to occur in regions densely populated with T cells in lymphoid organs. Recently, it has been shown that LIGHT overexpression in the T-cell compartment in LIGHT transgenic mice results in profound inflammation and the development of autoimmune syndromes27,28; T cells overexpressing LIGHT have an activated phenotype.27Probably, such an up-regulated immune response of T cells is due to stimulation of TR2/HVEM on dendritic cells by T cell–derived LIGHT, and the dendritic cells in turn augment T-cell activity; TR2 on T cells can also receive LIGHT stimulation directly from their fellow LIGHT-expressing T cells.28 On the other hand, it is entirely possible that overexpressed LIGHT on T cells receives stimulation reversely, which augments their responsiveness to TCR ligation. In this study, we used recombinant TR6-Fc and anti-LIGHT mAb as artificial binding partners of LIGHT. In vivo, the molecules that can trigger LIGHT signaling are probably cell surface TR2 or LTβR. To support this hypothesis, we found that when TR2 was put on solid phase, it could enhance T-cell response triggered by suboptimal anti-CD3, as with TR6 (data not shown). On the other hand, endogenous TR6 might act as an inhibitor of the bidirectional costimulation between TR2 and LIGHT, or function as a costimulating factor for LIGHT, depending on whether it exists as monomers or trimers like other cell surface TNFR family members. This aspect is worth further investigation. Because dendritic cells also express LIGHT, TR2 on the T-cell surface might activate dendritic cells through LIGHT to modulate their APC function. If so, this will represent a new mechanism for T-cell and dendritic cell interaction and cooperation.
We recently reported that soluble human TR6-Fc inhibited CTLs in vitro and allograft rejection in vivo in mice.3 In that paper, we proposed that soluble TR6 blocked the costimulation from LIGHT to TR2, or reversely from TR2 to LIGHT,3 or both, although, at the time, solid evidence of reverse signaling through LIGHT was not available. Our current findings have fulfilled one of our initial predictions that the inhibitory effect of human TR6 in the mouse system should be attributed to the interference of TR6 with the bidirectional costimulation between TR2 and LIGHT. When TR6 was used as a solid-phase molecule instead of in solution, its function changed from suppression to promotion of the T-cell response, because it no longer served as blocker but rather as a cross-linker of LIGHT. Increasing cases of bidirectional signal transduction between receptors and ligands have been found in biologic systems. We can take advantage of such a phenomenon by exploiting soluble monomer ligands (or receptors) without the cell-anchoring ability to block signaling in both directions and thus modulate biologic responses.
The authors acknowledge the editorial assistance provided by Mr Ovid Da Silva, Reviseur-Redacteur, Research Support Office, Research Centre, CHUM. We thank Paul A. Moore for reviewing the manuscript.
Prepublished online as Blood First Edition Paper, June 21, 2002; DOI 10.1182/blood-2002-05-1404.
Supported by grants from the Canadian Institutes of Health Research (MT-15673, MOP57697, and PPP57321), the Canadian Institute of Health Research/Canadian Blood Service, the Heart and Stroke Foundation of Quebec, the Kidney Foundation of Canada, the Roche Organ Transplantation Research Foundation, Switzerland (ROTRF 474950960), the Juvenile Diabetes Research Foundation International, the United States of America, and the J.-Louis Levesque Foundation (J.W.). J.W. is a National Researcher of the Quebec Health Research Foundation.
T.W.S. and J.Z. are employed by Human Genome Sciences Inc whose products (TR6 and LIGHT) were studied in the present work.
The publication costs of this article were defrayed in part by page charge payment. Therefore, and solely to indicate this fact, this article is hereby marked “advertisement” in accordance with 18 U.S.C. section 1734.
References
Author notes
Jiangping Wu, Laboratory of Transplantation Immunology, Research Center, CHUM-Notre Dame Hospital, Pavilion DeSeve, Room Y-5612, 1560 Sherbrooke St E, Montreal, QC H2L 4M1, Canada; e-mail: jianping.wu@umontreal.ca.

This feature is available to Subscribers Only
Sign In or Create an Account Close Modal