CD150 (signaling lymphocyte activation molecule [SLAM]) is a self-ligand cell surface glycoprotein expressed on T cells, B cells, macrophages, and dendritic cells. To further explore the role of CD150 signaling in costimulation and TH1 priming we have generated a panel of rat antimouse CD150 monoclonal antibodies. CD150 cell surface expression is up-regulated with rapid kinetics in activated T cells and lipopolysaccharide/interferon γ (IFN-γ)–activated macrophages. Anti-CD150 triggering induces strong costimulation of T cells triggered through CD3. DNA synthesis of murine T cells induced by anti-CD150 is not dependent on SLAM-associated protein (SAP, SH2D1A), because anti-CD150 induces similar levels of DNA synthesis in SAP−/− T cells. Antibodies to CD150 also enhance IFN-γ production both in wild-type and SAP−/− T cells during primary stimulation. The level of IFN-γ production is higher in SAP−/− T cells than in wild-type T cells. Anti-CD150 antibodies also synergize with interleukin 12 (IL-12) treatment in up-regulation of IL-12 receptor β2 mRNA during TH1 priming, and inhibit primary TH2 polarization in an IFN-γ–dependent fashion. Cross-linking CD150 on CD4 T cells induces rapid serine phosphorylation of Akt/PKB. We speculate that this is an important pathway contributing to CD150-mediated T-cell proliferation.
Introduction
CD150 (signaling lymphocyte activation molecule [SLAM]) is the prototypical member of a growing family of glycoprotein receptors on hematopoietic cells, which includes CD229, CD84, CD244, SF2000/Ly108, SF2001, and 19A(CRACC).1-8 This “SLAM family” is defined by close sequence homology of the receptors that have one or more cytoplasmic tyrosine motifs with the consensus sequence Thr-(Ile/Val)-pTyr-x-x-Val.9-11 The other members of the family, which do not have cytoplasmic tails (CD48, BCM1-like), are likely to act as ligands, as demonstrated for CD48 that is attached to the membrane by a lipid anchor. The cytoplasmic tyrosine motifs function as docking sites for the small cytoplasmic signaling molecules SLAM-associated protein (SAP, SH2D1A) and EWS/FLI1 activated transcript 2 (EAT).12-15
In humans, CD150 is expressed on memory/activated T cells and strongly expressed on TH1 helper T cells, B cells, thymocytes, and dendritic cells.16-24 CD150 is a self-ligand25,26 thought to play an important role in adhesion and signaling in the immune synapse between the T cell and antigen-presenting cell (APC). Two major immune functions have been ascribed to CD150 in in vitro human studies, costimulation of T-cell proliferation and augmentation of the interferon γ (IFN-γ) response.18 Many T-cell surface receptors have been shown to function to various degrees as costimulation molecules in that they induce enhanced proliferation during T-cell receptor (TCR) engagement. Examples of these costimulation receptor/ligand pairs include CD28/B7.1/B7.2, ICOS/B7RP1, LFA1/ICAM, 4-1BB/4-1BBL, OX40/OX40L, and CD27/CD70.27-32 Unlike the archetypal costimulatory pair CD28/B7, many of these receptor pairs are induced on activation; thus, costimulatory function follows shortly after the initial TCR triggering event.
Although CD150 is in this inducible category of receptors, it is different in 2 respects. First, CD150 signals through interaction with SAP in T cells and EAT in APCs. These small (128 amino acids) molecules, which comprise an SH2 domain with a short tail, are structurally similar but differ subtly in their binding characteristics to the SLAM family receptors.14 Second, CD150 is strongly expressed on the surface of established TH1 cells and monoclonal antibodies directed at CD150 augment IFN-γ production following TCR triggering in human T cells. Thus, CD150 has 2 major roles in T-cell activation—costimulation and control of IFN-γ production.
SAP is likely a pivotal signaling molecule for the 6 members of the SLAM family of receptors. This is becoming clear through studies on patients with mutations of the SAP gene sh2d1a, which result in the fatal X-linked lymphoproliferative disease (XLP), familial hemophagocytic lymphohistiocytosis (FHL), and combined variable immunodeficiency (CVID),33-37 and through studies performed with the SAP−/− mouse.34,35Patients with XLP have sh2d1a mutations that result in various immunologic abnormalities (for reviews, see Morra et al36 and Howie et al37). Three categories of clinical disease in XLP patients are recognized: fulminant infectious mononucleosis, B-cell lymphomas, and dysgammaglobulinemia. These disease phenotypes point to distinct roles for the 6 SLAM family/SAP signaling pathways in control of T- and B-cell activation and homeostasis.
Studies in the SAP−/− mouse reveal loss of transcriptional control in the induction of the interleukin-4 (IL-4) gene resulting in increased resistance to TH2-mediated disease such as infection with Leishmania major along with impaired ability to differentiate into TH2 cells in vitro.38 41 In addition, SAP−/−mice fail to resolve infection with the lymphocytic choriomeningitis virus (LCMV) showing increased numbers of IFN-γ–producing cells in the spleen and liver. SAP binds to 6 SLAM family members on T cells; therefore, it will be of great interest to elucidate the contribution of each member to these immune functions.
Because antibodies to CD150 induce IFN-γ production and costimulation of DNA synthesis in human T cells, this was studied in wild-type and SAP−/− T cells. We have investigated the role of CD150 signaling through SAP in both T-cell proliferation and IFN-γ induction.
Materials and methods
Generation of anti-murine CD150 monoclonal antibodies
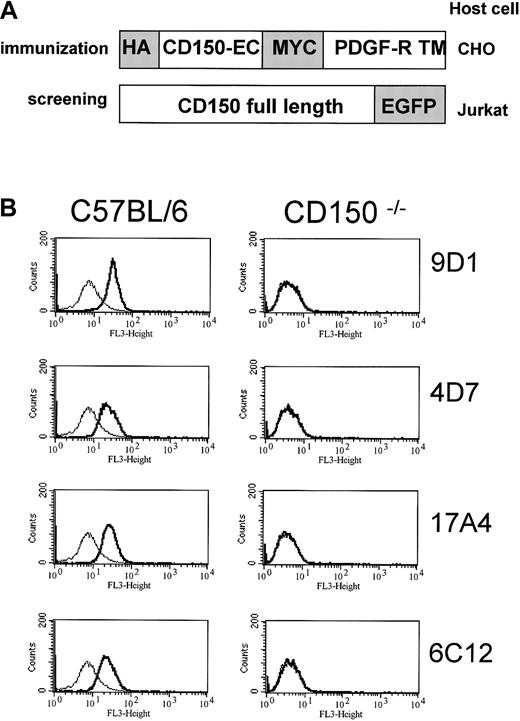
To generate monoclonal antibodies against murine CD150 (mCD150), rats were immunized with Chinese hamster ovary (CHO) cells stably transfected with a DNA construct encoding the extracellular region of mCD150 in the BglII and SalI sites of the pDISPLAY vector (Invitrogen, Life Technologies, Carlsbad, CA; Figure1A). The mCD150 extracellular domain was generated by polymerase chain reaction (PCR) using the primers sense 5′-CCCAG ATCTA TGGATTGCCCAGTGATTCTCCAGAAG-3′ and antisense 5′-TACGTCGAC GGAGGATTCCTGCTTGCATGCTTG-3′. This construct encodes the mCD150 extracellular region flanked on the N-terminal by a hemagglutinin tag and on the C-terminal with a myc tag to facilitate identification of CD150-expressing cells. The construct also encodes the immunoglobulin heavy chain-leader sequence and transmembrane region of the platelet-derived growth factor receptor (PDGFR) to anchor the extracellular portion of CD150 at the plasma membrane.
Generation and analysis of rat anti-mouse CD150 monoclonal antibodies.
(A) mCD150/HA/MYC construct expressed in CHO cells used to immunize rats to generate anti-mCD150 monoclonal antibodies. The extracellular region of mCD150 was generated with PCR and cloned into theBglII and SalI sites of the pDISPLAY vector yielding a HA/MYC-tagged, membrane-anchored extracellular mCD150 (see “Materials and methods”). The mCD150-EGFP construct was generated by generating full-length cDNA of mCD150 with CD150 primers encoding anEcoR1 site (5′) and BamH1 site (3′) and cloning the PCR product into the corresponding restriction sites of pEGFP-N3 as described in “Materials and methods.” (B) Anti-CD150 staining of wild-type mouse C57Bl/6 thymocytes, but not CD150−/−thymocytes with 4 rat antimouse CD150 monoclonal antibodies. Thin-lined histograms represent control staining with pooled rat immunoglobulin alone. Bold-lined histograms represent CD150 staining.
For screening purposes, a stable Jurkat T-cell line expressing enhanced green fluorescent protein (EGFP)–tagged mCD150 was generated (Figure1A). The mCD150-EGFP was constructed by PCR-amplifying mCD150 with the primers sense 5′-CCCGAATTCTGCGATTGCTGGCTAATGGAT-3′ and antisense 5′-CGCGGATCCGCTCTCTGGCAGTGTCACACT-3′ and cloning into theEcoRI and BamH1 sites of pEGFP-N3 (Clontech, Palo Alto CA).
After immunization and 3 boosts the rats were killed and their splenocytes fused with myeloma cells according to standard procedures. Culture supernatants of the resultant hybridoma cells were screened for immunoreactivity to mCD150 by FACS using mCD150-EGFP–expressing Jurkat cells as targets. These cells do not express endogenous CD150 and express mCD150 at the cell surface (data not shown). Positive hybridoma cells were subcloned by limiting dilution 3 times to produce monoclonal antibodies. Four clones (4D7, 9D1, 17A4, and 6C12; Figure 1B) were selected based on immunoreactivity to mCD150-EGFP–expressing Jurkat transfectants and wild-type thymocytes, and nonreactivity to CD150−/− thymocytes.
Cells and reagents
The SAP−/− mice were generated as previously described38 and housed according to institutional guidelines in the Beth Israel Deaconess Medical Center animal research facility. Generation and analysis of the CD150−/− mouse is described elsewhere (N. Wang, A. Satoskar, R. Sweeney, et al, manuscript submitted, 2002). CHO cells and Jurkat cells stably transfected with mCD150 were grown in Dulbecco modified Eagle medium supplemented with 10% fetal calf serum (FCS), penicillin, and streptomycin. Mouse CD3+ and CD4+ splenic T cells were isolated using negative selection columns (R & D Systems, Minneapolis, MN) and grown in RPMI with 10% FCS, penicillin, and streptomycin. In vitro stimulation of T cells was performed either with concanavalin A (Con-A) at 5 μg/mL and interleukin 2 (IL-2) at 100 U/mL or with anti-CD3–coated plates at the indicated concentration. Lipopolysaccharide (LPS; Escherichia coli) was purchased from Sigma (St Louis, MO). Primary stimulation of CD4 T cells under TH1 or TH2 conditions was achieved by addition of IL-12 (10 ng/mL; Pharmingen, San Diego, CA) and anti–IL-4 (10 μg/mL; Pharmingen) or IL-4 (10 ng/mL, Pharmingen) and anti–IFN-γ or anti–IL-12 in some experiments where noted (10 μg/mL; Pharmingen), respectively, along with 1 μg/mL anti-CD3 (145.2C11) and IL-2 at 50 U/mL.
Anti-CD3 (2C11) was purified from culture supernatants of hybridoma cells purchased from American Type Culture Collection (Rockville, MD). Anti-CD28 and fluorescein isothiocyanate (FITC)–conjugated anti-CD3, anti-CD4, and anti-CD69 were purchased from Pharmingen. Biotin-conjugated anti-F4/80 was purchased from Research Diagnostics (Flanders, NJ). Anti–phospho-ERK and anti-ERK1/2 was purchased from Santa Cruz Biotechnology (Santa Cruz, CA). Anti–phospho-Akt and anti-Akt was purchased from Cell Signaling Technology (Beverly, MA).
Real-time reverse transcription–PCR
Real-time reverse transcription–PCR (RT-PCR) quantitative analysis of mCD150 transcripts in different mouse cell types was performed using the TaqMan method.
Total RNA was prepared from purified cells by a single-step extraction method using RNA STAT-60 according to the manufacturer's instructions (Tel-Test, Friendswood, TX). Each RNA preparation was treated with DNase I (Ambion, Austin, TX) at 37°C for 1 hour. DNase I treatment was determined to be complete if the sample required at least 38 PCR amplification cycles to reach a threshold level of fluorescence using β2-microglobulin as an internal amplicon reference. After phenol extraction, cDNA was prepared from the sample using the SuperScript Choice System following the manufacturer's instructions (Invitrogen Life Technologies).
Expression of mCD150 was measured by TaqMan quantitative PCR (Applied Biosystems, Foster City, CA). PCR probes designed by PrimerExpress software (Applied Biosystems) were as follows: mCD150 forward primer 5′-ACAGGCGTGCTTATGAAGTAGATG-3′; mCD150 probe 5′-TCCTGGG CATGCAACCTGCTCTG-3′; and CD150 reverse primer 5′-CCACGGGATCTCTG CTTCATAT-3′. The mCD150 probe was labeled using 6-carboxyfluorescein, and the β2-microglobulin probe was labeled with VIC (Applied Biosystems). Each reaction contained 200 nM of forward and reverse primers plus 100 nM probe for β2-microglobulin and 600 nM forward and reverse primers plus 200 nM probe for mCD150. Reactions were conducted inTaqMan Universal PCR Master Mix (Applied Biosystems) using an ABI PRISM 7700 Sequence Detection System (Applied Biosystems). Conditions were as follows: hold for 2 minutes at 50°C and 10 minutes at 95°C, followed by 2-step PCR for 40 cycles of 95°C for 15 seconds followed by 60°C for 1 minute.
The ΔCt value (expression of mCD150 relative to β2-microglobulin) was calculated using the following formula: ΔCt = Ct CD150−Ct β2-microglobulin. The ΔΔCt value (expression of CD150 compared with a control tissue) for each tissue sample was calculated according to the following formula: ΔΔCt = ΔCtsample − ΔCtcalibrator. Relative expression was then calculated using the arithmetic formula given by 2−ΔΔCt.
Flow cytometry
Flow cytometry was performed as described previously.39 Briefly, mouse thymocytes or activated T cells were suspended at 5 × 10⁶ cells/mL in phosphate-buffered saline. Anti-mCD150 was used at 10 μg/mL and detected with biotin-conjugated goat polyclonal anti–rat Ig 10 μg/mL (Pharmingen), followed by streptavidin-conjugated Red 670 1 μg/mL (Invitrogen Life Technologies). Phycoerythrin (PE)– and FITC-conjugated anti-CD3, CD4, and CD69 were purchased from Pharmingen.
Proliferation assays
T-cell proliferation was measured by 3H-thymidine incorporation assays. T cells were cultured at 1 × 10⁶cells/mL for the indicated times; 16 hours prior to harvesting3H-labeled thymidine (New England Nuclear, North Billerica, MA) was added at 1 μCi/well (37 KBq) of a 96-well plate. Following a 16-hour incubation, cells were harvested on glass filter paper, and radioactivity was measured in a Wallac 1450 Microbeta liquid scintillation counter (Wallac, Gaithersburg, MD). Each assay was performed in triplicate.
ELISA cytokine measurements
Concentrations of cytokines in cell culture supernatants were measured by capture enzyme-linked immunosorbent assay (ELISA). Murine IL-4 and IFN-γ levels were measured using OptEIA ELISA sets (BD Pharmingen) according to the protocol provided by the manufacturer. The measured optical density units were converted at an absorbance of 450 nm using a microplate reader (Bio-Rad, Hercules, CA).
SDS-PAGE and Western blotting
Cell lysis was carried out with 1% Triton X-100 as described before.12 Cell lysates were clarified by centrifugation at 14 000g for 15 minutes at 4°C. Whole cell lysates were subjected to sodium dodecyl sulfate–polyacrylamide gel electrophoresis (SDS-PAGE) and transferred onto polyvinylidene difluoride (PVDF) filters (Millipore, Bedford, MA). Filters were blocked for 1 hour with 5% skim milk and then probed with the indicated antibodies. Bound antibody was revealed using horseradish peroxide–conjugated secondary antibodies using enhanced chemiluminescence (Supersignal, Pierce, Rockford, IL).
Results
CD150 expression in mouse lymphoid cells and kinetics of expression on activated T cells and macrophages
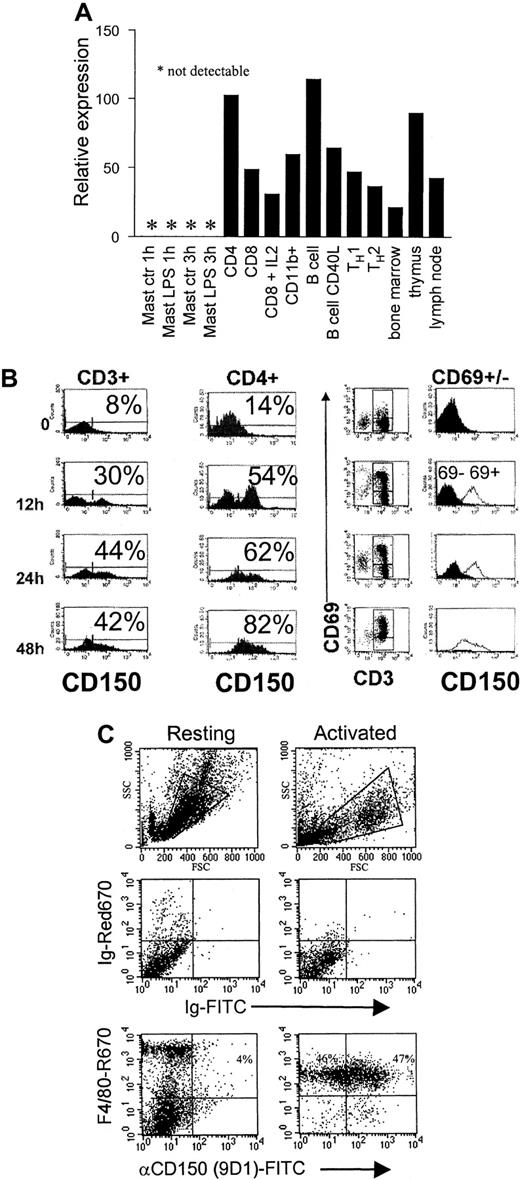
CD150 is expressed on activated/memory T cells, B cells, and activated dendritic cells in humans.16,18,23 40 Less is known about the distribution of CD150 expression in the mouse. As shown in Figure 2A, CD150 mRNA transcripts are abundantly expressed on CD4 and CD8 T cells, B cells, and CD11b+ macrophages. Because TH1 and TH2 primary polarized CD4 T cells express CD150 to similar degrees, CD150 does not appear to be an early TH1 marker. Analysis of total RNA from bone marrow, lymph node, and thymus show expression of CD150 in all 3 organs, as expected.
Distribution of CD150 mRNA and plasma membrane expression on T-cell and macrophage activation.
(A) Real-time RT-PCR analysis of CD150 expression on mouse lymphocyte subsets and lymphoid organs. RNA was extracted from the indicated cell types isolated and quantitative RT-PCR performed with the primers and probes described in “Materials and methods.” (B) CD150 is rapidly up-regulated on splenic T cells following activation. Purified CD3+ splenic T cells were stimulated with 5 μg/mL Con-A with the addition of 50 U/mL IL-2 for the indicated periods. CD150 is present on the surface of activated T cells as early as 12 hours following stimulation; data are representative of 3 separate experiments. Double staining with anti-CD69 and anti-CD150 during the activation time course (right panels) shows that CD150 is predominantly on CD69+ T cells after activation (clear histograms indicate CD69+ cells, black histograms indicate the CD69− population). (C) CD150 is up-regulated on F4/80+ murine peritoneal macrophages following activation with 100 ng/mL LPS and 50 U/mL IFN-γ. FACS analysis with FITC-conjugated 9D1 (anti-mCD150) and F4/80.
We next assessed the kinetics of CD150 expression following activation of various cell types. Purified splenic CD3+ T cells were activated with Con-A plus IL-2 for the indicated times (Figure 2B). Following stimulation expression of CD150 was measured by flow cytometry. CD150 up-regulation during activation is rapid with an increase of 22% surface expression on CD3+ cells after 12 hours of activation and 36% increase following 48 hours of stimulation. By gating on CD69+ cells we confirmed that CD150 expression is limited to activated cells. Treatment of CD8 T cells with IL-2 leads to a moderate down-regulation of CD150 mRNA. Activation of B cells with CD40L also results in down-regulation of CD150 mRNA transcripts (Figure 2A). Mast cells remain negative for CD150 expression following LPS stimulation.
It has been reported that CD150 is up-regulated on IL-1–treated human monocytes and CD40-L cross-linked dendritic cells.22-24 We investigated whether CD150 is up-regulated on the cell surface following macrophage activation. To this end mouse (Balb/c) macrophages were isolated by peritoneal lavage followed by adherence to plastic. Adherent cells were then activated with bacterial LPS (from E coli) and IFN-γ for 24 hours. Following activation we observed a large increase in the number of F4/80+ cells, which expressed cell surface CD150 (43% increase in CD150+F4/80+ cells). Thus, following cellular activation the costimulation molecule CD150 is rapidly expressed at the cell surface with similar kinetics on both T cells and macrophages.
CD150 and CD28 have an additive effect on T-cell proliferation
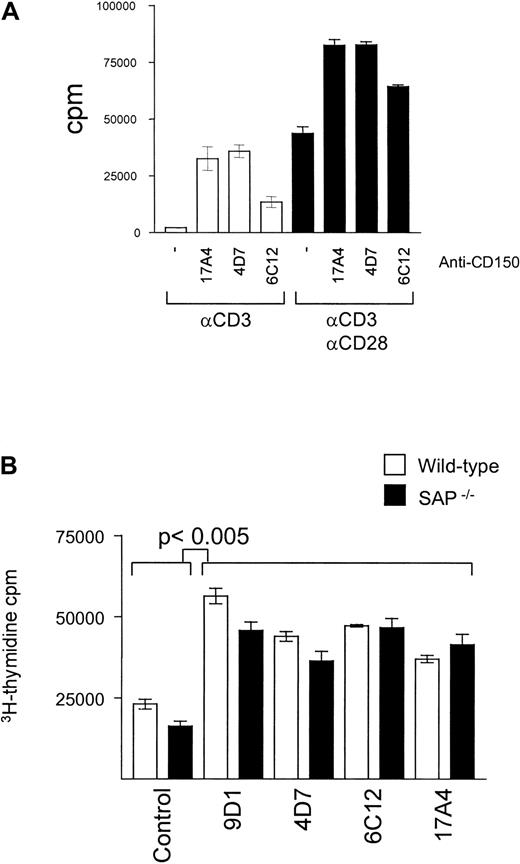
The role of CD28 in providing the necessary second signal for T-cell costimulation is well described; however, the relative capacity of CD150 for induction of optimal T-cell proliferation is unclear. We performed proliferation assays with anti-CD3–stimulated splenic T cells to measure the relative effect of addition of antibodies directed at CD28 and CD150. As shown in Figure 3A anti-CD150 or anti-CD28 antibodies induce an increase of T-cell DNA synthesis to a similar degree. However, simultaneous addition of both anti-CD28 and CD150 antibodies induces an increase of DNA synthesis approximately equal to the sum of the effects of each antibody alone. Thus, CD150 costimulates DNA synthesis of T cells in concert with CD28, amplifying the proliferation signal.
CD150 and CD28 provide an additive effect in T-cell costimulation of DNA synthesis.
CD150-mediated T-cell costimulation is independent of SAP. (A) Splenic T cells from Balb/c mice were stimulated with plate-bound anti-CD3 (145.2C11, 1 μg/mL) for 72 hours in the presence and absence of anti-mCD150 monoclonal antibodies (10 μg/mL) and anti-CD28 (1 μg/mL, black bars). Proliferation was measured by3H-thymidine uptake during the last 16 hours of culture. Data are representative of at least 3 separate experiments. (B) Splenic T cells from Balb/c (white bars) or SAP−/− mice (black bars) were stimulated with plate-bound anti-CD3 (145.2C11 1 μg/mL) for 72 hours in the presence and absence of 4 different anti-mCD150 monoclonal antibodies (9D1, 4D7, 6C12, 17A4, 10 μg/mL). Proliferation was measured by 3H-thymidine uptake during the last 16 hours of culture. Data are representative of at least 3 separate experiments.
DNA synthesis of T cells induced by anti-CD150 is SAP independent
Although CD150 and SAP associate in T cells, the role of the CD150/SAP signaling pathway in T-cell costimulation is unknown. To address this question we compared activation of T cells from wild-type and SAP knockout mice.38 As shown in Figure 3B, all anti-CD150 antibodies tested for costimulation in SAP−/−T cells induced similar degrees of DNA synthesis in wild-type T cells as measured by 3H-thymidine uptake. This suggests that in vitro, anti-CD150–mediated T-cell proliferation is independent of the CD150/SAP interaction.
Anti-CD150 antibodies augment IFN-γ production by both wild-type and SAP−/− T cells
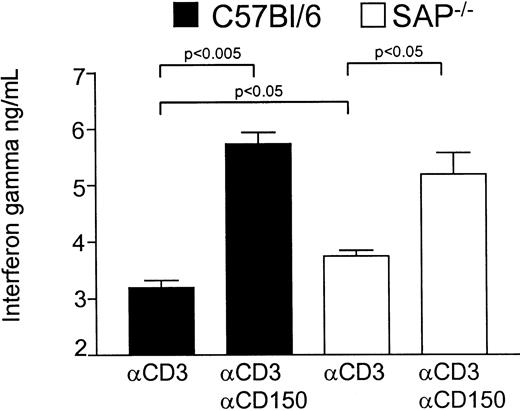
We next investigated the role of CD150 and SAP in control of IFN-γ production by activated T cells. T cells from wild-type C57BL/6 or C57BL6 SAP−/− mice were activated via monoclonal antibodies to CD3 and CD150 (clone 9D1 10 μg/mL). As we have described previously,38 T cells from SAP−/−mice produce more IFN-γ than wild-type littermates following activation via anti-CD3, pointing to a possible negative role for SAP in IFN-γ production. ELISA data using C57BL/6 mice (Figure4) show the higher production in SAP−/− versus wild-type in response to anti-CD3 (mean 3744 pg/mL for SAP−/− versus mean 3199 pg/mL for wild-type). However, on stimulation with anti-CD3 and antibodies against CD150 both wild-type and SAP−/− T cells produce significantly higher amounts of IFN-γ. However, the increase in IFN-γ production in SAP−/− T cells following anti-CD150 is less than that observed in wild-type T cells (Δ2534 pg/mL for wild-type versus Δ1443 pg/mL for SAP−/−). Thus, any negative effect of SAP on IFN-γ production by T cells is abolished by antibodies directed at CD150; the possible interpretations of this result are discussed below.
CD150 triggering augments IFN-γ production by naive T cells independently of SAP expression.
Wild-type C57Bl/6 or SAP−/− splenic T cells purified by negative selection were stimulated with plate-bound anti-CD3 (145.2C11, 1 μg/mL) and IL-2 at 50 U/mL for 72 hours in the presence or absence of soluble anti-mCD150 (9D1, 10 μg/mL). Following stimulation, IFN-γ concentrations in the cell culture supernatants were measured by ELISA.
Antibodies to CD150 can inhibit TH2 priming in an IFN-γ–dependent fashion
Although TH1 T cells express CD150 and antibodies to CD150 induce enhanced IFN-γ production, the capability of CD150 to affect TH1/TH2 priming per se has yet to be addressed. Castro et al17 have demonstrated that CD150 is on recently polarized TH1 and TH2 T cells, but is lost from long-term TH2 clones. Stimulation of established TH1 but not TH2 T cells with anti-CD150 induces increased IFN-γ production. To examine the role of CD150 in TH1 versus TH2 priming we performed in vitro TH1 and TH2 priming experiments with CD4 T cells with and without the addition of anti-CD150 antibody 9D1 in the primary stimulation followed by restimulation by anti-CD3 in the absence of anti-CD150 antibodies. We hypothesized that antibodies directed at CD150 could inhibit T-cell polarization to TH2 by inducing IFN-γ production during the initial priming.
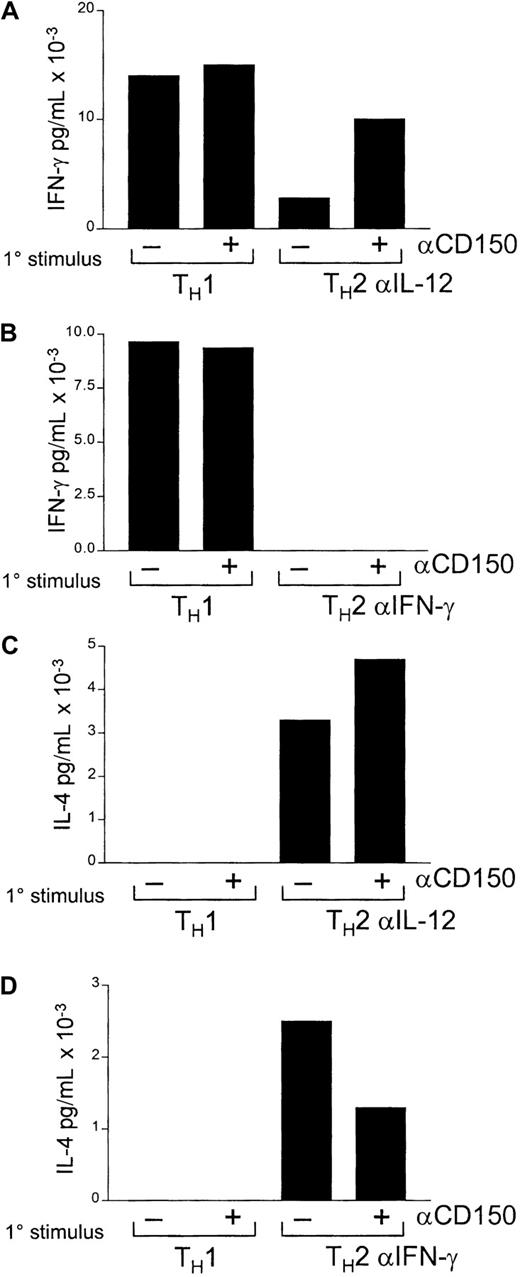
Initially CD4 T cells were primed with IL-12 and anti–IL-4 (TH1) or IL-4 and anti–IL-12 (TH2) in the presence or absence of anti-CD150 antibodies (Figure5A,C). CD4 T cells, which were stimulated under TH2 conditions with anti-CD150 antibodies, produced a significant amount of IFN-γ on secondary stimulation with anti-CD3 alone (Figure 5A). Conversely, T cells stimulated initially under TH1 conditions, either with or without anti-CD150 antibodies, produced no IL-4 on secondary stimulation (Figure 5C-D).
Antibodies to CD150 can inhibit TH2 polarization in an IFN-γ–dependent fashion.
CD4 T cells were stimulated with anti-CD3 under TH1 or TH2 conditions with or without the addition of anti-CD150 antibodies for 72 hours. Following a rest period of 48 hours in IL-2 (50 U/mL) cells were restimulated with anti-CD3 (1 μg/mL plate bound) and IL-2 (50 U/mL). In panels A and C, TH2 priming was performed with IL-4 and anti–IL-12; in panels B and D, TH2 priming was performed with IL-4 and anti–IFN-γ. Primary stimulation conditions are indicated (1°) on the x-axis. Concentrations of IFN-γ and IL-4 in culture supernatants were assayed by ELISA as outlined in “Materials and methods.” Bars represent the means of triplicate measurements.
There are 2 possible explanations for the inhibition of complete TH2 polarization we observed. First, CD150 antibodies trigger IFN-γ, which drives cells toward the TH1 phenotype. Alternatively, CD150 triggering may prime cells to become TH1 on secondary stimulation independently of other external stimuli. To address this possibility we performed a second priming experiment with the addition of anti–IFN-γ antibodies in the TH2 priming conditions.
As shown in Figure 5, panels B and D, addition of anti–IFN-γ to the primary TH2 stimulation inhibited the effect of primary anti-CD150 antibody treatment on subsequent IFN-γ production in the secondary stimulation, but did not ablate IL-4 production (Figure 5D).
Thus, TH2 polarization is affected by anti-CD150 antibodies, whereas TH1 polarization is not. Inhibition of TH2 polarization by anti-CD150 antibodies is due to IFN-γ production by anti-CD150 during the initial priming event because addition of antibodies to IFN-γ instead of anti–IL-12 inhibits the effect of anti-CD150 antibodies.
Increased IL-12 Rβ2 transcripts in CD4 T cells during TH1 polarization by anti-CD150 antibodies
A central cytokine in the process of TH1 polarization is IL-12,42 produced mainly by activated macrophages and dendritic cells. The receptor for IL-12 on T cells is composed of 2 subunits, the constitutively expressed β1 chain and the β2 chain, which is up-regulated in response to IFN-γ, and expressed predominantly on TH1 cells.
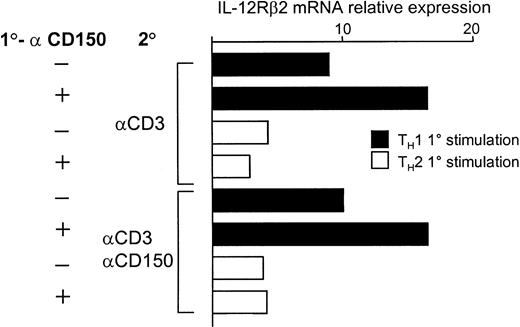
We reasoned that one mechanism of IFN-γ induction by T cells in response to anti-CD150 antibodies might be by increasing the level of IL-12 receptor β2 (IL-12Rβ2) transcription, thus raising the sensitivity of the cell to IL-12. As shown in Figure6, T cells stimulated under TH1 conditions produce more IL-12Rβ2transcripts than those primed under TH2 conditions. Addition of anti-CD150 antibody 9D1 synergizes with the TH1 conditions leading to an approximately 2-fold induction of IL-12Rβ2 transcripts in these cells during TH1 priming.
Anti-CD150 antibodies enhance up-regulation of IL-12Rβ2 mRNA transcripts in CD4 T cells during TH1 polarization.
Real-time RT-PCR for IL-12Rβ2 mRNA transcripts was performed from total RNA from the CD4 T cells in the experiment of Figure 5 as described in “Materials and methods.” CD4 T cells were stimulated under TH1 conditions or TH2 (IL-4 + αIL-12) with or without anti-CD150 (9D1) followed by 48 hours' rest in IL-2 and secondary stimulation with anti-CD3 alone or anti-CD3 plus anti-CD150 as indicated. Relative expression of IL-12Rβ2 was normalized to the level of β2-microglobulin in each sample. 1° and 2° represent primary and secondary stimulation conditions, respectively.
CD150 cross-linking on activated T cells induces Akt phosphorylation on Ser473
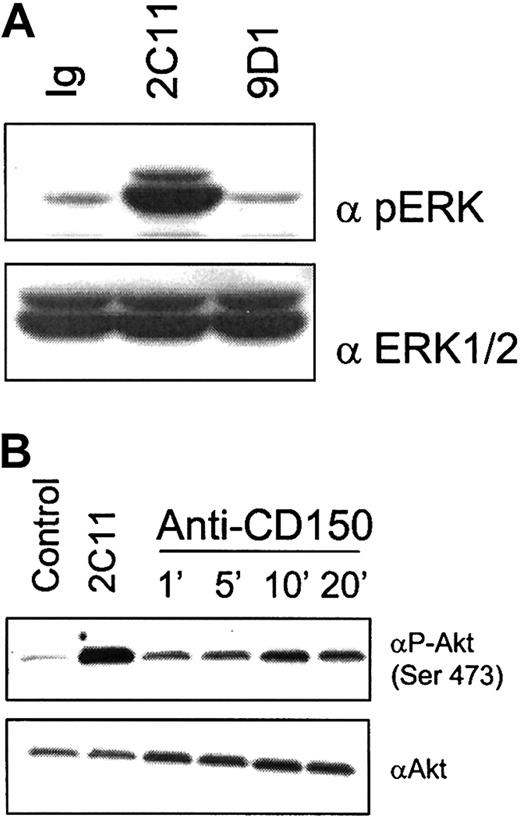
We next investigated downstream signaling pathways that may be engaged during CD150-mediated costimulation of T cells. Signaling cascades activated through the TCR and CD28 include the p38/JNK/ERK mitogen-activated protein kinase (MAPK) pathways and phosphatidylinositol 3-kinase (PI3K)/Akt pathways, respectfully (for a review, see Kane and Weiss43). Akt is of particular interest in costimulation because it has been shown that retrovirally mediated expression of an activated Akt construct in CD28-deficient T cells restores IL-2 and IFN-γ production by these cells.44 In addition, CD28 ligation by B7.1 or antibodies triggers downstream activation of Akt.45 Stimulation of previously activated CD150+ CD4 T cells with antibodies to CD150 alone induced no detectable change in the phosphorylation of MAPK (ERK1/2; Figure 7A). Under the same conditions CD150 cross-linking alone results in an increase in serine phosphorylation of Akt/PKB on Ser473. Phosphorylation of Ser473 of Akt is necessary to activate its kinase activity. CD150-mediated activation of Akt was maximal at 10 minutes of cross-linking (Figure 7B).
Cross-linking of CD150 on CD4 T cells results in activation of the serine/threonine kinase Akt/PKB.
(A) Triggering of CD150 on activated CD4 T cells does not induce detectable phosphorylation of MAPK ERK1/2. Negatively selected CD4 T cells from C57Bl/6 mice were preactivated with anti-CD3 plate-bound plus IL-2 for 48 hours then rested in IL-2 (50 U/mL) for 24 hours to induce CD150 surface expression before CD150 cross-linking. Anti-CD3 (145.2C11, 10 μg/mL) as a positive control, IgG as a negative control, or 9D1 (10 μg/mL) antibodies were cross-linked with isotype-specific secondary antibodies for 10 minutes. Cell lysates were subjected to SDS-PAGE and Western blotted for phospho-ERK (top panel) or total ERK1/ERK2 (bottom panel). (B) CD150 cross-linking on activated CD4 T cells induces rapid phosphorylation of the serine/threonine kinase Akt on Ser473. Cells were preactivated as described in panel A before treatment with IgG for 10 minutes (negative control), 2C11 for 10 minutes (positive control), or 9D1 (all antibodies used at 10 μg/mL) for the indicated time points. Top panel is Western blot with anti–phospho-serine-473 Akt. Bottom panel is Western blot total Akt.
Discussion
It is becoming clear that the long-established dogma of ‘2-signal’ T-cell activation27 is likely an oversimplification of what is, in fact, a complex set of T cell/APC receptor/ligand interactions. Some of these receptor/ligand pairs are important in amplifying T-cell activation and cytokine production (ie, CD28/B7, ICOS/B7RP1, CD40/CD154) and some serve to attenuate immune responses (ie, CTLA4/B7 and PD1/PD1-L46). Our results show that CD150 is widely expressed at the transcriptional level in T, B, and myeloid cells and is rapidly up-regulated to the plasma membrane on activation of T cells and macrophages. Anti-CD150 treatment of primed T cells results in increased proliferation and IFN-γ production; both processes occur in the absence of SAP signaling. CD150 antibodies also inhibit TH2 skewing in an IFN-γ–dependent fashion. CD150 cross-linking also induces activation of the antiapoptotic serine/threonine kinase Akt/PKB in CD4 T cells.
CD150 belongs to a family of hematopoietic cell surface glycoproteins that are unique in their binding to the signaling molecules SAP, in T cells, and EAT-2 expressed in macrophages, dendritic cells, and B cells.14 CD150 has been studied most extensively in humans where it has been shown to have diverse immunologic functions. These include T/B-cell costimulation,16,18,40 augmentation of IFN-γ production by T cells, redirection of TH2 clones to a TH1 or TH0 phenotype,47,48 and alteration of the susceptibility of B cells to Fas-induced apoptosis.19 Activated monocytes and dendritic cells also express CD15022-24 where it has been reported to mediate proinflammatory cytokine release by these cells. Surprisingly, CD150 was also recently shown to be the predominantly used receptor for measles virus entry into B cells in addition to CD46.49-52Given the importance of CD150 in these processes we developed a panel of monoclonal antibodies to mCD150 to further investigate the signaling and immune role of this receptor.
We find that the CD150/SAP interaction is unnecessary for monoclonal anti-CD150–induced IFN-γ augmentation but SAP−/− T cells produce higher levels of IFN-γ following CD3 triggering alone. These results parallel observations published recently by Latour and colleagues53 but differ in one important respect. Latour et al show that CD150 and SAP cotransfection into the CD150/SAP− T-cell line BI-141 completely inhibits IFN-γ production in response to TCR cross-linking. We observe that wild-type T cells activated via CD3 triggering for 3 days (which express both CD150 and SAP) produce significant amounts of IFN-γ, suggesting that the inhibitory effect of SAP and CD150 on IFN-γ production by primary T cells cannot be complete. One possible explanation for this apparent discrepancy may be in the transcriptional regulation of the SAP and CD150 genes in the 2 experimental systems. Latour and colleagues used a class II restricted CD4-CD8-T-T cell hybridoma BI-141 stably transfected with SAP and CD150 in vectors under the strong positive control of the SRα promoter. Under these conditions of strong transcriptional control and “overexpression,” the effects of CD150 and SAP on IFN-γ production may be exaggerated. The mechanism by which antibodies directed at CD150 increase IFN-γ and proliferation is unknown. However, the idea that CD150/SAP signaling exerts a negative influence on IFN-γ transcription in T cells is supported by our data if, in fact, monoclonal antibodies against CD150 function to block homophilic CD150/CD150 signaling on adjacent T cells. Indeed, CD150/CD150 interactions have been observed on adjacent transfected Jurkat T cells.10 Our observation that T cells deficient in SAP produce more IFN-γ in response to CD3 triggering coupled with the observation that antibodies to CD150 induce a significant increase in IFN-γ supports this hypothesis. The CD150 knockout mouse will help us to clarify the relative importance of CD150 homophilic interaction between T cells and APCs in T-cell costimulation and TH1/TH2 polarization
Although anti-CD150 antibodies increase IFN-γ production by TCR-triggered T cells, they do not appear to “program” T cells into a TH1 phenotype independent of IFN-γ. TH2 priming of primary CD4 T cells can be inhibited by anti-CD150 antibody, but this effect can be completely reversed by anti–IFN-γ antibodies added during the initial TH2 priming. Thus, CD150 antibodies induce IFN-γ production but blocking IFN-γ inhibits any TH1-skewing effect of CD150 on secondary stimulation. In support of this conclusion we did not observe any significant changes in transcriptional levels of the TH1 or TH2 transcription factors T-bet and GATA-3 in these experiments (data not shown).
Despite the lack of evidence for downstream regulation of T-bet and GATA-3 by CD150 in these experiments, we observed a strong synergistic effect between anti-CD150 treatment and IL-12 in regulation of IL-12Rβ2 transcription in CD4 T cells. This result is intriguing given recent findings that dendritic cells can induce activation and IL-12Rβ2 expression on TH1 clones in an antigen-independent fashion54; the cell surface receptors signaling this up-regulation are unknown at present.
Because of the relationship between CD150 triggering and IL-12 on IL12Rβ2 expression by CD4 T cells, one function of CD150 on T cells and antigen presenting cells could be to regulate the TH1 response via IL-12. This may involve CD150 homophilic interactions between T cells and APCs leading to augmentation of IL-12 by the APCs and up-regulation of IFN-γ and the IL-12R on the T cell. This hypothesis is supported by the studies to date using monoclonal antibodies against CD150 on T cells, monocytes, and dendritic cells.22-24 47 However, the effect of anti-CD150 antibodies in inhibiting TH2 skewing is clearly not wholly dependent on IL-12Rβ2 up-regulation as these polarization experiments use anti–IL-12 for TH2 induction. Therefore, anti-CD150–mediated IFN-γ and IL-12Rβ2 up-regulation, while contributing to the same outcome, are independent.
Akt has pleiotropic effects in signaling; it is involved in downstream signaling from CD2844,45 and growth factor receptors where it is involved in transducing antiapoptotic effects and costimulation of IFN-γ via downstream phosphorylation of BAD, GSK-3, caspase-9, FKHR, and numerous other signaling intermediates (for a review, see Franke et al55). Recently the mechanism of contact-mediated immunosuppression by measles virus has been shown to involve suppression of Akt activation.56 This phenomenon was shown to be independent of CD46 expression as it occurs in experimentally infected cotton rats, which do not express CD46. It is reasonable to speculate that measles virus may interfere with CD150-mediated Akt activation, leading to inhibition of activation of both T and B cells, although this has yet to be proved experimentally.
Our data show that CD150 mRNA transcripts are expressed by CD4 and CD8 T cells, B cells, and CD11b+ monocyte/macrophages. Following TCR-mediated activation of T cells or LPS-mediated activation of macrophages, CD150 is rapidly up-regulated at the cell surface. Antibodies generated against CD150 induce T-cell IFN-γ induction independently of SAP signaling. Likewise antibodies to CD150 reveal a relationship between CD150 and regulation of IL-12Rβ2 transcription by CD4 T cells. T-cell costimulation via CD150 is SAP independent and results in downstream Akt activation. It will be of great interest to investigate the roles of the other members of the SLAM family (ie, CD229, CD84, CD244, SF2000/Ly108, SF2001, and 19A) in these processes.
The authors are indebted to Dr William Faubion, Dr Maria Simarro, and Dr Stephen Kriese for critical review of the manuscript and valuable discussions.
Prepublished online as Blood First Edition Paper, June 14, 2002; DOI 10.1182/blood-2002-02-0445.
Supported by a grant from the National Foundation March of Dimes. D.H. is supported by a fellowship from the Leukemia and Lymphoma Society. S.R. is funded by the Dr Saal van Zwanenberg Stichting.
The publication costs of this article were defrayed in part by page charge payment. Therefore, and solely to indicate this fact, this article is hereby marked “advertisement” in accordance with 18 U.S.C. section 1734.
References
Author notes
Duncan Howie, Division of Immunology, RE-204, Beth Israel Deaconess Medical Center, Harvard Medical School, 330 Brookline Ave, Boston, MA 02215; e-mail: dhowie@caregroup.harvard.edu.

This feature is available to Subscribers Only
Sign In or Create an Account Close Modal