Although it is generally accepted that the initial event in coagulation and intravascular thrombus formation is the exposure of tissue factor (TF) to blood, there is still little agreement about the mechanisms of thrombus propagation and the identities of the molecular species participating in this process. In this study, we characterized the thrombotic process in real-time and under defined flow conditions to determine the relative contribution and spatial distribution of 3 components of the thrombi: circulating or blood-borne TF (cTF), fibrin, and platelets. For this purpose, we used high-sensitivity, multicolor immunofluorescence microscopy coupled with a laminar flow chamber. Freshly drawn blood, labeled with mepacrine (marker for platelets and white cells), anti-hTF1Alexa.568 (marker for tissue factor), and anti-T2G (marker for fibrin) was perfused over collagen-coated glass slides at wall shear rates of 100 and 650 s−1. A motorized filter cube selector facilitated imaging every 5 seconds at 1 of 3 different wavelengths, corresponding to optimal wavelengths for the 3 markers above. Real-time video recordings obtained during each of 10 discrete experiments show rapid deposition of platelets and fibrin onto collagen-coated glass. Overlay images of fluorescent markers corresponding to platelets, fibrin, and cTF clearly demonstrate colocalization of these 3 components in growing thrombi. These data further support our earlier observations that, in addition to TF present in the vessel wall, there is a pool of TF in circulating blood that contributes to the propagation of thrombosis at a site of vascular injury.
Introduction
Tissue factor (TF) is an integral membrane protein that is found primarily on the surface of certain cell types that are located outside the vasculature.1 2 Because of its ideal physical location in the vasculature, vessel wall TF remains separated from the various coagulation proteins that circulate in the blood, thus preventing thrombus formation in intact vessels. The most widely accepted view of coagulation and thrombosis is that following vascular injury, vessel wall TF is exposed to flowing blood, whereupon it forms a complex with factor VII/VIIa(FVII/VIIa), thus initiating the coagulation cascade and eventually resulting in clot or thrombus formation. Therefore, in this current view of arterial thrombosis, propagation of thrombi requires that various coagulation reactions as well as platelet deposition occur on the luminal thrombus surface. However, thrombi are relatively large structures extending 1 to 3 mm above the vessel wall. Vessel wall–derived activated coagulation factors would have to diffuse from the injured vessel wall site through the deposited thrombus to the luminal surface to be present at the site of the growing thrombus. Even in an ideal situation of free diffusion, a protein of molecular weight 50 000 would require hours to reach the apex of a 1-mm thrombus. Circulating or blood-borne TF (cTF), carried by unidentified cells or vesicles in flowing blood, would permit the activation of FIX and FX right on the luminal surface of a growing thrombus, and thereby would not be subject to the same diffusional limitation.
Thrombi formed in vitro by flowing whole blood over collagen-coated glass slides, in the absence of vascular TF, were found to be intensely immunostained with anti-TF antibodies; whereas addition of anti-TF antibodies and inhibited FVIIa(FVIIai) to the flowing blood markedly inhibited the formation of thrombi.3 These authors suggested that blood-borne TF, possibly leukocyte derived, may be involved in the thrombus propagation at the site of vascular injury. The studies conducted thus far, however, have been limited to an end product of the thrombotic process and have yielded little information about the dynamics of thrombus initiation and propagation. The primary objective of this study was therefore to characterize the thrombotic process in real-time and under defined flow conditions, to determine the relative contribution and spatial distribution of 3 critical components of the thrombi: cTF, fibrin, and platelets.
Materials and methods
Reagents
Equine type III collagen was purchased from Helena Laboratories (Beaumont, TX; no. 5368). Mepacrine (Sigma Chemicals, St Louis, MO; no. Q3251) was used as marker for platelets. This antibiotic possesses intrinsic fluorescence and is taken up by platelet dense bodies. Monoclonal antifibrin antibody, T2G1, was made as previously described.4 This antibody does not bind to intact fibrinogen but reacts fully with fibrin IIβ chain (β 15-42). For the imaging studies, antifibrin T2G1 antibody was labeled with the amine-reactive succinimidyl ester of the fluorescent probe FluoroLink Cy-5 (Amersham Pharmacia Biotech, Piscataway, NJ, catalog no. PA 25001; color of fluorescence, far-red; absorption maximum, 649 nm; fluorescence maximum, 670 nm). Monoclonal anti-TF antibodies (hTF1) have been described.5Alexa 568 (Molecular Probes, Eugene, OR, catalog no. A-10238) was used to label the anti-TF antibody (color of fluorescence, red; absorption maximum, 573 nm; fluorescence maximum, 596 nm). ChromPure mouse IgG, whole molecule (Jackson Immunoresearch, West Grove, PA, catalog no. 015-000-003) served as the control antibody. FX was purified from human plasma.6 Spectrozyme Xa was obtained from American Diagnostica, (Greenwich, CT, catalog no. 222L). Inhibited FVIIa(FVIIai) was prepared by the addition of a 10-fold molar excess of D-phe L-phe arg chloromethyl ketone (Bachem, Torrance, CA, catalog no. N-1215) to FVIIa, incubation for 90 minutes at room temperature, and dialysis versus HEPES (N-2-hydroxyethylpiperazine-N′-2-ethanesulfonic acid) buffer overnight. Bovine serum albumin (1% BSA; Sigma Chemicals, catalog no. A-0281) was used to prevent nonspecific adhesion to collagen-coated slides.
Preparation of collagen-coated glass slides
Superfrost glass slides (Fischer Scientific, Hanover Park, IL, catalog no. 12-550-15) were placed in a 10-μg/mL collagen solution at 4°C for 2 hours. The slides were then dip-rinsed in phosphate-buffered saline (PBS) and transferred to a 1% BSA solution and kept at 4°C overnight. The following day the slides were warmed to room temperature and washed with PBS before placing in the parallel plate flow chamber.
Blood collection and processing
Ca++ is required for the production of TF in whole blood.7 To prevent TF production after collection, human blood was collected into 1:10 (vol/vol) 3.4% sodium citrate. The blood was then incubated with the following markers for 90 minutes at 37°C with gentle mixing: mepacrine (10 μM), hTF1Alexa568 (20 μg/mL), T2G (20 μg/mL). The markers were added in 30-minute intervals to the blood, the first label being mepacrine. Blood was then recalcified (5 mM CaCl2) and used in the perfusion experiments.
Perfusion experiments
The parallel plate chamber (Grabowski chamber) used in this perfusion system has been described.8 Collagen-coated cover slips were mounted in this chamber. Labeled, recalcified blood, placed in a reservoir was connected to the inlet of the chamber via Tygon tubing (DOW Corning, Midland, MI). A syringe pump connected to the outlet was used to aspirate the blood through the chamber at desired flow rates. Wall shear rates of 100 and 650 s−1 were used in this study. Chamber occlusion was taken as the end-point of the experiment.
Image capture and analysis
The laminar flow chamber was coupled with a high-sensitivity, multicolor immunofluorescence microscope similar in design to that previously described by Grabowski,8 which incorporates mounting of the chamber with the direction of blood flow antiparallel to the direction of gravity so as to minimize red cell sedimentation transverse to flow streamlines. We therefore constructed the apparatus shown in Figure 1.
Schematic of the perfusion circuit used in the imaging-flow experiments.
The components, numbered sequentially, are: (1) microscope objective, Nikon Plan Fluor 20 × 0.5NA; (2) and (3) motorized 4-position filter cube selector (computer controlled) with Nikon filter cubes; (4) Nikon tube lens; (5) horizontal microscope with a quartz illuminator; (6) and (7) Nikon epi-illuminator and 75 W xenon-arc lamp, which may optionally be connected via a liquid light guide; (8) vertically mounted flow chamber; (9), (10), and (11) manual microtranslators for x-y positioning and focusing of the specimen; (12) and (13) sample reservoir, connected to chamber with minimal length of tubing, and syringe pump operating in withdrawal mode.
In this configuration, the set-up yielded one 3-wavelength composite image per 5 seconds. Images were acquired at a magnification of ×20. Image acquisition was performed using Image-1 (Universal Imaging, Downingtown, PA). ASYST was used for microscope control. Captured images were corrected for background, uneven illumination and sensitivity, as well as image shift between wavelengths. Imaging software Paint Shop Pro was used to add pseudo-color to the obtained images. Analysis included determination of the time-dependence of the cross-sectional area of thrombi in the plane of view and of the spatial distribution of the 3-labeled components.
Controls
The probes were selected for their relatively high photostability and the wide spectral separation, which maximizes the sensitivity while minimizing the cross-talk among individual fluorescence images obtained with the filter set appropriate for each chromophore. To determine the stability as well as specificity of each of these probes, the following control experiments were performed: (1) ChromPure mouse IgG was individually labeled with the Alexa 568 and Cy-5 probes. In one set of experiments whole blood was labeled with mepacrine, IgGAlexa568 and anti-fibrinT2G. In another set of experiments, the labels used were mepacrine, anti-TF hTF1Alexa568, and IgGCy-5. Specificity of the antibodies used was determined by performing the perfusion experiments as described above with such labeled blood. (2) To ensure that there was less or almost no cross-talk among the fluorophores, whole blood was labeled with one fluorophore alone for each perfusion experiment; that is, with mepacrine for one perfusion experiment, anti-TF hTF1Alexa 568 for the second experiment, and anti-fibrinT2G for the third. During perfusion, in addition to the wavelength of the fluorophores used, images were obtained at the wavelengths corresponding to the other 2 fluorophores.
Results
Low wall shear rates
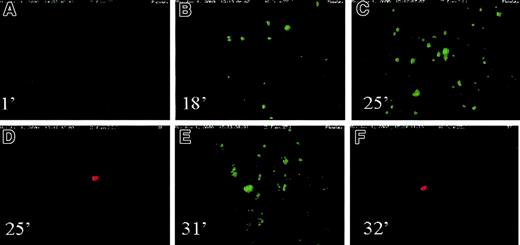
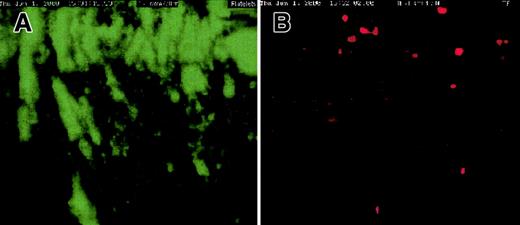
Freshly drawn blood was labeled with mepacrine (platelet marker) and hTF1Alexa568 (cTF marker) and perfused over collagen-coated slides at wall shear rate (γw) of 100 s−1. Real-time videomicroscopy demonstrated the presence of cTF deposited in the areas of large platelet aggregates/thrombi during 25 minutes of blood flow. “Particles” of cTF moving past the glass slide were visible within 5 minutes of initiation of blood flow. Figure 2 shows a series of images of platelets (green) and cTF (red) deposited onto the cover slides at various time points of flow. The chamber occluded after about 30 minutes of blood flow. Thereafter, the camera was moved along the length of the chamber to capture the presence of platelets and cTF in the various deposited thrombi. One such thrombus demonstrating colocalization of platelet aggregates and deposited cTF is shown in Figure 3. Although colocalization is intuitively obvious in Figure 2, superpositioning of platelet aggregates (panel 1) and cTF (panel 2) demonstrates significant colocalization of these 2 blood components (panel 3). Figure4 shows a large number of platelet aggregates imaged downstream, near the exit outlet of the chamber. cTF was found anchored to such large aggregates.
Platelets and cTF on cover slides.
A series of images of platelets (green) and cTF (red) deposited onto the cover slides at various time points of flow. Wall shear rate used in this experiment was 100 s−1. Time sequence of images: (A) 1 minute; (B) 18 minutes; (C) 25 minutes; (D) 25 minutes; (E) 31 minutes; (F) 32 minutes. The direction of blood flow is from top to bottom. Original magnification × 20.
Colocalization of platelet aggregates and deposited cTF.
Thrombi demonstrate colocalization of platelet aggregates (green) and deposited cTF (red). Panel A shows adhered platelet aggregates; cTF is shown in panel B, and panel C represents the superpositioning of panels A and B. The direction of blood flow is from top to bottom. Original magnification × 20.
Platelet aggregates downstream.
A large number of platelet aggregates (green) were imaged downstream, near the exit outlet of the chamber. cTF (red) was found anchored to such large aggregates. The direction of blood flow is from top to bottom. Original magnification × 20.
Platelet aggregates downstream.
A large number of platelet aggregates (green) were imaged downstream, near the exit outlet of the chamber. cTF (red) was found anchored to such large aggregates. The direction of blood flow is from top to bottom. Original magnification × 20.
Physiologic arterial wall shear rate
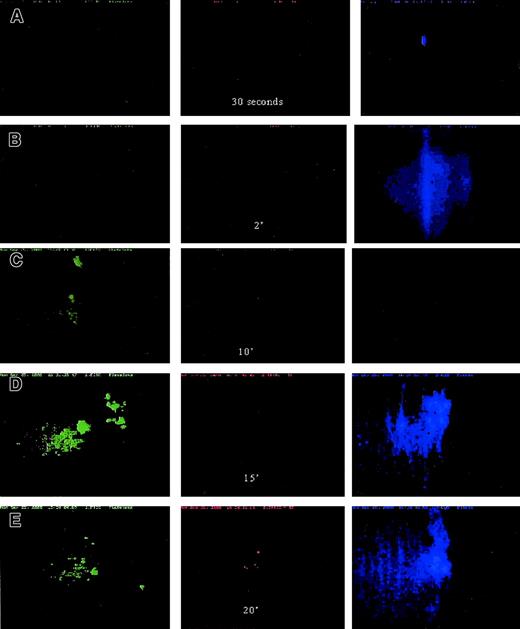
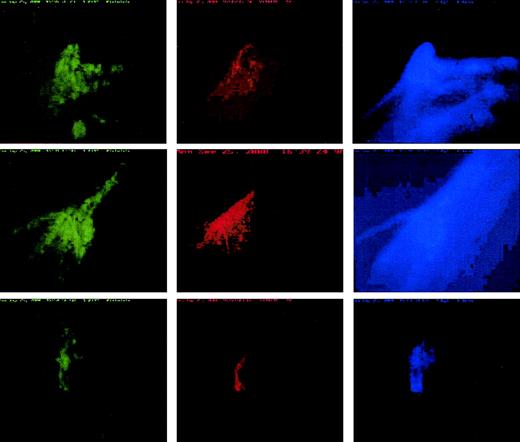
Preliminary experiments having demonstrated that the proposed real-time imaging studies were indeed experimentally feasible, the next experiments were designed to study the incorporation of platelets, TF, and fibrin in a growing platelet thrombus, as described above. To mimic the rheologic conditions of intact arteries, the flow experiments were performed at a wall shear rate of 650 s−1. At this wall shear rate, too, cTF was found primarily colocalized with large platelet aggregates. Platelets were seen anchored to the collagen-coated cover glass in about 10 minutes of blood flow. Moving platelet and fibrin particles were observed within a few minutes of perfusion (Figure 5); platelet adhesion and aggregation commenced within 10 minutes. After 30 minutes the chamber completely occluded. Shown in Figure6 are the pseudo-colored digitized images from the same experiment of platelets, cTF, and fibrin incorporated into growing thrombi. The deposition pattern of each of these components, although colocalized, is unique within the thrombi.
Platelet, cTF, and fibrin movement.
Platelet (green) and fibrin (blue) movement across collagen-coated glass slides at 650 s−1 wall shear rate. Time sequence of images: (A) 30 seconds; (B) 2 minutes; (C) 10 minutes; (D) 15 minutes; (E) 20 minutes. Adhesion of platelets (green) as well as fibrin (blue) strands occurred within about 15 minutes of blood flow. The first cTF (red) signal was obtained after 20 minutes of flow. The direction of blood flow is from top to bottom. Original magnification × 20.
Platelet, cTF, and fibrin incorporation into thrombi.
Incorporation of platelets (green), cTF (red), and fibrin (blue) into growing ex vivo thrombi obtained by perfusing whole, labeled blood at 650 s−1 wall shear rate. The deposition pattern of each of these components, although colocalized, is unique within the thrombi. The direction of blood flow is from top to bottom. Original magnification × 20.
Control experiments
The antibodies (anti-TF hTF1 and anti-fibrin T2G1) and mepacrine were used at a final concentration of 20 μg/mL and 10 μM, respectively, to label their target antigens in circulating blood. These values were chosen by performing a titration to determine the concentration at which antibodies (or mepacrine) did not inhibit platelet aggregation or thrombus formation. Immunohistochemical staining as well as real-time visualization techniques were used for this purpose.
ChromPure mouse IgG labeled with each of the fluorophores was used to test the specificity of the antibodies used in these studies. Only platelet aggregates and cTF incorporated into such platelet clusters, were recorded by perfusing whole blood labeled with mepacrine, anti-TF hTF1Alexa568, and IgGCy-5 at 650 s−1 wall shear rate. No signal was obtained in the Cy-5 channel. Similarly only groups of platelets, large platelet aggregates, and fibrin strands were observed when blood was labeled with mepacrine, IgGAlexa568, and antifibrin T2G. Blood labeled with mepacrine alone demonstrated the presence of moving platelets initially, adherent platelets gradually, and large platelet aggregates finally. No signal was detected under the filter for Alexa 568 and Cy-5 fluorophores. Similarly, in the case of the Alexa 568 and Cy-5 fluorophores, signal was obtained only under the wavelength of the chromophore used, demonstrating that there was no leakage of fluorescent signal among the 3 different wavelengths used in this study.
Does cTF circulate with platelets as a complex?
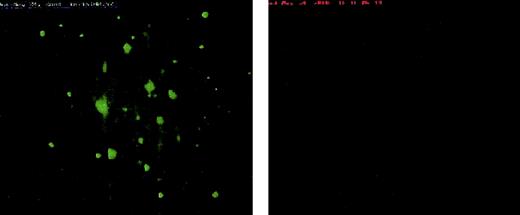
To ascertain whether cTF circulates as a complex with resting as well as single activated platelets, labeled whole blood (mepacrine for platelets and anti-TF hTF1Alexa 568 for cTF), not recalcified was perfused at 100 and 650 s−1 over glass slides that were not coated with collagen. In both cases, a number of platelets moving past the surface were recorded. cTF moving past the slide was also visible (not recordable due to the small amounts present in blood). The spatial distribution of these components was dissimilar; that is, colocalization was not seen in flowing blood in the absence of platelet adhesion/aggregation. Due to the absence of a “sticky” substrate, platelets scantily adhered to the flow area of the plain glass slides in this experiment. Adherent cTF molecules were not found in this case (Figure 7). After about 20 minutes, calcium was introduced into the reservoir containing the blood. Chamber occlusion occurred when large masses of platelets aggregated downstream, near the exit outlet of the flow chamber. The flow field tends to be 3-dimensional with important effects of fluid inertia in the exit (and inlet) region of the flow chambers. In contrast to no colocalization with the sparse population of adherent platelets on the glass substrate, the cTF marker was found incorporated into these large platelet masses downstream after recalcification.
Platelet adherence to noncoated slides.
Scanty platelet (green) adherence to non–collagen-coated glass slides at 650 s−1 wall shear rate is seen. Deposition of cTF (right panel) to the same substrate as well as any colocalization with adherent platelets could not observed. The direction of blood flow is from top to bottom. Original magnification × 20.
Discussion
Although it is generally accepted that the initial event in coagulation and intravascular thrombus formation is the exposure of TF to blood, there is still little agreement about the mechanism of thrombus propagation and the identities of the molecular species participating in this process. The order in which platelets, fibrin, and circulating TF are deposited onto natural as well as artificial substrates to enable thrombus formation is largely unknown. Therefore, we characterized the thrombotic process in real-time and under defined flow conditions, to determine the relative contribution and spatial distribution of 3 components of the thrombi: circulating TF, fibrin, and platelets. Flowing cTF was observed within a few minutes of onset of perfusion of blood over collagen-coated cover glass placed in a parallel plate flow chamber. Real-time video recordings obtained during each of 10 experiments show rapid deposition of platelets and fibrin onto collagen-coated glass (Figure 5). Overlay images of platelets, fibrin, and cTF clearly demonstrate colocalization of these 3 components in growing thrombi (Figure 6). cTF was recruited only by areas where large platelet aggregates and thrombi had been deposited, thus clearly indicating the thrombogenic potential of cTF. Our images show unambiguous colocalization of platelet aggregates, cTF, as well as fibrin; the pattern of deposition of each of these components within the thrombi being unique (Figure 6).
Blood was perfused at 100 and 650 s−1 wall shear rates in this study. Prior to perfusion, anticoagulated blood was incubated with the 3 fluorescent markers in a sequential fashion for an incubation period lasting for 90 minutes. The blood was then recalcified and aspirated through the flow chamber. Even though constitutive expression of TF on circulating monocytes and TF localization on granulocytes is still controversial, one of the concerns arising from this experimental design is that such a long incubation period could lead to de novo synthesis of such monocyte- and granulocyte-associated TF. Previous studies have demonstrated the induction of TF expression in peripheral blood monocytes.9-11 To rule out this possibility, whole anticoagulated blood was incubated with the 3 markers simultaneously for time periods ranging from 10 minutes to 90 minutes, prior to perfusion and imaging. Spatial distribution of adherent platelets, aggregates, cTF incorporated into platelet clusters, as well as supporting fibrin network formation was identical for both the short (10 and 20 minutes) as well as the long (60 and 90 minutes) incubation times studied. With respect to intensity of the signal, a shorter incubation time that gives the fluorophores less time to bind to their corresponding antigens, resulted in about 50% less intensity than that obtained from the 30-minute incubation times, and 75% less than those obtained after 90-minute incubation times. Due to similar spatial distribution of the 3 components at all incubation times, and a marginal increase in the number of cTF molecules (as judged by the volume and distribution of signal) with longer incubations, it is safe to conclude that we were indeed imaging circulating TF in this investigation.
The obtained circulating TF signals were categorized based on the obtained colocalized signals. One pool of cTF molecules seemed to align well with the platelets as well as fibrin and was found to be present even when the fluorescent tags were incubated with whole blood for short time periods. In some images, particularly the perfusion experiments where the incubation was carried out for 90 minutes, in addition to colocalized signals, we imaged cTF that seemed not to perfectly colocalize with platelets. A shift in registers between the platelet and tissue factor was observed. Although the tissue factor signal lies in the same region as the platelet clusters, overlay images of these 2 components did not result in 100% alignment. It is possible that in addition to a plasma-derived fraction of TF, circulating microparticles containing TF were also imaged. TF is a transmembrane protein and this transcellular transfer (eg, to the membrane of activated platelets) would involve TF “residing” in vesicles. An important question then arises as to what may be the source of such circulating TF containing microparticles in short-term ex vivo perfusion experiments performed in the absence of TF-containing tissues. A variety of events (apoptosis, acute coronary syndromes),12-14 agents (cytokines, lipopolysaccharides),15,16 and pathologic conditions (lupus, meningococcal sepsis)17,18 have been reported to trigger release of microparticles containing TF activity. Because TF is expressed on a variety of extravascular cells even under normal conditions,18,19 it appears then that these particles may have been synthesized and released into circulation prior to the withdrawal of blood in our experiments. Cells such as granulocytes might have captured these microparticles and become their active carriers, providing the adhesion molecules necessary for the recruitment of such particles into growing thrombi. Recent data suggest that monocytes and possibly polymorphonuclear leukocytes are one possible source of circulating TF, which is transferred to platelets, thereby making TF+ platelets capable of perhaps triggering and subsequently propagating thrombosis.20 These authors demonstrated that CD15 (a leukocyte membrane-bound carbohydrate known as sialyl Lewis) and P-selectin (an α granule–derived activation-dependent adhesion molecule found on platelets) interactions mediate the formation of highly procoagulant platelet aggregates containing TF particles from leukocytic cells. Whether these cells are able to express TF themselves or acquire TF from other cells and deposit them into thrombi warrants investigation.
A large part of the obtained TF signals appears to be derived from plasma. Strong TF signals were obtained from platelet-rich plasma as well as platelet-poor plasma fractions of blood, whereas washed suspension of resting as well as activated platelets emitted baseline levels of fluorescence signal (data not shown). Recent evidence from our laboratory suggests that there is indeed a plasma protein form of tissue factor circulating in the human vascular system (V. Bogdanov, V.B., O. Vele, et al, manuscript submitted, May 2002). Studies are currently underway to determine the nature of this plasma protein and its functional significance with respect to thrombosis as well as hemostasis.
A series of human studies suggest that blood-borne tissue factor (cTF) might be an important factor in the etiology of several diseases. Plasma TF levels quantified by enzyme-linked immunosorbent assay have been reported to be increased in patients with unstable angina, myocardial infarction, trauma, sepsis, disseminated intravascular coagulation, antiphospholipid antibody syndrome, and sickle cell disease.21-24 Levels of blood-borne TF were reported to correlate with the severity of the coronary artery disease state. Irrespective of the origin of cTF, an interesting question that warrants investigation is how blood-borne TF circulates in a dormant state until thrombotic events commence. Our studies show that cTF is incorporated into large platelet clusters only as the thrombotic events commence. Prior to that cTF does not appear to anchor onto the platelet membrane surface and circulate as complex (Figure 7). Therefore, bringing the TF/FVIIa activity into close proximity to the activated platelet surfaces appears to be a key step in the propagation of thrombosis. Whether circulating (blood-borne) TF provides an effective signal to initiate thrombosis, in addition to propagation, remains to be determined. To address this question, perfusion experiments using a faster imaging system that provides temporal resolution in the order of milliseconds are currently being conducted in our laboratory.
The support of Heiki Vaananen (Department of Physiology and Biophysics) for his extensive technical support with the imaging work (imaging system construction as well as image acquisitioning) is gratefully acknowledged. The authors would like to thank Dan Wu for excellent technical help in the preparation of monoclonal antibody T2G1.
Prepublished online as Blood First Edition Paper, June 21, 2002; DOI 10.1182/blood-2002-03-0902.
Supported by National Institutes of Health grants 5 P50 HL54469, 5 P01 HL29019, and HL 33095.
The publication costs of this article were defrayed in part by page charge payment. Therefore, and solely to indicate this fact, this article is hereby marked “advertisement” in accordance with 18 U.S.C. section 1734.
References
Author notes
Yale Nemerson, Division of Thrombosis Research, Mount Sinai School of Medicine, Box 1269, Annenberg 24-92, 1 Gustave L. Levy Pl, New York, NY 10029; e-mail: yale.nemerson@mssm.edu.



This feature is available to Subscribers Only
Sign In or Create an Account Close Modal