A decrease in light transmittance before clot formation, manifesting as a biphasic waveform (BPW) pattern in coagulation assays, was previously correlated with the onset of disseminated intravascular coagulation (DIC). In this study of 1187 consecutive admissions to the intensive care unit, the degree of this change on admission predicts DIC better than D-dimer measurements. Additionally, the BPW preceded the time of DIC diagnosis by 18 hours, on average, in 56% (203 of 362) of DIC patients. The BPW is due to the rapid formation of a precipitate and coincident turbidity change on recalcification of plasma. The isolated precipitate contains very-low–density lipoprotein (VLDL) and C-reactive protein (CRP). The addition of CRP and Ca++ to normal plasma also causes the precipitation of VLDL and IDL, but not LDL or HDL. The Kd of the CRP/VLDL interaction is 340 nM, and the IC50 for Ca++ is 5.0 mM. In 15 plasmas with the BPW, CRP was highly elevated (77-398 μg/mL), and the concentration of isolated VLDL ranged from 0.082 to 1.32 mM (cholesterol). The turbidity change on recalcification correlates well with the calculated level of the CRP–VLDL complex. Clinically, the BPW better predicts for DIC than either CRP or triglyceride alone. The complex may have pathophysiological implications because CRP can be detected in the VLDL fraction from sera of patients with the BPW, and the VLDL fraction has enhanced prothrombinase surface activity. The complex has been designated lipoprotein complexed C-reactive protein.
Introduction
The optical profile of clot formation on simple assays of coagulation, such as the activated partial thromboplastin time (APTT), can be atypical in patients with hemostatic dysfunction.1,2 The biphasic waveform (BPW) was initially described when a decrease in plasma light transmittance before clot formation on the MDA 180 automated coagulation analyzer was shown to correlate with disseminated intravascular coagulation (DIC) in critically ill patients.3-5 In contrast to the normal sigmoidal waveform pattern that is characterized by an initial 100% light transmittance phase before clot formation, patients with a biphasic pattern had an immediate, progressive decrease in light transmittance that occurred even in the preclotting phase. The magnitude of this BPW often varied with sequential samples taken from individual patients and appeared early in samples from patients who were later diagnosed with DIC by more conventional criteria. DIC is common in many primary diseases, such as sepsis. Because its diagnosis in the acute clinical setting is largely dependent on several coagulation test changes that lack specificity on an individual basis, the BPW appeared to offer the advantage of relative simplicity, rapidity, and robustness for early diagnosis.
A subsequent prospective study,4 in which all samples received in a diagnostic laboratory over a 2-week period were examined, indicated that the sensitivity and specificity of the BPW for DIC are 97.6% and 98%, respectively. An overall positive predictive value of 74% was obtained, and this value increased with increasing falls in light transmittance. A real-time correlation was also noted between clinical events and BPW changes. Serial reductions in light transmittance invariably indicated impending death.5
The early predictive and prognostic relevance of waveform analysis potentially provides a practical tool in assigning risk in critical care patients, in whom DIC development is known to have a worse prognosis. The identification of DIC at an early or nonovert phase could enable improved targeting of a cohort for which therapeutic modalities are now emerging.6 Findings presented below further extend the clinical diagnostic relevance of the BPW. They also show that it is caused by the precipitation of complex consisting of C-reactive protein (CRP) and very-low–density lipoprotein (VLDL).
Patients, materials, and methods
Patient samples for purification studies
Citrated plasma for isolation of the complex was obtained, with study approval from the Liverpool Research Ethics Committee, from 15 patients with BPW of varying severity and DIC arising from sepsis (7), pancreatitis (2), respiratory distress syndrome (2), ruptured abdominal aortic aneurysm (1), and trauma. At the time of sampling, 7 patients required assisted ventilation, 3 required enteral feeding, and 2 required total parenteral nutrition.
Materials
Human recombinant CRP, VLDL, phenylalanyl-prolyl-arginyl chloromethylketone (PPACK), and sheep anti-human serum amyloid A (SAA) immunoglobulin G (IgG) were from Calbiochem (La Jolla, CA). Sheep anti-human apolipoprotein B-100 (apoB) IgG was from Boehringer Mannheim (Laval, PQ, Canada). Infinity cholesterol reagent, cholesterol calibrator (2 g/L), rabbit anti-human CRP IgG, and mouse anti-goat/sheep IgG conjugated with horseradish peroxidase (HRP) were from Sigma (St Louis, MO). Goat anti-mouse IgG conjugated to HRP was from Amersham (Mississauga, ON, Canada). All other reagents were of analytical grade.
Turbidity assay for complex formation
A standard curve was prepared by mixing normal and BPW-positive plasmas in various proportions (50 μL total) with 125 μL of 20 mM HEPES/0.15 M NaCl/1 mM sodium citrate, pH 7.4 (HBS-cit), plus 10 μM PPACK. Turbidity at 405 nm was monitored over time. After 30 seconds, an aliquot of CaCl2 was added (50 mM final), and the turbidity change at 405 nm was monitored to completion over 20 minutes at 20°C in a microtiter plate reader. The assay was used to identify and quantify the active component or components during their isolation from patient plasma.
Isolation of active material from patient plasmas
Patient plasma (6-12 mL) was supplemented with PPACK (10 μM) and dialyzed at 4°C versus HBS-cit, pH 7.4. PPACK (10 μM) and CaCl2 (50 mM) were then added. Samples were incubated for 15 minutes at room temperature and then on ice for 30 minutes. An obvious precipitate formed. A volume of distilled water equal to the starting plasma volume was added and the mixture centrifuged at 31 000g for 20 minutes at 4°C. The supernatant was removed from underneath the floating precipitate with an 18-gauge needle and syringe. The precipitate was washed 3 times by suspending in the starting plasma volume of 0.01 M HEPES, pH 7.4, containing CaCl2 (25 mM) and PPACK (10 μM) and then centrifuging. The precipitate was dissolved in HBS containing PPACK (10 μM) and trisodium citrate (10 mM), pH 7.4, and the solution was dialyzed at 4°C against 0.02 M HEPES/0.02 M NaCl containing 1.0 mM trisodium citrate, pH 7.4 (buffer A). The dialyzed solution following PPACK (10 μM) addition was applied at 22°C to a Q-Sepharose Fast Flow column (5 mL bed volume; Amersham Pharmacia, Baie d'Urfe, PQ, Canada) equilibrated with buffer A. Fractions of 2 mL were collected. Elution used a linear gradient (100 mL) of 0.02 to 0.5 M NaCl in buffer A. Fractions were subjected to the turbidity assay using normal plasma. Two peaks of material were separately pooled, concentrated to 1.0 to 1.25 mL using Millipore concentrators (10 000 MWCO, Ultrafree 15 type; Millipore, Bedford, MA), and stored at 4°C for future analyses.
SDS-PAGE and immunoblotting
Sodium dodecyl sulfate–polyacrylamide gel electrophoresis (SDS-PAGE; nonreducing and reducing) was performed according to Neville7 using 2.5% to 5% or 4% to 15% polyacrylamide gradient gels. Transfer to Immobilon-P membranes (Millipore) at 0.25 A for 14 to 16 hours at 22°C and blotting were performed according to Towbin et al.8 Membrane blocking (1 hour, 22°C) used either 6% (wt/vol) Carnation Instant Milk powder (Toronto, ON, Canada; antiapolipoprotein B-100 antibodies) or 2% (wt/vol) bovine serum albumin (BSA; anti-CRP and anti-SAA antibodies). ApoB-100 blotting used a mouse monoclonal anti-human apoB-100 IgG 1D1 from Dr Ross Milne (University of Ottawa, ON, Canada) and a sheep anti-mouse IgG conjugated with HRP. CRP blotting used a rabbit anti-human CRP IgG and goat anti-rabbit IgG conjugated with HRP. SAA blotting used a sheep anti-human SAA IgG and mouse anti-goat/sheep IgG conjugated with HRP. Detection involved mixing equal volumes of the Chemiluminescence Reagent Plus (Mandel Scientific, Guelph, ON, Canada) solutions over the blots at room temperature for 1 minute and exposure to x-ray film.
NH2-terminal sequencing
Samples were electrophoresed in 4% to 15% polyacrylamide gradient gels and transferred to an Immobilon-P membrane. The NH2-terminal sequencing of materials on the membrane was performed by Dr David Klapper (University of North Carolina School of Medicine, Chapel Hill) with automated Edman degradation.
Lipoprotein isolation
Normal human plasma lipoproteins were isolated as described previously.9 The VLDL fraction (density, 1.006 g/mL) was isolated after centrifugation at 30 000 rpm for 20 hours at 10°C in a Ti-60 fixed angle rotor (Beckman Instruments, Palo Alto, CA). The upper VLDL layer (approximately 6.0 mL) was harvested and centrifuged again. Intermediate-density lipoprotein (IDL; density, 1.019 g/mL), low-density lipoprotein (LDL; density, 1.063 g/mL), and high-density lipoprotein (HDL; density, 1.21 g/mL) were all sequentially isolated from the VLDL infranatant fraction at the same 2 centrifugation speeds and times used for VLDL, after adjusting the density in each case with solid sodium bromide. The remaining plasma was dialyzed against 0.02 M HEPES, 0.15 M NaCl, 10 mM citrate, pH 7.4 and was concentrated by ultrafiltration to the original plasma volume. This comprised lipoprotein-depleted plasma.
Turbidimetric measurement of the calcium-dependent interaction between purified VLDL and recombinant CRP
The experiments were performed in a microtiter plate. Commercially available normal VLDL in final concentrations (as cholesterol) of 0.03, 0.065, 0.1, and 0.15 mM were incubated with increasing concentrations of recombinant CRP (0-300 μg/mL) in HBS-cit. The maximal change in absorbance at 405 nm after the addition of CaCl2 (50 mM) was measured over 20 minutes at 22°C. The levels of turbidity were analyzed to determine the dissociation constant (Kd) and stoichiometry (n) of the CRP–VLDL interaction. The equations used were:
In these equations, τ is the turbidity, α is a constant relating turbidity to the concentration of the CRP/VLDL complex (CV), and C and V are the total concentrations of CRP and VLDL. Kd indicates the free concentration of CRP at which half the sites for CRP on VLDL are bound. The stoichiometry term n indicates the concentration of CRP bound (mg/L) when VLDL (1.0 mM as cholesterol) is saturated with CRP. The term CV in equation 2 was substituted in equation 1, and the data were fit to the resultant equation by nonlinear regression using the NONLIN module of SYSTAT (Evanston, IL). The dependent variable was τ, the independent variables were C and V, and the best-fit parameters were α, Kd, and n. The Ca++ dependence of the interaction between VLDL and rCRP was also monitored in HBS at 405 nm in the turbidity assay using final rCRP and VLDL cholesterol concentrations of 20 mg/L and 0.065 mM, respectively.
Measurements of CRP and VLDL
VLDL fractions of 15 patient plasmas with BPW were obtained by centrifugation at 356 000g at 10°C for 2 hours in polycarbonate centrifuge tubes (11 × 34 mm) in a Beckman TL-100 tabletop ultracentrifuge (Beckman Instruments, Palo Alto, CA). Apo B-100 levels in the VLDL were measured by enzyme-linked immunosorbent assay (ELISA) using LDL as the standard.9,10 Cholesterol in the isolated VLDL was determined colorimetrically using the cholesterol infinity reagent and cholesterol calibrator. Total protein concentrations were determined with the Bradford assay using BSA as a standard. CRP levels in plasma were determined by ELISA using a rabbit anti-human CRP IgG for capture with detection by the same antibody, conjugated to HRP, according to Tijssen and Kurstak.11ELISA was standardized with purified human recombinant CRP. Rabbit anti-human CRP antibody was sensitive at detecting purified recombinant CRP diluted in phosphate-buffered saline at 1.0 μg/L. Standard curves were linear over the concentration range 1 to 60 mg/L. The antibody was immunospecific for CRP because only a single species of 22 kDa was detected when plasma (0.2 μL) of intensive care unit (ICU) patients, who had elevated levels of CRP, was immunoblotted after reducing SDS-PAGE, and no signal was observed with normal plasma. The average standard deviation from the mean value obtained with 3 dilutions was 10.60%. CRP was also determined in the 1187 clinical study patients, with levels cross-checked using the Eurogenetics kit. The Eurogenetics CRP ELISA, which was calibrated against the World Health Organization International Reference Standard for CRP immunoassay (85/506), had a sensitivity of 0.5 mg/L with a 5.12% coefficient variation between the assays. As a marker of VLDL levels, triglyceride concentrations were also determined in the same cohort.
CRP detection in isolated VLDL fractions from patient sera
Sera from 4 patients with varying degrees of the BPW were obtained. Each of these was divided into three 0.9-mL aliquots. The first aliquot was not manipulated. To the second was added 0.1 mL of 0.1 M EDTA (ethylenediaminetetraacetic acid) to disrupt any complex that might be present. To the third was added 0.1 mL of 0.25 M CaCl2 to optimize complex formation. All samples were centrifuged as described above for VLDL isolation. Isolated fractions were then measured for CRP and triglyceride (Sigma Diagnostics Infinity Reagent) with values then expressed as CRP per millimolar VLDL triglyceride.
Prothrombinase supporting activity of isolated VLDL
The isolated VLDL of 3 patients with BPW and a sample isolated from a pool of 20 healthy volunteers were analyzed for their ability to replace the phospholipid component in prothrombin activation. The VLDL concentrations were adjusted to 100, 200, and 300 μM (triglyceride), and initial rates of thrombin formation were measured by fluorescence in a fluorescence microtiter plate reader according to a procedure similar to that described previously.12
Clinical study population and design
APTT waveform analysis was prospectively evaluated in all adult patients admitted consecutively to the intensive therapy unit (ITU) of the Royal Liverpool University Hospital over a 24-month period. The study had the approval of the Liverpool Research Ethics Committee, with blood samples collected for analysis during the first hour of ITU admission and then once daily until discharge. Clinicians performing the daily clinical assessment and the diagnosis of DIC were masked to the results of the waveform analysis.
APTT waveform analysis
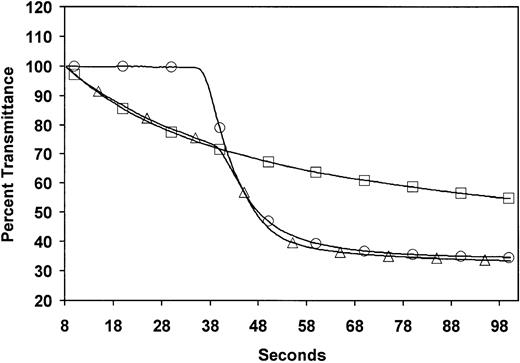
Plasma, derived from blood collected in 0.105 M trisodium citrate at a ratio of 1 part anticoagulant to 9 parts whole blood, was separated within 60 minutes and analyzed immediately. The APTT, including waveform analysis, was determined on the MDA 180 (Organon Teknika, Cambridge, United Kingdom) analyzer using Platelin LS. The methodology has been described in detail elsewhere.1-4 In brief, the MDA 180 uses a variable wavelength photo-optical detection system and can chart and quantify changes in light transmission when the plasma clots after activation and recalcification. Normal and biphasic waveforms at 580 nm are illustrated in Figure 1. A biphasic profile occurs when light transmission decreases before clot formation in the first part of the curve. To quantitate this abnormality, light transmission at time 0 was set to 100%, and the value recorded 18 seconds later (TL18) was taken as the index of the abnormality. As the MDA 180 blanks each specimen individually, accurate comparisons can be made between specimens. Normal range determination studies on 20 healthy volunteers (that is, persons without BPW) showed a mean TL18 value of 100% (99.43%-100.69%), with a mean coefficient of variation of 0.15%.
Optical profiles measured during APTT coagulation assays in normal and BPW-positive plasma.
Profiles from normal plasma (○) and plasma with a biphasic waveform (▵) and the same sample with the thrombin inhibitor hirudin (■) in the APTT assay with the Organon Teknika MDA coagulation analyzer. Solid traces are the optical waveforms. Symbols are included only to differentiate the samples.
DIC
The diagnosis was in accordance with the Japanese Ministry of Health and Welfare 1988 criteria that are the basis of the International Society of Thrombosis and Hemostasis Standardization Subcommittee definition.6 The underlying disorder, clinical condition, and laboratory results (platelet count [PT], fibrinogen, D-dimer) were scored (maximum 13, minimum 0). A score of 7 or above established the diagnosis of DIC. PT, fibrinogen, and D-dimers were measured on the MDA 180 using Simplastin S, Fibriquik, and MDA D-dimer latex particle-based immunoassay, respectively. A random sample of D-dimer results, cross-checked with those determined using Nycocard (Nycomed Pharma AS, Oslo, Norway), agreed closely. Platelet counts were performed on EDTA anticoagulated blood on the Coulter STKS (Coulter Electronics, Luton, United Kingdom).
Statistical analysis
APTT waveform values (TL18) and D-dimer levels in the first hour of admission were respectively measured against DIC development using nonlinear regression analysis with a 3-parameter logistic model fitted to the data.13 The outcome association with TL18 was later contrasted with CRP levels alone and triglyceride (TG) measurements alone, in the same cohort of samples. All calculations were performed using S-PLUS 2000 (MathSoft, Seattle, WA).
Results
Biphasic waveform is due to the Ca++-dependent precipitation of a complex of VLDL and CRP
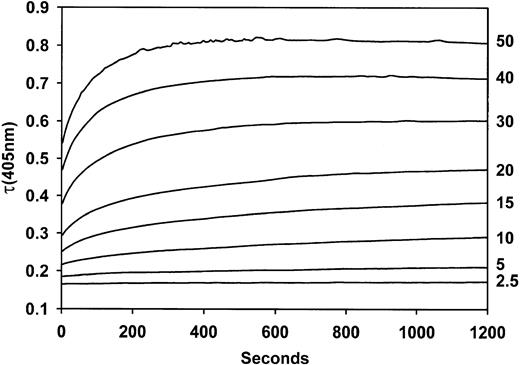
Studies were undertaken to identify the mechanism responsible for the BPW. The formation of a precipitate when Ca++ was added to plasmas of patients showing the BPW was visually obvious. This occurred even with the thrombin inhibitor hirudin (Figure 1). The turbidity change when Ca++ is added to positive samples in the presence of a thrombin inhibitor formed the basis of an assay. Time courses of turbidity, as measured in a plate reader, are shown in Figure 2. The maximum extent of turbidity change increased with increasing proportions of BPW-positive plasmas in the assay. The assay was standardized by the relation between turbidity and the content of positive plasma.
Turbidity changes over time when mixtures of BPW and normal plasma are recalcified.
Values at the right are volumes (μL) of BPW plasma in a total plasma volume of 50 μL.
Turbidity changes over time when mixtures of BPW and normal plasma are recalcified.
Values at the right are volumes (μL) of BPW plasma in a total plasma volume of 50 μL.
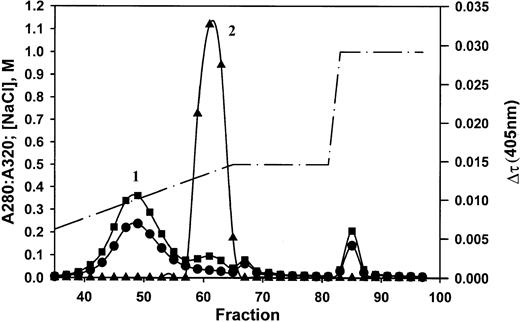
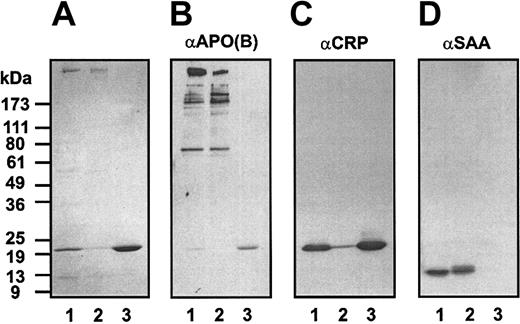
Precipitated, washed material consisted of protein, phospholipids (31%), cholesterol (10%), and triglycerides (50%) in proportions typical of very-low–density lipoproteins. The material was dispersed in citrate and subjected to anion exchange chromatography (Figure 3). Two major peaks were obtained, the first of which was very turbid (absorbance at 320 nm). Activity (turbidity formation in a mixture of the sample and normal plasma on recalcification) was exhibited only by the material in peak 2. SDS-PAGE, immunoblotting, and amino acid sequence analysis showed that the starting material contains proteins with apparent molecular masses of 500 kDa, 22 kDa, and 10 kDa (Figure 4A). Sequence analysis identified the 22-kDa protein as C-reactive protein, starting at residue 19.14 The 10-kDa protein gave 2 sequences, consistent with serum amyloid A species, respectively, beginning with amino acids 19 and 20.15 Although the 500-kDa species did not yield a sequence, its high molecular weight was consistent with apolipoprotein B-100, the major protein component of VLDL.16 After fractionation, the high molecular weight band and SAA were obtained in peak 1, and CRP was obtained in peak 2. Immunoblotting (Figure 4B-D) identified the 500-kDa material as Apo B-100 (Figure 4B), the 22-kDa material as CRP (Figure 4C), and the 10-kDa material as SAA (Figure4D). The starting material, but not isolated peak 1 or peak 2 components, formed a precipitate in buffer when recalcified. The mixture of peaks 1 and 2, however, did form a precipitate (data not shown). Thus, VLDL and CRP minimally are required to form the precipitate. This procedure was repeated with at least 10 different positive plasmas. Occasionally, SAA was not recovered in the isolated peaks. Thus, SAA can be included in the precipitate but is not necessary for its formation.
Anion exchange chromatography of isolated, precipitated material.
Absorbances at 280 nm (▪) and 320 nm (●) and the NaCl concentration in the gradient (dashed line) are indicated by the units on the left vertical axis. Turbidity changes assayed in normal plasma (▴) are indicated by the units on the right vertical axis. Peak 1 was cloudy as indicated by the high absorbance at 320 nm. Peak 2 contains C-reactive protein.
Analysis of the isolated precipitate before and after anion exchange chromatography.
The starting material and materials recovered in peaks 1 and 2 (Figure3) were analyzed by nonreducing SDS-PAGE (A) and by immunoblotting for Apo B-100 (B), CRP (C), and SAA (D). Lanes 1 to 3 were loaded with the starting material, peak 1 material, and peak 2 material, respectively.
Turbidity changes associated with recalcified mixtures of CRP and normal lipoprotein classes of human plasma
The lipoprotein classes VLDL, IDL, LDL, and HDL, isolated from a sample of normal human plasma, were mixed with CRP isolated from patient plasma. Turbidity changes were measured after recalcification in buffer. Of the total change that occurred in plasma, 63% could be attributed to the VLDL fraction, 25% to the IDL fraction, and 5% and 6%, respectively, to the LDL and HDL fractions. Although normal plasma supplemented with CRP exhibited a strong turbidity change, the lipoprotein-deficient plasma exhibited no change.
Characterization of the interaction between purified VLDL and CRP
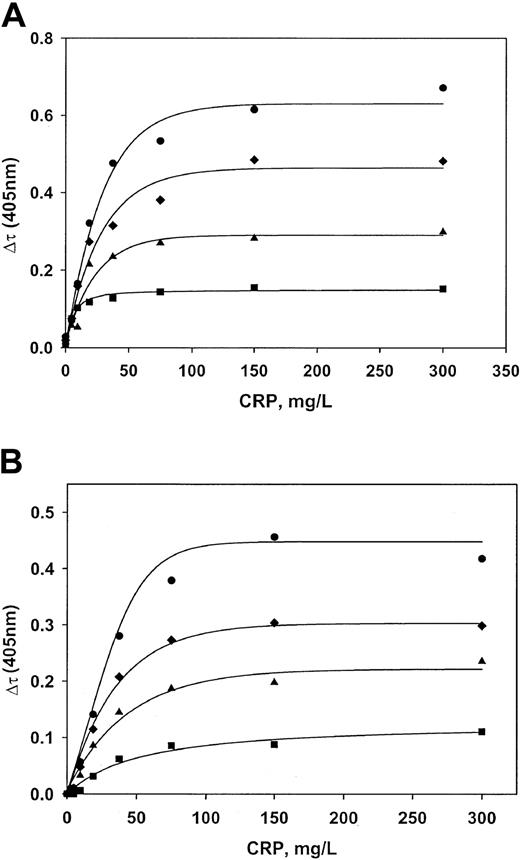
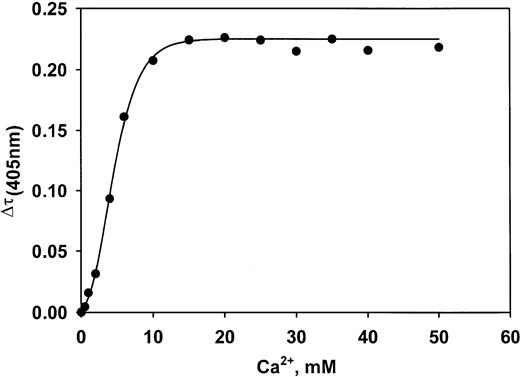
Commercially available human VLDL was supplemented with recombinant CRP. Ca++ was then added, and the subsequent turbidity changes were measured. An approach to saturation was obtained in buffer and in lipoprotein-deficient plasma as the CRP level was increased at all 4 concentrations of VLDL (Figure5A-B). The Kd value for the interaction between CRP and VLDL in buffer is 340 nM (7.5 mg/L). The stoichiometry is such that 178 mg CRP bound per liter is needed to saturate 1 mM VLDL (cholesterol concentration). In lipoprotein-deficient plasma, Kd is 440 nM, and the stoichiometry is 343 mg CRP/L per 1 mM VLDL cholesterol. The interaction is Ca++ dependent. The half-maximal extent of complex formation occurs at a Ca++ concentration of 5.0 mM (Figure 6). Complex formation was completely inhibited by 10 mM phosphorylcholine (data not shown).Epsilon aminocaproic acid inhibited formation with an IC50 value of 2.1 mM (not shown).
Characterization of the interaction between CRP and VLDL.
Recombinant CRP and normal plasma VLDL were mixed at various concentrations in buffer (A) and lipoprotein-deficient plasma (B). Maximum turbidity changes were then recorded after adding Ca++. VLDL concentrations (measured as cholesterol) were 0.030 mM (▪), 0.065 mM (▴), 0.100 mM (♦), and 0.150 mM (●). Lines are regression lines resulting from fitting the data to the equations described in “Patients, materials, and methods.”
Ca++ concentration dependence of formation of the VLDL–CRP complex.
Complex formation is half-maximal at 5.0 mM Ca++.
Ca++ concentration dependence of formation of the VLDL–CRP complex.
Complex formation is half-maximal at 5.0 mM Ca++.
Correlation between the concentrations of CRP and VLDL in several patient plasmas and the extent of complex formation on the addition of Ca++
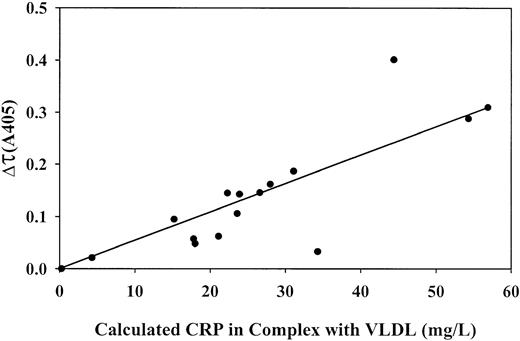
Levels of CRP and VLDL and turbidity changes on recalcification were determined in 15 BPW-positive plasmas (Table1). CRP levels were highly elevated in all patients (77 to 398 mg/L; normal, 1.3 mg/L). VLDL levels ranged from 0.082 to 1.32 mM cholesterol (normal, 0.389 mM). The concentrations of CRP in complex with VLDL after recalcification of the plasmas were calculated using equation 2, shown in “Patients, materials, and methods,” and the dissociation constant and stoichiometry for complex formation found in lipoprotein-deficient plasma supplemented with purified CRP and VLDL (Figure 5B). These values ranged from 24 to 254 mg bound CRP/L (Table 1). A reasonably linear correlation was found between these values and the magnitude of the absorbance change (Figure7), which indicates that the absorbance change was indeed caused by CRP–VLDL complex formation.
Turbidity changes and plasma concentrations of total CRP, total VLDL, and calculated levels of CRP in complex with VLDL from 15 patients with positive BPW
| Patient . | Total CRP (mg/L) . | VLDL cholesterol (mM) . | Calculated CRP in complex (mg/L) . | Turbidity Δτ405 . |
|---|---|---|---|---|
| 1 | 266 | 1.327 | 254 | 0.290 |
| 2 | 398 | 0.292 | 97 | 0.145 |
| 3 | 219 | 0.316 | 100 | 0.062 |
| 4 | 342 | 0.248 | 80 | 0.048 |
| 5 | 294 | 0.498 | 159 | 0.033 |
| 6 | 323 | 0.204 | 67 | 0.095 |
| 7 | 355 | 0.810 | 254 | 0.288 |
| 8 | 314 | 0.389 | 127 | 0.162 |
| 9 | 361 | 0.627 | 203 | 0.401 |
| 10 | 220 | 0.260 | 84 | 0.057 |
| 11 | 387 | 0.414 | 137 | 0.187 |
| 12 | 274 | 0.339 | 110 | 0.143 |
| 13 | 212 | 0.423 | 130 | 0.146 |
| 14 | 274 | 0.333 | 108 | 0.106 |
| 15 | 77 | 0.082 | 24 | 0.021 |
| NHP | 1.3 | 0.389 | 1.2 | 0 |
VLDL is the average value, normalized to cholesterol, based on measured levels of cholesterol, ApoB-100, and total protein in the VLDL fraction. CRP in complex was calculated using equation 2 in “Patients, materials, and methods” and parameters for the interaction between CRP and VLDL in lipoprotein-deficient plasma (Kd = 9.63 CRP [mg/L]; n = 343 CRP [mg/L]/mM VLDL cholesterol). NHP indicates normal human plasma.
Correlations between the level of CRP in complex with VLDL and the turbidity change on recalcification of patient plasma samples.
Total concentrations of CRP and VLDL (cholesterol) in 15 patient plasma samples and 1 normal plasma pool sample were measured. CRP level in complex was calculated using the parameters for complex formation measured in lipoprotein-depleted normal plasma, supplemented with normal VLDL and recombinant CRP. The absorbance change at 405 nm (turbidity) was measured 20 minutes after the addition of CaCl2 and the thrombin inhibitor PPACK to the samples. CRP concentrations on the horizontal axis take into account a 4-fold dilution of plasma that is made for the turbidity measurement.
Evidence for the existence of CRP–VLDL complex in the sera of patients with biphasic waveform
These experiments were performed to identify the complex in the sera of blood not exposed to the anticoagulant. CRP was detected by ELISA in VLDL isolated from untreated sera of patients with BPW (Table2). Prior chelation of Ca++in the sample led to a loss of detectable CRP in all patients examined. Likewise, prior incubation with additional Ca++ led to enhanced detection of CRP within the VLDL fraction. VLDL from healthy volunteers did not have detectable CRP, and patients with high CRP without BPW had no recoverable VLDL (data not shown). From these observations, we conclude that the complex does exist to a measurable extent in the blood of patients whose plasma exhibits BPW.
CRP in VLDL fractions from untreated, EDTA-treated, and calcium-treated samples of serum from patients with positive BPW
| Patient . | Serum CRP (mg/L) . | VLDL fraction . | VLDL fraction plus EDTA . | VLDL fraction plus Ca2+ . | |||
|---|---|---|---|---|---|---|---|
| Total CRP . | CRP/mM Trig . | Total CRP . | CRP/mM Trig . | Total CRP . | CRP/mM Trig . | ||
| 1 | 323 | 14.3 | 1.29 | 1.3 | 0.08 | 160 | 21.92 |
| 2 | 281 | 18.6 | 4.04 | 1.1 | 0.15 | 172 | 40.95 |
| 3 | 264 | 4.2 | 1.17 | 0.9 | 0.12 | 157 | 50.70 |
| 4 | 218 | 21.5 | 9.77 | 2.2 | 0.85 | 157 | 112.14 |
CRP levels were measured in the VLDL fraction isolated from serum. Measurements were also determined on samples from sera supplemented with either EDTA or Ca2+.
Prothrombinase supporting activity of patient and normal isolated VLDL
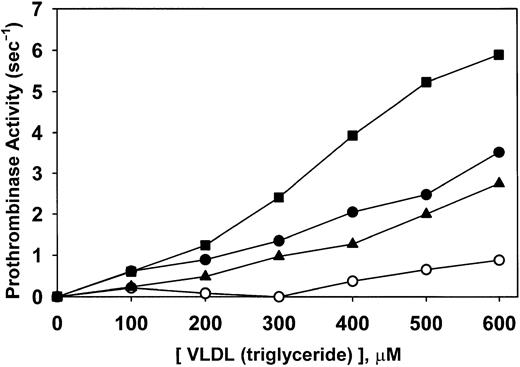
Rates of thrombin formation were determined at numerous concentrations of normal VLDL and the VLDL from 3 patients with a biphasic transmittance waveform. The results (Figure8) indicated that VLDL from patients was more potent in supporting prothrombinase activity than VLDL in healthy volunteers. Slopes of the relationships depicted in Figure 8 indicated that the 3 patients' VLDL levels were 3.3-, 4.1-, and 7.8-fold more potent than normal VLDL. These data suggest that patient VLDL is qualitatively different from normal VLDL in a way yet to be determined. The difference is magnified when the comparison is made, not on the basis of the triglyceride contents of the VLDL but on the concentration of VLDL in plasma. Calculated the latter way, the 3 respective patient plasma VLDL levels supported prothrombinase activity 5.2-, 6.0-, and 9.0-fold more potently than VLDL from healthy volunteers. Interestingly, added C-reactive protein did not affect the results (data not shown).
Prothrombinase-supporting activity of patient and normal isolated VLDL.
Rates of thrombin formation were determined at numerous concentrations of isolated normal VLDL (○) and VLDL from 3 patients with biphasic transmittance waveform. VLDL concentrations were measured as triglycerides. A qualitative difference in potency (prothrombinase activity/VLDL) is observed in these data in that the respective patient specimens were 3.3 (▴), 4.1 (●), and 7.8 (▪) times more potent than normal VLDL (○).
Biphasic waveform on ITU admission predicts for DIC
A 24-month prospective clinical study of 1187 consecutive patient admissions to the ITU was carried out concurrently with the purification studies. A biphasic waveform (BPW)—that is, a TL18 value less than 99%, was present in 346 (29%) patients on admission to the ITU. The presence of the abnormality in the waveform pattern was, as reported previously,3 4 independent of the APTT clotting time and not influenced by concurrent anticoagulant therapy. Another 412 patients subsequently acquired BPW during their ITU stay. Overall, 758 (64%) of the patients had a BPW at some time during the course of their intensive care stay.
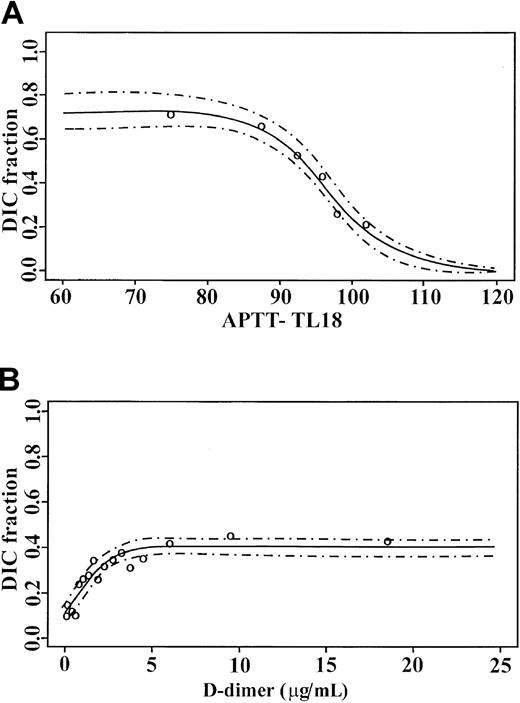
DIC occurred in 362 (30%) patients, with sepsis as the most common primary cause. Three hundred thirty-six (93%) of these patients had BPW during their ITU period. The 26 patients without BPW, but with DIC as determined by conventional criteria, were recovering without complication from primarily major spinal procedures. Analysis of the APTT-TL18 admission values in all patients with respect to the development of overt DIC is as shown in Figure9A. A close fit was seen between observed and predicted values with a narrow 95% confidence interval. In the absence of BPW, the fraction of patients with diagnoses of DIC was 0.21 with a stepwise increase in the patient fractions as the degree of abnormality increased. With a 25% reduction in TL18, this reached 0.76. By comparison, D-dimer, an established marker of DIC, showed a DIC fraction of 0.1 at undetectable D-dimers, to a maximal association of 0.4 for D-dimer values of 5 μg/mL and above in the same cohort of patients (Figure 9B).
Logistic regression analysis models for admission.
(A) APTT TL18 values and (B) D-dimer measurements against DIC prediction. ○ represents the observed fractions, and the 95% confidence limits are indicated by dashed lines.
Logistic regression analysis models for admission.
(A) APTT TL18 values and (B) D-dimer measurements against DIC prediction. ○ represents the observed fractions, and the 95% confidence limits are indicated by dashed lines.
Biphasic waveform can identify DIC at an early and nonovert stage
One hundred thirteen of 336 (34%) patients had a BPW preceding DIC diagnosis by an average of 18 hours (range, 2 to 47 hours). At the time of the first biphasic abnormality, 66 of 113 patients also had isolated prolongation in the prothrombin time, and 8 of 113 had thrombocytopenia. Forty-two of 113 (37%) patients had no concurrent abnormality. The mortality rate in this pre-DIC group was 58% (68 of 113), equivalent to the overall DIC mortality rate of 56% (202 of 362). Thus, this group is not selectively different in prognosis. In this pre-DIC group, 55 of 113 (49%) patients had sepsis. Of these 55, 17 (31%) patients had the waveform as the only change before the diagnosis of DIC.
Biphasic waveform better predicts DIC than measurements of CRP and triglyceride
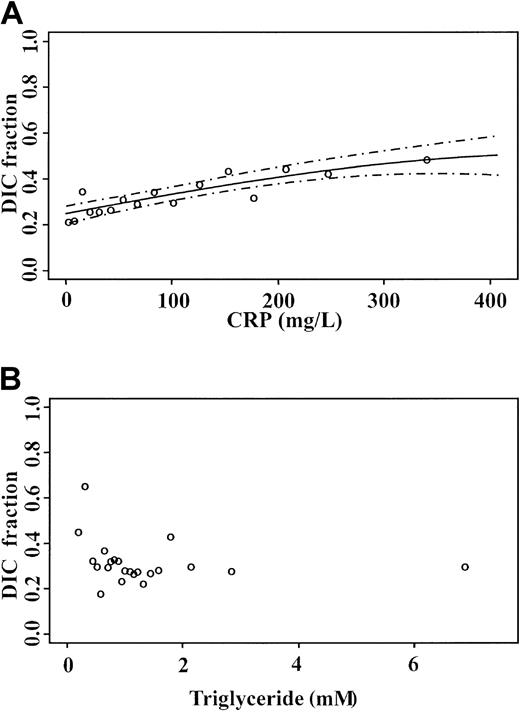
Following the identification of CRP, an established marker of inflammation, as a component of the complex underlying the BPW, it was important to determine whether CRP levels alone provided information similar to that of the BPW. Logistic regression of admission CRP values for DIC prediction is shown in Figure10A. The most elevated results were associated with 0.46 of DIC patients, compared with 0.76 with TL18 determined by APTT waveform analysis. Comparison with triglyceride measurements in the same samples, as a marker of VLDL, showed that triglyceride levels do not allow for the prediction of DIC (Figure 10B). This suggests that the BPW provides information in addition to that obtained through measurements of CRP and triglyceride alone.
Logistic models for DIC prediction:
(A) CRP and (B) triglyceride measurements on admission to the ITU. Open circles are observed fractions; dashed lines indicate 95% confidence limit.
Logistic models for DIC prediction:
(A) CRP and (B) triglyceride measurements on admission to the ITU. Open circles are observed fractions; dashed lines indicate 95% confidence limit.
Discussion
Initial reports of Downey et al,3,4 which indicated an association between the BPW and DIC in intensive care patients, suggest a strong potential for use of the BPW for prognosis and temporal assessment of patient status. This motivated the biochemical and clinical investigations reported here. With respect to diagnosis, the initial association with DIC was extended by demonstrating the ability of the BPW to assign risk from the first admission sample to the intensive care unit. It better predicts impending DIC than D-dimer, an established marker of this condition.6,17 The BPW also often recognizes DIC at an early, nonovert stage. Its simplicity and rapidity of performance within a frequently requested test for assessing coagulation in the ITU setting—that is, the APTT—allows the optimization of therapeutic intervention in aborting what otherwise is a serious complication of diseases frequently encountered in an ITU setting. For example, in sepsis, the most common cause of DIC in this cohort, recombinant human activated protein C treatment has been shown to improve overall survival.18 Moreover, waveform analysis can be easily repeated for monitoring purposes because quantification of the degree of abnormality provides an index of whether the patient is improving or deteriorating in response to therapy.
Precipitates isolated from 10 patients with BPW contained CRP and apoB-100. Some, but not all, also contained SAA. No isolates contained other proteins such as, for example, soluble fibrin, which might be hypothesized as potential components of the precipitate.19Another 15 samples analyzed for the magnitude of the turbidity change on recalcification showed that the CRP levels were very high compared with normal levels. By this criterion, all these patients were experiencing an acute-phase response. VLDL levels varied from below normal to above normal. Because the magnitude of the turbidity change in these samples correlated well with the calculated level of the VLDL–CRP complex, the turbidity change and the BPW can be concluded to have resulted from the formation of the complex.
CRP forms pentamers in the presence of Ca++ and belongs to a family of proteins known as pentraxins.14,20,21 It is ubiquitously distributed and highly conserved in nature.22Although its normal level in healthy persons is approximately 1.0 mg/L, this level rapidly increases to several hundred milligrams per liter under conditions of infection or tissue damage.23 Thus, it is an excellent marker of, and helps to define, the acute-phase response. Although CRP was first recognized 72 years ago,24 its physiological role is not known to date. A link to inflammation, however, is suspected because of its ability to opsonize some microorganisms and to contribute to the activation of complement.25,26 In addition, a link to atherosclerosis and cardiovascular disease has been strongly suggested.27-30
Interactions between CRP and normal or modified lipoproteins have been described by others, but not in the contexts we have described. Cabana et al31 showed that rabbit CRP binds to VLDL in a Ca++-dependent manner. In the rat, CRP was shown to interact with serum components containing apolipoproteins E and A1.32 The interaction is Ca++ dependent and is inhibited by O-phosphorylethanolamine, a compound that tightly binds specifically to rat CRP. Bhakdi et al33showed that when LDL is modified by exposure to a combination of trypsin, cholesterol esterase, and neuraminidase, it binds CRP and has complement-activating activity.33 They proposed that LDL within the vessel wall could be enzymatically modified to a form that binds CRP and thereby activates complement, an event that might contribute to atherosclerosis.
The Ca++-dependent formation of the CRP–VLDL complex explains why its formation can be detected by an increase in turbidity on the recalcification of plasma samples prepared from blood collected into citrate as the anticoagulant. The complex likely would be present in vivo, though complex formation would not be optimized at the normal physiologic free Ca++ concentration (approximately 2.5 mM). Indeed, we show that CRP is present in the VLDL fractions extracted from the serum of these patients that had not been manipulated by chelation and recalcification.
The biphasic transmittance waveform depends on a substantially elevated level of CRP and levels of VLDL or IDL adequate to rapidly form a macroscopic precipitate on recalcification. Although the complex, as measured by the BPW, correlates well with DIC, the level of CRP alone does not predict DIC nearly as well. In addition, triglyceride levels alone, as a measure of VLDL, do not predict DIC.
Whether the CRP–VLDL complex contributes to, or merely reflects, DIC is a question that arises. That it might contribute to the hemostatic dysfunction of DIC is plausible, because lipoproteins have been shown to provide the equivalent of the phospholipid component in the activation of prothrombin.34 35 In addition, our studies suggest that the VLDL of some patients is qualitatively and quantitatively more active as a surface for prothrombin activation than normal VLDL. This might contribute to enhanced thrombin generation and thereby to DIC.
In summary, our work shows that the biphasic transmittance waveform observed in certain plasmas subjected to recalcification in coagulation assays can be attributed to the rapid formation of a Ca++-dependent, macroscopic complex between CRP and VLDL. Its formation correlates well with DIC in patients in intensive care, and its measurement has the potential to be useful for prognosis and diagnosis and for monitoring therapy. In addition, the complex might contribute to the underlying disease process in DIC.
We thank Nicole Robin and Jerome McCann of the Intensive Care Unit and Diane Hargreaves of the Haematology Laboratory in Liverpool for their invaluable assistance. We also thank Timothy Fischer for numerous fruitful discussions on biphasic waveform analysis.
Supported by The National Institutes of Health (PHSHL 46 703), The Canadian Institutes of Health Research (MT9781), The Ontario Heart and Stroke Foundation (T-2631 and T-4408), and bioMérieux.
Several of the authors (L.O.T., G.J., W.H., and A.G.) are employed by Organon Teknika Corporation, whose product was studied in the present work.
The publication costs of this article were defrayed in part by page charge payment. Therefore, and solely to indicate this fact, this article is hereby marked “advertisement” in accordance with 18 U.S.C. section 1734.
References
Author notes
Michael Nesheim, Department of Biochemistry, Queen's University, Botterell Hall, Room A210, Kingston, ON, Canada K7L 3N6; e-mail: nesheimm@post.queensu.ca.

This feature is available to Subscribers Only
Sign In or Create an Account Close Modal