Rituximab, a chimeric human immunoglobulin G1(IgG1) anti-CD20 monoclonal antibody has been shown to mediate cytotoxicity in malignant B cells via several mechanisms in vitro. These include direct antiproliferative and apoptotic effects, complement-dependent cytotoxicity (CDC), and antibody-dependent cell-mediated cytotoxicity (ADCC). Glucocorticoids (GCs) are often administered in conjunction with rituximab in chemotherapeutic regimens or as premedication to reduce infusion-related symptoms. The effects of GCs on CDC and ADCC, and the direct apoptotic and antiproliferative effects of rituximab are unknown. Therefore, we evaluated these mechanisms in 9 B-cell non-Hodgkin lymphoma (B-NHL) cell lines using rituximab and GCs. Rituximab and dexamethasone induced synergistic growth inhibition in 6 B-NHL cell lines. Dexamethasone and rituximab induced significant G1 arrest in 9 of 9 cell lines. The combination of rituximab and dexamethasone resulted in supra-additive increases in phosphatidylserine exposure and hypodiploid DNA content in 5 and 3 B-NHL cell lines, respectively. CDC and ADCC were neither impaired nor enhanced when dexamethasone and rituximab were administered concurrently. However, preincubation of both effector and tumor cells with dexamethasone reduced specific lysis in ADCC assays in 4 B-NHL cell lines. Preincubation of tumor cell lines with dexamethasone significantly increased cell sensitivity to CDC in 3 B-NHL cell lines. We conclude that the addition of dexamethasone to rituximab results in supra-additive cytotoxicity with respect to its direct antiproliferative and apoptotic effects, induces a cell-dependent increased sensitivity to rituximab-induced CDC, and has minimal negative impact on ADCC when used simultaneously with rituximab.
Introduction
Rituximab is a chimeric human immunoglobulin G1 (IgG1) anti-CD20 monoclonal antibody that mediates cytotoxicity against CD20+ malignant B cells by several mechanisms in vitro, although the predominant mechanism in vivo remains unknown. Rituximab is more efficient in activating complement-dependent cytotoxicity (CDC) and antibody-dependent cell-mediated cytotoxicity (ADCC) in vitro compared with the parent murine IgG1 monoclonal anti-CD20 antibody, 2B8.1 This appears to be due to more effective interaction of the human IgG1 isotype with the human Fc-gamma receptor and complement components. Rituximab treatment also results in direct apoptotic and antiproliferative effects through binding of CD20 in some malignant B-cell lines.2-4 Ligation of CD20 may result in intracellular alterations, including a rise in calcium, activation of serine/threonine protein tyrosine kinases, increased tyrosine phosphorylation, caspace activation, poly (ADP-ribose) polymerase (PARP) cleavage, and apoptosis.2,5 6
Glucocorticoids (GCs) are cytotoxic against malignant B cells and have been included in treatment regimens that predate chemotherapy. GCs are known regulators of gene expression and GC receptors (GRs) are ligand-activated transcription factors. The activated GR may mediate its effects by repressing transcription of genes necessary for cell survival or, conversely, by up-regulating gene transcription of factors involved in cell death.7 GCs have been shown to cause growth inhibition, cell cycle arrest, and apoptosis in several normal and malignant cell types.8-10 Overexpression of bcl-2 inhibits the apoptotic cascade and may induce GC resistance.11 12
The influence of GCs on the antitumor activity of rituximab is highly relevant for 2 reasons. First, GCs have independent anti–B-cell lymphoma activity and are included in the majority of treatment regimens being tested in combination with rituximab. Second, GCs have known inhibitory effects on the immune effector mechanism ADCC, a significant participant in rituximab's antitumor effect. Specifically, GC exposure results in reduced natural killer cell quantity, cytotoxicity, and binding to target cells.13 14
We first evaluated the effects of GCs and rituximab on cell proliferation and survival. We demonstrate that GC and rituximab treatment results in synergistic growth inhibition and apoptosis of human B-cell non-Hodgkin lymphoma (B-NHL) cell lines in vitro. We also evaluated GC effects on the in vitro immune effector mechanisms thought to be active in rituximab therapy, including ADCC and CDC. We found that concurrent treatment with GCs did not enhance or impair rituximab-induced ADCC or CDC in malignant B-cell lines. However, pretreatment of lymphoma cells with GCs increased cell sensitivity to complement-mediated lysis in 3 of 9 B-NHL cell lines. In contrast to CDC, ADCC was impaired following pretreatment of both the effector and target cells with dexamethasone for 48 hours in 4 cell lines.
Materials and methods
Cell lines and cell culture
CD20-expressing human non-Hodgkin lymphoma cell lines DHL-4, FL-18 (transformed follicular NHL that progressed to diffuse large B-cell NHL), OCI Ly8 (large B cell, immunoblastic), Ramos, Daudi (Burkitt lymphoma), and Tab (large B cell) were a gift from Ron Levy. Raji (Burkitt lymphoma), were a gift from Dana Matthews. Mantle cell lymphoma cell lines Granta 519 and NCEB-1 were a gift from Elliott Epner.15 16 Cells were maintained in RPMI 1640 with 2 mMl-glutamine (BioWhittaker, Walkersville, MD), supplemented with 10% heat-denatured (56°C for 60 minutes) bovine calf serum (HyClone, Logan, UT), and 100 U/mL penicillin and streptomycin (Gibco BRL, Grand Island, NY). Cells were incubated at 37°C with 5% C02 and maintained in log growth phase. On the day of use, cells were counted by means of a hemocytometer following standard trypan blue exclusion methodology and were used only if viability exceeded 90%.
In vitro cell proliferation assays and synergy analysis
Cell growth was measured by quantifying spontaneous DNA incorporation of [3H]thymidine. Dexamethasone was purchased from Sigma Chemical (St Louis, MO). C2B8 (rituximab) was kindly provided by IDEC Pharmaceuticals (San Diego, CA). RU-486, a glucocorticoid receptor antagonist, was purchased from Sigma. Cells (2.5 × 10⁴ cells per milliliter) were incubated for 96 hours at 37°C in triplicate with various doses of GCs and rituximab (0 to 10 μg/mL) in combination and individually. Assays were performed with RU-486 to confirm specificity of dexamethasone. In the final 24 hours, [3H]thymidine (1 μCi [0.037 MBq] per well) was added. Cells were harvested with a Packard Micromate 196 cell harvester, and [3H]thymidine incorporation was measured with a Packard Top Count Microplate Scintillation Counter (Packard Instruments, Meriden, CT).
By means of growth inhibition assays, dose-response curves for dexamethasone and rituximab, alone and in combination, for 9 malignant B-cell lines were developed. The dose-response curves (dexamethasone alone, dexamethasone with rituximab) were then normalized to the control by dividing the counts per minute in experimental samples by the control. This demonstrated the relative potency of dexamethasone alone and in combination with rituximab. When the relationship between the 2 drugs was additive, the combinations of both drugs at submaximal effective concentration resulted in similar cytotoxic effects, and the dose-response curves overlapped. When the combination of drugs were antagonistic, the curves (of drugs in combination) had a flatter slope requiring greater concentrations for similar effects. A synergistic relationship was observed when the dose-response curve was steeper and shifted to the left, consistent with a lower effective concentration for a given effect as well as greater maximum cytotoxicity.
Apoptosis assays
Apoptosis and cell cycle analysis studies were performed by means of flow cytometry. Annexin V conjugated to fluorescein isothiocyanate (FITC) (PharMingen International, San Diego, CA) and propidium iodide (PI) (Sigma) were used in combination as markers of both early and late apoptotic changes. Annexin V (AV) has a high affinity for the phospholipid phosphatidylserine, which is translocated to the extracellular leaflet of the cell membrane early in the apoptotic process. Cells progress from AV−/PI− to AV+/PI−to AV+/PI+ as they become apoptotic. Following exposure to dexamethasone, cells were washed and incubated with AV-FITC, PI (2 μg/mL), and binding buffer (140 mM NaCl, 2.5 mM CaCl, and 10 mM HEPES/NaOH, pH 7.4). Flow cytometry was performed on a fluorescent activated cell sorter (FACS) Calibur flow cytometer and analyzed by means of CellQuest software (Becton Dickinson, San Jose, CA).
Cell cycle and DNA fragmentation were evaluated by flow cytometry following permeabilization and staining with PI. Cells (0.5-1 × 10⁶ cells per condition) were washed following incubation with various agents, fixed by adding 4 mL ice-cold 95% ETOH dropwise with continuous vortexing, and placed on ice for 30 minutes. Cells were resuspended in 1 mL 1% bovine serum albumin (BSA) (Sigma)–phosphobuffered saline (PBS) (Life Technologies, Grand Island, NY), and washed and treated with 0.25% Triton X-100 (BioRad, Hercules, CA) for 5 minutes. Cells were then washed 3 times with 1% BSA-PBS. DNA was stained with the use of 500 μL 1% BSA-PBS, 100 μg/mL RNAse A (Sigma), and 20 μg/mL PI. Nuclear emitted fluorescence was measured, and the percentage of cells in each phase of the cell cycle was determined.
Complement-dependent cytotoxicity
CDC assays were performed with the use of human AB serum (Gemini Bio-products, Calabasas, CA) as the source of human complement. The effects of immediate and long-term exposure (72 hours) to dexamethasone (10 μM) were evaluated. Two methods of determining complement-mediated lysis were performed: flow cytometry using propidium iodide uptake as a measure of loss of cell membrane integrity, and standard chromium-release assays. Results in the 2 methods were consistent. Following exposure to complement and rituximab, cells were washed 3 times and resuspended in PI (1 μg/mL). Lysis was determined by means of flow cytometry following staining, and PI+ cells were defined as a percentage of total cells. In the long-term dexamethasone treatment experiments, cells were cultured for 72 hours at 37°C in the presence or absence of dexamethasone (1 to 10 μM). Cells were counted and viability was assessed prior to treatment with 5 μg/mL rituximab and AB serum at 30% dilution for 60 minutes. Controls included no additives, 5 μg/mL rituximab alone, and 30% AB serum alone. Cells were labeled with 51chromium (0.5 mCi/2 × 106 cells [18.5 mBq/5 × 106cells) for 1 hour at 37°C. Following labeling, cells were washed with Hanks balanced salt solution 5 times and plated. Controls were performed in triplicate while experimental conditions had 6 samples per condition. Maximum lysis was determined by adding 2% Triton X-100 solution to labeled cells. The 96-well plate was centrifuged at 400 rpm for 2 minutes at room temperature followed by a 1-hour incubation at 37°C. Supernatant was harvested by means of SCS harvesting frame filters and macrowell tube strips (Molecular Devices/Skatron, Sunnyvale CA). Radioactivity was measured by means of a gamma emission counter. The percentage of lysis was calculated by means of the following equation:
Experimental cpm was obtained from the supernatant of wells containing human serum, target cells, and antibody (or control wells without serum or antibody). Spontaneous cpm is the cpm in the supernatant from wells containing target cells (with or without rituximab alone). Maximum cpm is the supernatants of wells containing target cells and Triton X-100. Specific lysis was then calculated by means of the following equation:
Results are reported as specific lysis. The mean, SD, andP values were determined by means of the Studentt test for independent samples.
Effects of dexamethasone on complement-regulatory protein (CRP), C1q, CD20, and CD32 expression
Cell surface protein evaluation was performed by means of flow cytometry. We evaluated protein expression with and without dexamethasone exposure (72 hours, 1 to 10 μM) by means of specific labeled antibodies by direct staining. CD32 (Fcγ RII-a) (Becton Dickinson, San Jose, CA), CD59 (Caltag, Burlingame, CA), CD20 (2H7) (PharMingen), C1q (DAKO, Glostrup, Denmark), CD46, and CD55 (Immunotech, Marseilles, France) were used with appropriate isotype controls. Experiments were performed in triplicate 2 or 3 times. C1q binding was evaluated following 1-hour exposure to 5 μg/mL rituximab and 30% AB serum for 60 minutes. C1q assays controls included PBS, 5 μg/mL rituximab alone, and 30% AB serum alone.
ADCC assays
Unmodified human peripheral blood mononuclear cells were used as effector cells and 51chromium-labeled lymphoma cell lines as targets, in the presence of rituximab and dexamethasone. Heparinized peripheral blood mononuclear cells (PBMCs) were separated from whole blood following suspension in PBS at a 1:1 volume ratio and layering over Ficoll-Hypaque solution (density = 1.077 g/L) at room temperature. Cells were centrifuged for 30 minutes by means of a Beckman J6-MC centrifuge at 2000 rpm. The mononuclear layer was then resuspended in PBS and washed twice prior to viability assessment. Effector cells were used immediately or were cultured for 48 hours at 37°C in complete media with or without 10 μM dexamethasone. Experiments were also performed in which either the target lymphoma cells alone or the target cells and effector cells were exposed to dexamethasone (10 μM) for 48 hours prior to ADCC assays. Cells were counted and assessed for viability by means of trypan blue staining. Cells were suspended in media and plated with the effector-to-target ratio of 40:1. Target cells were labeled with 51chromium (0.5 mCi/2 × 106 cells [18.5 mBq]/5 × 106cells) for 1 hour at 37°C. Following labeling, cells were washed with Hanks balanced salt solution 5 times and plated. Controls were performed in triplicate while experimental conditions had 6 samples per condition. Controls included no antibody, no dexamethasone, no effector cells, and all combinations thereof. The 96-well plate was centrifuged at 400 rpm for 2 minutes at room temperature followed by a 4-hour incubation at 37°C. Supernatant was harvested by means of SCS harvesting frame filters and macrowell tube strips (Molecular Devices/Skatron). Radioactivity was measured with a gamma emission counter. The percentage of lysis was calculated by means of the following equation:
Experimental cpm was obtained from the supernatant of wells containing effector cells, target cells, and antibody. Spontaneous cpm is the cpm in the supernatant from wells containing target cells alone. Maximum cpm is the supernatants of wells containing target cells and Triton X-100. Specific lysis was then calculated by means of the following equation:
Results are reported in terms of specific lysis, with the mean, SD, and P values determined from 6 samples per condition by means of the Student t test for independent samples. All experiments were repeated at least twice.
Phenotype of PBMCs following dexamethasone exposure
Flow cytometry was used to analyze peripheral blood monocytes and natural killer cells. Cells were stained with fluorochrome-conjugated monoclonal antibodies and analyzed by means of 3-color flow cytometry. Natural killer (CD16+CD56+ and CD3−CD14−) and monocyte (CD14+CD3−) populations were identified with directly labeled antibodies.
Results
Dexamethasone and rituximab: effects on cell growth
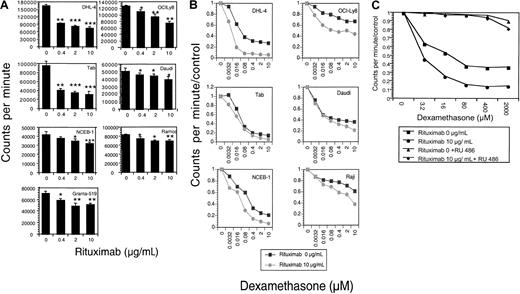
The effects of rituximab and dexamethasone, alone and in combination, on 9 malignant B-cell lines were evaluated. Rituximab incubation alone results in significant dose-dependent growth inhibition in 7 of 9 cell lines tested (Figure1A). The mean percentage of growth inhibition (of 3 to 5 experiments) at a saturating dose (10 μg/mL) of rituximab ranged from 18% to 83% (Table1). The combination of increasing doses of dexamethasone with rituximab resulted in synergistic growth inhibition for 6 NHL B-cell lines (Figure 1B; Table2). To prove that the observed growth inhibition from dexamethasone was mediated through the glucocorticoid receptor, experiments were done with the GC receptor antagonist RU-486. RU-486, as demonstrated with DHL-4 cells in Figure 1C, inhibited dexamethasone's effects, but did not alter the dose-dependent growth inhibition by rituximab (data not shown).
Growth inhibition.
(A) Growth inhibition by rituximab. The growth-inhibitory effect of rituximab on B-NHL cell lines was measured by means of a 96-hour growth assay by quantitating tritiated thymidine incorporation. Results are shown as counts per minute. Rituximab treatment (0 to 10 μg/mL) results in dose-dependent growth inhibition in these 7 B-NHL cell lines. P values are 2 sided, comparing the treatment group with the control for 3 samples, obtained from the Student ttest of independent samples: *P < .05; **P < .01; ***P < .001. This figure is representative of at least 3 experiments. (B) Growth inhibition by rituximab and dexamethasone. Dexamethasone dose-response curves in the presence of rituximab were evaluated by means of growth inhibition assays. Results are expressed as counts per minute divided by control. In 6 malignant B-cell lines, the dexamethasone dose-response curve is steeper and/or shifted to the left in the presence of rituximab, suggesting synergistic growth inhibition between the 2 agents. This figure is representative of at least 3 experiments. (C) Growth inhibition by dexamethasone is inhibited by RU-486. Growth inhibition of dexamethasone alone (▪); dexamethasone with rituximab (●); dexamethasone and RU-486 (▴); and dexamethasone, rituximab, and RU-486 (♦) is shown. RU-486 does not inhibit the dose-dependent growth inhibition by rituximab alone.
Growth inhibition and apoptosis due to rituximab alone
| Cell line . | Growth inhibition, % . | P . | Rituximab, % annexin V+ cells . | Rituximab-induced sub-G1DNA . |
|---|---|---|---|---|
| DHL-4 | 54 | < .0001 | 23 | Weak |
| Daudi | 24 | .025 | 13 | Weak |
| FL-18 | 17 | NS | 12 | No |
| Granta 519 | 20 | .005 | 7 | No |
| NCEB-1 | 30 | .002 | 7 | No |
| OCI Ly8 | 42 | .003 | 5 | No |
| Raji | 13 | NS | 12 | No |
| Ramos | 18 | .002 | 7 | No |
| Tab | 83 | .0001 | 17 | Weak |
Columns 1 and 2 demonstrate the percentage of growth inhibition induced by saturating doses of rituximab (10 μg/mL) and the corresponding P values, derived from 3 or more separate experiments. Growth inhibition was calculated as 1 − experimental CPM divided by control CPM, and growth inhibition was reported as a percentage with the highest (least significant) Pvalue. Two cell lines, FL-18 and Raji, had insignificant growth inhibition, whereas in all other cell lines, growth inhibition was highly statistically significant. Column 3 summarizes the mean percentage of cells (taken from at least 3 experiments) that become annexin V+ (minus control) following treatment with 48 hours of rituximab (10 μg/mL). Results range from 5% to 23% of cells. Column 4 summarizes the effects of rituximab alone on DNA fragmentation. Three cell lines, following exposure to rituximab (10 μg/mL) for 72 hours, have weak, but reproducible and statistically significant, increases in sub-G1 DNA content.
NS indicates not significant.
Synergistic effects of dexamethasone and rituximab
| Cell line . | Synergistic growth inhibition . | % annexin V+cells . | Supra-additive sub-G1 DNA . | Supra-additive G1 arrest . |
|---|---|---|---|---|
| DHL-4 | 21 | 38* | Yes | Yes |
| Daudi | 13 | 25* | Yes | No |
| FL-18 | −2 | 34 | No | No |
| Granta 519 | 7 | 9 | No | Yes |
| NCEB-1 | 10 | 14* | No | Yes |
| OCI Ly8 | 31 | 8 | No | No |
| Raji | 25 | 7 | No | No |
| Ramos | 2 | 14* | No | No |
| Tab | 14 | 57* | Yes | Yes |
Synergistic growth inhibition is shown in the first column. The percentage increase in the growth inhibition is calculated as cpm/control (dexamethasone)—cpm/control (combination dexamethasone and rituximab). The higher the percentage, the greater the synergistic effect. Column 2 shows the mean percentage of early apoptotic cells that become annexin V+ (minus control) following treatment with 10 μg rituximab and 10 μM dexamethasone for 48 hours. This is the mean of 3 or more experiments. The asterisk indicates that supra-additive early apoptosis occurs in 5 cell lines. Column 3 shows supra-additive DNA fragmentation that is observed in 3 malignant B-cell lines following treatment with combined dexamethasone and rituximab. Column 4 shows that supra-additive G1 arrest is observed in 4 malignant B-cell lines.
To determine if drug administration sequence may result in sensitization of tumor cells, growth inhibition assays were performed by pretreating cells with doses of dexamethasone (or rituximab) for 48 hours followed by increasing doses of rituximab (or dexamethasone) for 96 hours. Results show that both rituximab and dexamethasone reduce the median effective dose of the other agent by 50% to 60%. A pretreatment sequence of rituximab followed by dexamethasone, or the reverse, did not result in significantly greater growth inhibition than the other approach.
Dexamethasone and rituximab: effects on cell cycle arrest and apoptosis
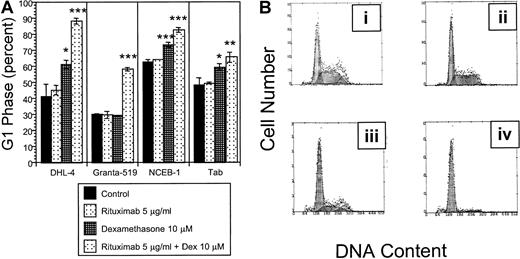
The growth inhibition observed in our initial experiments may be due to cell cycle arrest or apoptosis. Cell cycle analysis following 72 hours exposure to the combination of rituximab and dexamethasone demonstrates significant G1 arrest compared with the control in all 9 malignant B-cell lines tested. G1 arrest is supra-additive in 4 cell lines (DHL-4, Granta 519, NCEB-1, and Tab) with the combination of dexamethasone and rituximab (Figure2A; Table 2). Supra-additive G1 is defined as the sum of [(dexamethasone + rituximab in combination) − control] exceeding the sum of [(rituximab − control) + (dexamethasone − control)]. Supra-additive G1 arrest in DHL-4 cells is demonstrated in Figure 2B.
Cell cycle.
(A) Effects of rituximab and dexamethasone on cell cycle. Statistically significant G1 arrest is observed in all 9 B-NHL cell lines following treatment with combined dexamethasone (10 μM) and rituximab (5 μg/mL) for 72 hours when compared with control. This figure demonstrates that the percentage of cells in G1 phase following rituximab and dexamethasone treatment is supra-additive in 4 B-NHL cell lines. Error bars represent SD of the mean in one experiment. The asterisk represents significantP values compared with the control (*P < .05; **P < .01; ***P < .001). (B) Rituximab and dexamethasone induced cell cycle arrest in DHL-4 cells. DNA content is demonstrated by propidium iodide staining following permeabilization of cells after treatment with control (Bi), rituximab alone (5 μg/mL) (Bii); dexamethasone alone (10 μM) (Biii); and rituximab (5 μg/mL) and dexamethasone (10 μM) (Biv). The mean percentage of cells in G1 phase from 3 experiments in the 4 treatment groups are 41% (Bi); 45% (Bii); 61% (Biii), P = .01; and 88%, P = .0004 (Biv). P values are 2 sided, comparing the treatment group to the control for 3 samples, obtained from the Student t test of independent samples. This is representative of at least 2 experiments.
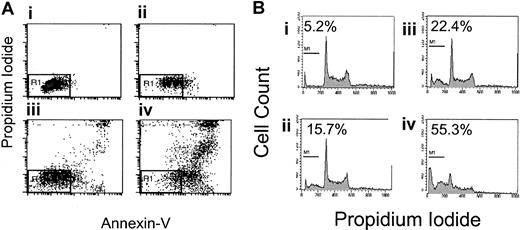
Because apoptosis may contribute to the observed growth inhibition, 2 flow cytometry assays were used to evaluate apoptosis, FITC–annexin V/PI staining and DNA fragmentation. Nine B-NHL cell lines were incubated with rituximab and dexamethasone, alone and in combination, without complement or crosslinking antibody for 48 hours. Seven of 9 B-NHL cell lines had statistically significantly increased the percentage of cells with phosphatidylserine exposure on the outer leaflet of the cell membrane following rituximab exposure alone, ranging from 5% to 23% (Table 1). In 5 B-NHL cell lines (Daudi, DHL-4, Ramos, Tab, NCEB-1), the addition of dexamethasone (10 μM) to rituximab (5 to 10 μg/mL) results in a supra-additive increase in phosphatidylserine exposure on the outer leaflet after 48 hours. An example using Tab cells is shown in Figure3A. These 5 cell lines all have synergistic growth inhibition following rituximab and dexamethasone. Sequential treatment with rituximab followed by dexamethasone or the reverse did not suggest sensitization and produced submaximal apoptosis (data not shown).
Effects of dexamethasone and rituximab on apoptosis.
Dexamethasone- and rituximab-induced apoptosis. (A) Annexin V/propidium iodide staining in Tab cells. Rituximab- and dexamethasone-induced apoptosis of Tab cells as demonstrated by FITC–annexin-V/propidium iodide staining. The AV−/PI− population is shown in the R1 region of the left lower quadrant and represents healthy live cells. The percentages of cells in R1 among the 4 treatment groups are as follows: control, 85% (Ai); rituximab alone, 58% (Aii); dexamethasone alone, 52% (Aiii); and rituximab and dexamethasone, 16% (Aiv). This is a representative Figure of 3 experiments. (B) DNA fragmentation in Tab cells. DNA fragmentation, as a measure of late apoptosis, is induced by the combination of rituximab and dexamethasone. Treatment with both agents simultaneously results in supra-additive sub-G1 DNA content in 3 B-NHL lymphoma cell lines. This shows sub-G1DNA content as a percentage of total DNA in Tab cells treated for 48 hours as follows: control, 5.2% (Bi); 5 μg/mL rituximab, 15.7% (Bii); 10 μM dexamethasone, 22.4% (Biii); and 5 μg/mL rituximab and 10 μM dexamethasone combined, 55.3% (Biv). This is representative of 3 experiments.
DNA fragmentation as a sign of late apoptosis was evaluated in 9 B-NHL cell lines. Following rituximab alone for 72 hours, 3 cell lines (Daudi, DHL-4, and Tab) had reproducible but mildly increased and statistically significant sub-G1 DNA (2% to 4%). The combination of dexamethasone and rituximab statistically significantly increased the sub-G1 DNA content when compared with control in 5 B-NHL cell lines (Daudi, DHL-4, Tab, NCEB-1, and Raji). Supra-additive sub-G1 DNA content is observed in 3 of these B-NHL cell lines (Daudi, DHL-4, and Tab) following treatment with combined dexamethasone and rituximab (Table 2). These cell lines correlate with cell lines that have supra-additive increases in phosphatidylserine exposure. An example of supra-additive DNA fragmentation in Tab cells is shown in Figure 3B.
Dexamethasone and rituximab: effects on CDC
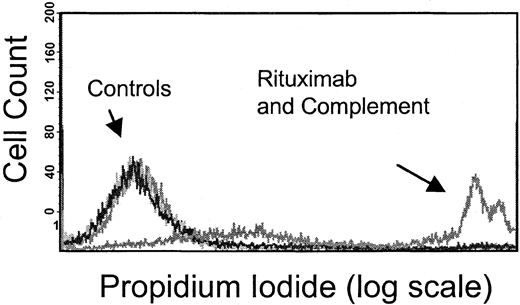
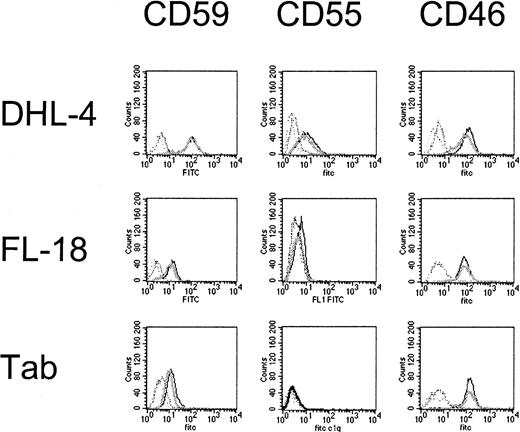
We evaluated the effect of dexamethasone on CDC. Membrane disruption as a measure of CDC following exposure to human serum (as a source of complement) and rituximab was quantified by PI uptake into unpermeabilized tumor cells (Figure 4) and standard chromium-release assays. Results using the 2 methods were consistent. Initial studies showed that 6 B-NHL cell lines tested were sensitive to rituximab-mediated CDC to varying degrees, whereas 3 B-NHL cell lines (OCI Ly8, NCEB-1, and Granta 519) were resistant to rituximab-induced CDC. The complement resistance in these 3 cell lines is attributable to higher CD59, CD55, and CD46 compared with the other 6 B-NHL cell lines (data not shown). A dose-dependent increase in PI+ cells was identified with increasing concentrations of human serum in sensitive cells (data not shown). Simultaneous addition of dexamethasone (10 μM) to rituximab and complement neither protected nor augmented CDC in any of the cell lines (Figure5A). In contrast, CDC following preincubation of target cells with dexamethasone (10 μM) for 72 hours increased complement-mediated lysis in 3 of 9 B-NHL cell lines (DHL-4, FL-18, and Tab) (Figure 5B). We evaluated whether reduction or loss of complement-regulatory protein expression following dexamethasone treatment could explain these results. Dexamethasone exposure did not significantly alter CD55, CD59, or CD46 expression on these cell lines (Figure 6). The remaining B-NHL cell lines were not sensitized to complement-mediated lysis by dexamethasone pretreatment.
Flow cytometry–based complement dependent cytotoxicity assay.
Rituximab-induced CDC was measured by means of flow cytometry to evaluate PI uptake by tumor cells following 1-hour exposure to rituximab and human serum (source of complement). The PI+population, or those cells in which the membrane has become permeable by the complement cascade, is observed only following treatment with rituximab and human serum, as shown in this figure, with the use of Raji cells. In contrast, control cells treated with media alone, rituximab alone, and complement (human serum) alone show no PI uptake. Results from this assay correlate with standard chromium-release assays.
The effects of dexamethasone on rituximab-induced CDC.
(A) Simultaneous dexamethasone and rituximab exposure. CDC was measured in cells following exposure to non–heat-inactivated human (AB) serum and rituximab. Cells were treated with human serum and rituximab (5 μg/mL), with and without dexamethasone (10 μM). There was no significant difference in CDC observed in 9 B-NHL cell lines by the addition of dexamethasone. This is a representative example of 2 experiments. (B) The effects of dexamethasone pretreatment on rituximab-induced CDC. Pretreatment of 3 B-NHL cells with dexamethasone resulted in significantly increased sensitivity to complement-mediated lysis: DHL-4 (46% to 75%, P < .001); Fl-18 (56% to 71%, P = .003); and Tab (41% to 73%,P = ≤ .0001). Specific lysis for samples (n = 6) were compared with the control by means of the Studentt test for independent samples. This is representative of 3 experiments.
Effects of dexamethasone on complement-regulatory protein expression.
DHL-4, FL-18, and Tab cell lines are significantly more sensitive to complement following dexamethasone exposure; however CD59, CD55, and CD46 expression is not significantly changed by dexamethasone. The mean fluorescence intensity for treated (dark) and untreated (light) cells are not significantly different (mean of 3 samples). This is representative of 2 experiments performed.
Effect of dexamethasone on C1q binding and CD20 expression
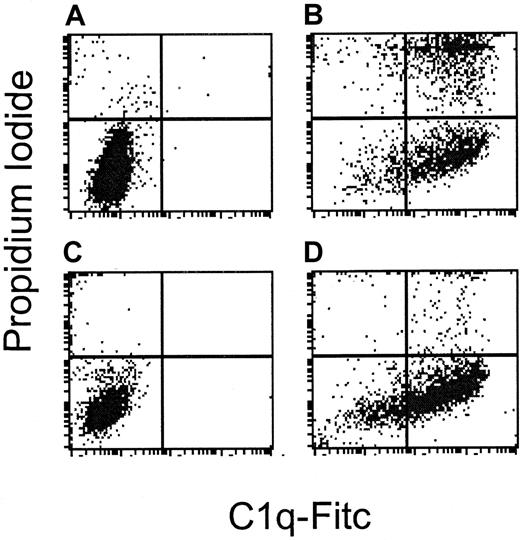
Dexamethasone exposure to B-NHL cell lines did not significantly alter C1q binding on tumor cell surfaces following exposure to rituximab and human serum. Additionally, there were no significant changes in C1q binding on tumor cells following dexamethasone exposure for 72 hours. Table3 shows the mean fluorescence intensity of C1q binding with and without dexamethasone pretreatment in all 9 B-NHL cell lines. Interestingly, the 3 B-NHL cell lines that are resistant to rituximab-induced CDC bound C1q readily in the presence of rituximab and human serum. C1q binding occurs in the absence of lysis following exposure to rituximab and human complement in the complement-resistant cell line NCEB-1, as compared with the complement-sensitive DHL-4 cell line (Figure7). This suggests that complement resistance is distal in the complement cascade to C1 inhibitor activity in these cell lines.
Effect of dexamethasone on C1q binding
| Cell line . | No dexamethasone . | Dexamethasone, 10 μM . |
|---|---|---|
| DHL-4 | 88 | 89 |
| Daudi | 80 | 84 |
| FL-18 | 67 | 71 |
| Granta 519 | 96 | 97 |
| NCEB-1 | 79 | 81 |
| OCI Ly8 | 48 | 38 |
| Raji | 79 | 85 |
| Ramos | 49 | 50 |
| Tab | 73 | 66 |
| Cell line . | No dexamethasone . | Dexamethasone, 10 μM . |
|---|---|---|
| DHL-4 | 88 | 89 |
| Daudi | 80 | 84 |
| FL-18 | 67 | 71 |
| Granta 519 | 96 | 97 |
| NCEB-1 | 79 | 81 |
| OCI Ly8 | 48 | 38 |
| Raji | 79 | 85 |
| Ramos | 49 | 50 |
| Tab | 73 | 66 |
Cells were treated with dexamethasone (10 μM) or without dexamethasone for 72 hours and then assessed for C1q binding following exposure to rituximab and human serum for 1 hour. The mean fluorescence intensity of FITC-C1q was not significantly different following dexamethasone treatment. This table demonstrates the mean of 3 samples from one experiment. P is insignificant for all 9 B-NHL cells.
Complement resistance is distal to C1q binding.
DHL-4 and NCEB-1 are sensitive and resistant, respectively, to rituximab-induced complement. This figure demonstrates flow cytometry following staining with C1q-FITC on the x-axis and PI on the y-axis in cells treated with rituximab alone (A and C), or rituximab and human serum (B and D). (A) DHL-4 control cells: 0.1% bind C1q and 2.1% undergo lysis. (B) DHL-4 cells treated with rituximab and human serum: 84% bind C1q and 44% undergo lysis. (C) NCEB-1 control cells: 0.1% bind C1q and 4.4% undergo lysis. (D) NCEB-1 cells treated with rituximab and human serum: 73% bind C1q and 8% undergo lysis. In contrast to DHL-4 cells, the resistant NCEB-1 cell line binds C1q, but cells do not undergo lysis.
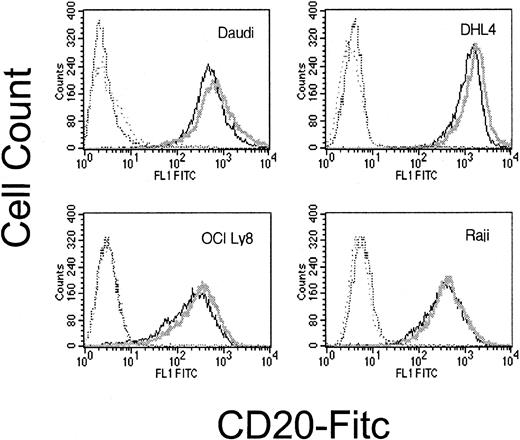
We also investigated whether increased sensitivity to CDC following dexamethasone exposure could result from increased cell surface expression of CD20. Following dexamethasone treatment, there was no significant change in CD20 expression (Figure8).
Surface CD20 following dexamethasone treatment.
Cell surface CD20 is not significantly altered by dexamethasone exposure. CD20 expression on dexamethasone-treated cells (dark line) and untreated cells (light line) are not significantly different. Matching isotype negative controls are in hatched lines. This is representative of 3 experiments.
Dexamethasone and rituximab: effects on antibody-dependent cell-mediated cytotoxicity
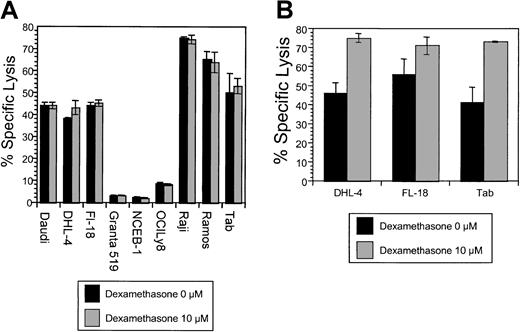
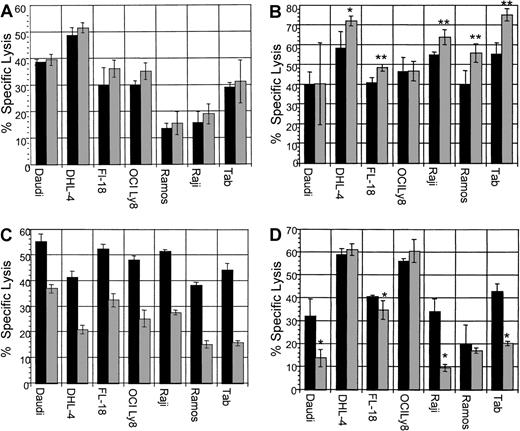
ADCC assays were performed with B-NHL cell lines with the use of dexamethasone concurrently with rituximab. In addition, the following ADCC assays were performed: pretreatment of target lymphoma cells; pretreatment of effector cells; and pretreatment of both effector cells and target cells with dexamethasone. In vivo, both effector and tumor cells would be exposed to dexamethasone, if present in the serum. Therefore, simultaneous use of dexamethasone or pretreatment of both effector and target cells with dexamethasone are the most clinically relevant assays. All B-NHL cell lines tested were sensitive to rituximab-induced ADCC. The addition of dexamethasone to target cells simultaneously with effector cells neither enhanced nor reduced specific lysis in any cell line (Figure9A). Pretreatment of target cells significantly increased sensitivity to ADCC in 5 B-NHL cell lines (Figure 9B). Pretreatment of effector cells significantly impaired specific lysis in all cell lines tested (Figure 9C). Pretreatment of both effector cells and target cells impaired specific lysis in 4 cell lines (Figure 9D), but not in the remaining 3 cell lines. In summary, dexamethasone treatment of target lymphoma cells increased sensitivity to ADCC in 5 cell lines, yet pretreatment of effector cells reduced ADCC in all cell lines tested. Of clinical importance, the use of dexamethasone concurrently with rituximab did not impair ADCC in any cell line, whereas pretreatment of both effector and target cells with dexamethasone reduced lysis in 4 B-NHL cell lines. This suggests that the dexamethasone-induced impairment of effector cells, in some cell lines, is counterbalanced by increased target cell sensitivity to ADCC following dexamethasone exposure.
The effects of dexamethasone on rituximab-induced ADCC.
▪ indicates dexamethasone, 0 μM; ░, dexamethasone, 10 μM. (A) ADCC with dexamethasone, rituximab, and effector cells simultaneously. All cell lines tested were sensitive to rituximab-mediated ADCC. The addition of a clinically relevant dose of dexamethasone to rituximab simultaneously did not significantly alter specific lysis in any cell line. This is representative of 2 experiments performed. (B) ADCC with dexamethasone: pretreatment of target cells. ADCC following preincubation of target cells with dexamethasone (10 μM for 48 hours) resulted in increased lysis in 5 B-NHL cell lines. This is representative of 2 experiments performed. Error bars represent SD of the mean. Asterisks represent statistically significant 2-tailed P values with the use of the Student t test of independent samples. *P < .005; **P < .0001. (C) ADCC with dexamethasone: pretreatment of effector cells. ADCC assays performed following preincubation of effector cells with dexamethasone (10 μM for 48 hours) resulted in significant impairment of ADCC in all B-NHL cell lines tested. This is a representative Figure of 2 experiments performed. (D) ADCC: pretreatment of effector and target cells with dexamethasone. ADCC assays performed following preincubation of both effector and target cells with dexamethasone (10 μM for 48 hours) resulted in significant impairment of ADCC in 4 B-NHL cell lines, whereas ADCC in the remaining 3 cell lines were not significantly impaired. Asterisks represent statistically significant 2-tailedP values with the use of the Student t test of independent samples. *P < .05. This is representative of 2 experiments performed.
ADCC assays were also performed following isolation of the PBMC adherent layer, a monocyte-rich population, confirmed by flow cytometry. Similarly to unmodified effector cells, the monocyte-rich effector cell population was significantly impaired by dexamethasone pretreatment, suggesting that both natural killer (NK) and monocyte cells are inhibited by dexamethasone exposure (data not shown).
We next evaluated effector cell phenotype following dexamethasone exposure. Natural killer cells (CD56+CD16+ and CD14−CD3−) and monocytes (CD14+CD3−) were evaluated following 48 hours in culture with dexamethasone (10 μM) and compared with cells cultured in the absence of dexamethasone. Natural killer cells as a percentage of total cells were reduced by 41% (mean of 6 experiments; SD, 7.8%) and monocytes were reduced by 48% (mean of 4 experiments; SD, 11.6%). Dexamethasone exposure also reduced the naive CD4+ T-cell population; however, the remaining cell populations were unchanged (data not shown). Fc receptors (CD16, CD32, and CD64) on monocytes and natural killer cells were not significantly down-regulated following dexamethasone exposure (data not shown).
Discussion
In this study, we demonstrate for the first time that GCs and rituximab invoke synergistic or supra-additive cytotoxicity with respect to direct antiproliferative effects, apoptosis, and cell cycle arrest in human malignant B-NHL cell lines. Importantly, these effects were observed within the range of clinically relevant doses for both drugs. Rituximab-induced apoptosis, cell growth inhibition, and increased intracellular signaling following CD20 have been previously reported.2,5 These direct effects occur independently of overexpression of the antiapoptotic factor bcl-2 and do not involve alterations in bax, bcl-xl, bad, p53, and c-myc.2,17 18 Apoptosis and cell cycle arrest may play significant roles in the mechanism of rituximab activity in vitro; however the mechanism in vivo remains unclear.
Previous reports of annexin V staining following rituximab therapy are inconsistent. In one study, rituximab alone, without crosslinking antibody, induced apoptosis to a greater degree than 2 other murine anti-CD20 antibodies, 1F5 and B1 (both IgG2a).2 Thirty percent of Ramos cells were positive for annexin V following 48-hour treatment with rituximab alone. In another study, only 3% of Ramos cells were annexin V+ compared with controls following 48-hour treatment with rituximab.4 Our results show 5% to 23% increase in annexin V+ cells (7% in Ramos cells), emphasizing the cell line–dependent nature of this phenomenon. Variability in the literature may be readily explained by different gate settings used in flow cytometry. In addition, in our laboratory, the presence of incompletely heat-denatured serum supplementation will increase the annexin V. In the current study, using consistent gate settings and completely inactivated serum, the DHL-4 cell line undergoes early apoptotic changes more than other B-NHL cell lines owing to rituximab therapy alone. Tab cells show the strongest synergy with respect to apoptosis following combined therapy with dexamethasone and rituximab. The combination of dexamethasone and rituximab induces G1 arrest in all cell lines when compared with untreated controls. This effect was supra-additive in 4 cell lines. From these data, it appears that cell cycle arrest induced by the combination of dexamethasone and rituximab is essential for synergistic growth inhibition, while the observation is enhanced in the presence of supra-additive apoptosis.
The addition of crosslinking antibodies clearly augments rituximab-induced apoptosis and the resultant intracellular signaling. For example, in one study, crosslinking rituximab antibody with goat anti–human IgG increased annexin V+ cells from 30% to 50%. Apoptosis and signaling events including PARP cleavage products were present following rituximab therapy, but were significantly enhanced in the presence of a crosslinking antibody.2 In another study, rituximab induced growth inhibition in DHL-4 cells, consistent with our results; however, that study reported enhanced growth inhibition and apoptosis using rituximab homodimers.4 Crosslinking may occur via Fc receptors on the tumor cells. However, in our laboratory, we have been unable to demonstrate that cells undergoing apoptosis due to rituximab express Fc receptors (CD16, CD32, and CD64) or that Fc receptor expression is altered by GCs. Although we did not use crosslinking antibodies in this study, we concur that its use significantly enhances the direct antiproliferative and apoptotic signal observed in vitro.
The mechanism of cytotoxic synergy between GCs and rituximab is probably a result of cell cycle arrest and apoptosis. The results in this paper confirm the findings of other investigators that GC treatment results in both G1 arrest and apoptosis.8-10 Like rituximab, the GC-induced apoptotic cascade involves phosphatidylserine exposure on the outer leaflet of the cell membrane, loss of mitochondrial membrane potential, cytochrome c release from the mitochondria, caspace activation, PARP cleavage, activation of calcium-dependent endonucleases, DNA fragmentation, and ultimately cell death.19-22 In contrast to rituximab, however, apoptosis induced by GCs is dependent upon suppression of mRNA and protein synthesis. The apoptotic pathways of these 2 agents both depend upon calcium and ultimately result in cell death, yet they are clearly independent apoptotic pathways. GCs are known to reduce the antiapoptotic factors p53, bcl-xl, and bcl-2. This may facilitate the rituximab-induced antiproliferative effect. Overexpression of bcl-2 and c-myc antagonizes GC-induced apoptosis,17 23 and in fact, in the current report, the cell line FL-18 that does overexpress bcl-2 does not show significant cytotoxic synergy. Bcl-2 does not explain the phenomenon entirely, however, given that DHL-4 cells, which show significant synergy, also overexpress bcl-2.
Another possible mechanism relates to disturbance in the cell cycle, as GCs are known to reduce cyclin D3 and the cyclin-dependent kinase cdk4.23-28 In normal B cells, rituximab has been shown to block the cell cycle control proteins cdk2, cdk4, and cyclin A at the protein levels.29 The current study reports significant growth inhibition due to rituximab alone; however, significant G1 arrest was not consistently observed following rituximab therapy. We have shown here, however, that G1 arrest does occur in 9 of 9 B-NHL cell lines when they are treated with dexamethasone and rituximab in combination, as compared with untreated controls. The effects of GCs and rituximab on antiapoptotic factors and cell cycle control proteins warrant further investigation.
The dominant mechanism of rituximab's antitumor activity in vivo is not clear. Mobilization of the immune effector mechanisms CDC and ADCC via the human IgG1 Fc portion of the chimeric antibody is clearly significant. The ineffective chimeric C2B8 antibody engineered with the use of the IgG4 version in cynomolgus monkeys confirms the activity of the Fc portion of rituximab.302B8, the parent murine monoclonal anti-CD20 antibody, does not activate CDC and ADCC in vitro against human B-cell malignancies whereas rituximab clearly does.1,29,31-34 In vitro sensitivity to complement by fresh tumor cells from patients with B-cell malignancies varies following rituximab exposure.32,34 Cell sensitivity to rituximab-induced complement may correlate with CD20 antigen density in tumor cells with low CD20 expression, for example, chronic lymphocytic leukemia (CLL).33 In addition, the presence of increased CRPs CD55, CD59, and CD46 confers resistance to rituximab-induced CDC by cell lines and primary lymphoma cells.29,34 Treatment with antibodies that block CRP activity abrogate complement resistance in vitro.29,31-34However, the significance of complement and complement-regulatory expression was recently challenged in B-NHL by the observation that complement-regulatory protein expression and CDC in vitro using primary B-NHL tumor cells did not correlate with clinical response to rituximab.35
In the current study, we first combined dexamethasone with human complement and rituximab simultaneously, and results showed that dexamethasone did not significantly alter specific lysis. In contrast, pretreatment of the B-NHL cells with dexamethasone at clinically relevant doses for 72 hours increased sensitivity to complement in 3 B-NHL cell lines (DHL-4, FL-18, and Tab). Cell surface expression of the complement-regulatory proteins CD55, CD59, and CD46 were essentially unchanged, as were CD20 levels following dexamethasone treatment. These findings are of uncertain significance, although dexamethasone clearly does not protect cells from rituximab-induced CDC.
Of the immune-effector mechanisms involved in rituximab's mechanism of action, ADCC is thought to be the most important mediator of antibody activity. In vitro studies of normal B cells and fresh patient-derived CLL tumor cells showed minimal cytotoxic effect with the use of autologous complement, whereas the addition of CD56+CD14+ mononuclear cells significantly increased cell lysis.36 Natural killer cell and phagocyte ADCC is mediated via the stimulatory Fc receptors (FcγRI [CD64] and FcγRIII [CD16]). Macrophages and monocytes, but not natural killer cells, also express inhibitory receptors FcγRIIb. In a report by Clynes et al,37 an Fc common γ-chain knockout (lacking stimulatory FcγRI and FcγRIII) mouse showed reduced protection conferred by rituximab against Raji xenografts compared with the wild type. This suggested that, in this xenograft system, ADCC is a significant effector mechanism, and that ADCC is not due solely to NK cells.
To further strengthen the argument that ADCC plays a vital role in rituximab's cytotoxic effect, clinical responses to rituximab have recently been correlated with genetic polymorphisms identified on FcγRIIIA, an Fc receptor on natural killer cells and monocytes. Position 158 (phenylalanine [Phe] or a valine [Val]) directly interacts with the lower hinge region of human IgG1. The FcγRIIIa Val/Val phenotype has greater affinity for human IgG1 than FcγRIIIa Val/Phe or Phe/Phe.38 Recently, it has been shown that patients with previously untreated follicular non-Hodgkin lymphoma with the V/V genotype had improved clinical response to rituximab compared with the Phe/Phe and Val/Phe genotypes.39
The results of these studies may have clinical relevance, and animal studies are currently underway to further evaluate the in vivo effects of glucocorticoid treatment with rituximab. In this report, we found the antiproliferative effect of glucocorticoids and rituximab to be synergistic. Also, we report that although the effector cells involved in ADCC are clearly inhibited by 48-hour exposure to dexamethasone, simultaneous treatment with dexamethasone and rituximab does not impair ADCC. This suggests that the duration of exposure to GCs relative to the commencement of the ADCC reaction is important and that, to maximize patient benefit, administration of glucocorticoids should occur at approximately the same time as the rituximab infusion. Ultimately, a clinical trial comparing GCs and rituximab with rituximab alone would be required to prove that these observations in vitro translate into patient benefit.
Supported in part by National Institutes of Health (NIH) grant CA83747 and Leukemia and Lymphoma Society grant 6515-00; A.L.R. is supported by NIH grant K12CA76930.
The publication costs of this article were defrayed in part by page charge payment. Therefore, and solely to indicate this fact, this article is hereby marked “advertisement” in accordance with 18 U.S.C. section 1734.
References
Author notes
Andrea L. Rose, 1100 Fairview Ave N, D1-100, Seattle, WA 98109; e-mail: arose@fhcrc.org.

This feature is available to Subscribers Only
Sign In or Create an Account Close Modal