Abstract
p45NF-E2 is a member of the cap ‘n’ collar (CNC)-basic leucine zipper family of transcriptional activators that is expressed at high levels in various types of blood cells. Mice deficient in p45NF-E2 that were generated by gene targeting have high mortality from bleeding resulting from severe thrombocytopenia. Survivingp45nf-e2−/− adults have mild anemia characterized by hypochromic red blood cells (RBCs), reticulocytosis, and splenomegaly. Erythroid abnormalities inp45nf-e2−/− animals were previously attributed to stress erythropoiesis caused by chronic bleeding and, possibly, ineffective erythropoiesis. Previous studies suggested that CNC factors might play essential roles in regulating expression of genes that protect cells against oxidative stress. In this study, we found that p45NF-E2–deficient RBCs have increased levels of reactive oxygen species and an increased susceptibility to oxidative-stress–induced damage. Deformability of p45NF-E2–deficient RBCs was markedly reduced with oxidative stress, and mutant cells had a reduced life span. One possible reason for increased sensitivity to oxidative stress is that catalase levels were reduced in mutant RBCs. These findings suggest a role for p45NF-E2 in the oxidative-stress response in RBCs and indicate that p45NF-E2 deficiency contributes to the anemia inp45nf-e2−/− mice.
Introduction
Eukaryotic cells have a battery of mechanisms to defend against the harmful effects of reactive oxygen molecules,1,2 including antioxidant molecules that function by directly inactivating reactive oxygen molecules and enzymes that metabolically convert toxic compounds to forms that are readily excreted by cells. In many cases, transcriptional activation of genes that play a role in detoxification of xenobiotics and defense against oxidative stress is mediated partly by the antioxidant response element (ARE). For example, AREs were found in promoter sequences of genes including nicotinamide adenine dinucleotide phosphate–quinone oxidoreductase, heme oxygenase, glutathione-S- transferases (GST), and glutamylcysteine synthetase.3-7 Several different transcription factors, including basic leucine zipper (bZIP) proteins, activator protein 1 (AP-1), and other novel factors, were shown to bind the ARE.4 8
The ARE consensus sequence is very similar to the NF-E2/AP1–like sequence of the β-globin locus control region, which was found to be essential for globin gene expression. Multiple proteins can interact with the NF-E2 consensus sequence. The cap ‘n’ collar (CNC)–bZIP factor family of proteins was identified from searches for proteins that bind and activate the NF-E2/AP1 site of the β-globin locus control region. This multiple-protein family includes p45NF-E2, NF-E2–related factor (Nrf) 1, Nrf2, Nrf3, and the more distantly related Bach1 and Bach2.9-15 The similarities among CNC family members are most notable in the basic-DNA binding region and another homology domain spanning 43 amino acids immediately N-terminal to the basic domain.16 This region is also highly conserved in the Drosophila CNC protein and theCaenorhabditis elegans Skn protein, and it is not present in Jun, Fos, or other bZIP proteins. The region has been referred to as the CNC domain.
Expression of p45NF-E2 is restricted to cells of the hematopoietic lineage—megakaryocytes, neutrophils, mast cells, and developing erythrocytes.9,12,14,17 Together with a p18 protein of the small Maf family, p45NF-E2 functions as an obligate heterodimer.9,14,18 High levels of p45NF-E2 are detected in extracts of erythroid cell lines, and its binding activity increases during erythroid differentiation of mouse erythroleukemic cells.19 Mice with disruption of the p45nf-e2gene have severe platelet deficiency due to defective megakaryocyte maturation.20 As a result, mutant p45NF-E2 mice have high rates of mortality and morbidity caused by bleeding. In addition, p45NF-E2 knockout mice have very mild anemia characterized by the presence of hypochromic red blood cells (RBCs) and reticulocytosis.21 Whether the abnormalities are entirely due to the consequences of bleeding is not known.
Nrf1 and Nrf2 have been implicated in the regulation of antioxidant gene expression. The knockout of nrf1 results in embryonic death,22,23 and fibroblasts derived from nrf1null embryos have enhanced sensitivity to the toxic effects of various oxidant compounds.24 Although nrf2knockout mice are viable and outwardly normal, mutant animals have diminished expression of phase 2 enzyme genes and are sensitive to redox cycling agents.25 26
Does p45NF-E2 have a role in the oxidative-stress response? Because CNC factors may represent an important class of regulators of antioxidant gene expression by means of the ARE, one possibility is that p45NF-E2 is involved in regulating oxidative-stress response genes in the RBCs, while ubiquitous-expressing Nrf1 and Nrf2 assume this role in all other tissues. It is possible that a compensated hemolytic state contributes to the erythroid abnormalities observed in p45NF-E2 knockout mice. Because of their function as oxygen carriers, RBCs are constantly exposed to oxidative stress. Yet, despite the limited biosynthetic repertoire available to mature RBCs, they are resilient to oxidant-induced damage. Clearly, antioxidants in the form of scavengers and detoxifying enzymes provide an important protective system in RBCs,27 but our knowledge of the molecular mechanisms that regulate expression of antioxidants in RBCs is limited.
In this study, we found that RBCs from p45NF-E2–deficient mice are sensitive to oxidative stress. RBCs from p45NF-E2–deficient mice accumulated high levels of free radicals when exposed to oxidants, and this correlated with increased formation of methemoglobin and loss of membrane deformability. In addition, severe anemia developed in p45NF-E2–deficient mice treated with oxidative-stress–inducing drugs, and mutant RBCs had decreased survival. One likely cause of increased sensitivity to oxidative stress is reduced catalase activity in mutant RBCs. Our finding that messenger RNA (mRNA) and protein levels for catalase are reduced in mutant RBCs suggests that the mouse catalase gene is regulated by p45NF-E2. These findings indicate that anemia in p45NF-E2 knockout mice has another cause aside from bleeding. Our findings should provide important clues to the role of p45NF-E2 in RBC function and have possible relevance in hemolytic diseases.
Materials and methods
Measurement of intracellular reactive oxygen intermediates
Erythrocytes were washed in Hanks balanced salt solution (HBSS) and preloaded with 10 μM 2′,7′-dichlorodihydrofluorescein diacetate (DCFHDA; Molecular Probes, Eugene, OR) for 30 minutes in HBSS with 2% fetal-calf serum. The DCFHDA-loaded cells were treated with 0.05, 0.1, 0.2, and 0.5 mM hydrogen peroxide (H2O2) and incubated for 15 minutes at room temperature in the dark. The oxidative conversion of DCFHDA to its fluorescent product was assessed by determining the amount of fluorescent signal detected by flow cytometry with use of a laser (488 nm wavelength).
Methemoglobin formation assay
Fresh RBCs from wild-type, p45nfe2−/−, and β-thalassemic (Hbbth-3/Hbbth-3) mice28 were incubated at a 5% hematocrit in various concentrations of H2O2 in 1 × phosphate-buffered saline (PBS). After a 10-minute incubation at room temperature, cells were pelleted by centrifugation at 5000g and lysed with 5 mM sodium phosphate (pH 8.0) buffer. Total hemoglobin and methemoglobin concentrations in the samples were determined spectrophotometrically.29 Methemoglobin concentration was determined by comparing the absorbance spectra at 630 nm before and after addition of potassium cyanide (KCN) to hemolysates and was expressed as a percentage of the total hemoglobin concentration.29
Osmotic gradient ektacytometry
Ektacytometry measurements were done as described previously by using a Technicon ektacytometer (Technicon Instruments, Tarrytown, NY).30 Oxidant damage was induced by incubating fresh RBCs (∼2.5%-5% hematocrit) in normal saline containing 4 mM sodium azide and various concentrations of H2O2. After a 10-minute incubation at room temperature, cells were pelleted by centrifugation at 5000g and resuspended in a buffered polyvinyl pyrrolidone (PVP) solution (36 g/L PVP, 20 mM sodium phosphate [pH 7.4], and sodium chloride [NaCl] to a final osmolality of 300 mOsm/kg) with a final viscosity of 20 cP. The osmotic deformability of untreated RBCs and RBCs treated with H2O2 was analyzed by continuous measurements of a deformability index as a function of increasing osmolality (80-500 mOsm/kg) at a constant shear stress of 160 dyne/cm2.
Analysis of mice and RBCs
Mice used in the studies had a mixed 129/Sv and C57BL/6 background. Dapsone (4,4′-diaminodiphenyl sulfone), H2O2, and phenylhydrazine hydrochloride were purchased from Sigma (St Louis, MO). Phenylhydrazine was prepared in 1 × PBS and adjusted to a pH of 7.4 with sodium hydroxide. Working solutions of dapsone were made in 1 × PBS by diluting a concentrated solution of dapsone prepared in dimethyl sulfoxide. Anemia was induced in adult mice (8-10 weeks old) by an intraperitoneal injection of dapsone (50 μmol/kg) or phenylhydrazine (50 mg/kg) solution. Blood was collected 24 to 48 hours after the injection from either the retro-orbital venous plexus or the tail vein into heparin-treated capillary tubes (Kimble, Vineland, NJ). For retro-orbital collections, mice were anesthetized with methoxyflurane before the procedure. RBC counts, hemoglobin concentrations, hematocrit levels, and other RBC variables were assessed and analyzed by using a Hemavet 850 machine (CDC Technologies, Oxford, CT) and software designed for murine blood studies. Blood smears were prepared and stained with Wright-Giemsa stain by using an automated stainer (Hematek, Branchburg, NJ). Reticulocytes were enumerated on thin films after staining of cells with new methylene blue dye. The percentage of reticulocytes was determined by counting approximately 1000 RBCs from random fields in blood films under 1000× magnification.
RBC survival studies
The turnover of RBCs was measured in 2 ways. RBCs were labeled with biotin by injection of approximately 100 μL of a 60-mg/mL solution of EZ-Link–N-hydroxy succinimide (NHS)–biotin (Pierce, Rockford, IL) in PBS (pH 7.4). More than 95% of the murine RBCs were biotinylated after labeling. Alternatively, heparin-treated whole blood was washed in HBSS (pH 7.4, 330 mOsm). A solution of 4.43 mg/mL EZ-Link–NHS–biotin (Pierce) in PBS (pH 7.4) was prepared. To 800 μL washed RBCs (hematocrit ∼ 0.5), 10 μL of the biotinylation mixture was added to achieve a final concentration of 100 μM. After a 1-hour incubation at room temperature, the cells were washed in buffer and resuspended to achieve a 0.5 hematocrit in 330 mOsm NaCl, and 100 μL was injected into the tail vein. This resulted in the presence of approximately 7% to 10% biotinylated cells in the cell population.
The first blood sample for determining the quantity of biotinylated cells was obtained 30 minutes after either injection of biotin or transfusion of biotinylated cells. Thereafter, blood samples were obtained from the tail vein at various intervals for 4 weeks for quantitation of biotin-labeled cells remaining in the circulation. Samples were washed with HBSS (pH 7.4, 330 mOsm) and incubated with fluorescein-labeled avidin solution (0.2 mg/mL in the same buffer) for 30 minutes at room temperature in the dark. Unbound avidin was removed by washing with buffer, and this was followed by flow cytometric detection of fluorescein-labeled cells. The percentage of biotinylated cells was calculated as a ratio of positive (fluorescein-labeled) cells to all RBCs.
Ter-119 sorting and reverse transcriptase–polymerase chain reaction (RT-PCR) analysis
Ter-119–positive (Ter-119+) cells from the spleen and bone marrow of mice were isolated by using magnetically activated cell-sorter (MACS) Ter-119 microbeads according to the manufacturer's instructions (Miltenyi Biotec, Germany). Briefly, bone marrow and spleens from 3 or 4 mice were pooled and processed to obtain a single-cell suspension by using standard procedures. Contaminating RBCs were then lysed in a solution of 0.8% ammonium chloride and 10 mM EDTA, and cell aggregates and debris were removed by passage over a 70-μM filter (Falcon; Becton Dickinson, Franklin Lakes, NY). Lymphocytes and granulocytes were labeled by using a combination of biotinylated anti-CD2, 19, and Gr-1 antibodies (Pharmigen, San Diego, CA). Depletion was achieved by incubating labeled cells with streptavidin microbeads and passage over a magnetic column (MidiMACS; Miltenyi Biotec). Erythrocytes in the flow-through fraction were then magnetically isolated from the depleted fraction by using Ter-119 microbeads. An aliquot of the resulting cells was stained with Wright-Giemsa stain to determine the purity of isolated cells. RNA from Ter-119–sorted cells was isolated by using Ultraspec RNA extraction solution (Biotecx, Houston, TX). For RT-PCR, first-strand complementary DNA was synthesized by using random hexamer primers according to the manufacturer's protocol (Pharmacia, Piscataway, NJ). PCRs were carried out in 10 mM Tris–hydrochloric acid (pH 8.3), 50 mM potassium chloride, 1.5 mM magnesium chloride, 0.2 mM deoxynucleoside triphosphate, 0.0037 MBq (0.1 μCi) α-phosphorous 32–deoxycytidine triphosphate (1.11 MBq8/mM [3000 Ci/mM]; Amersham, Arlington Heights, IL), 10 pmol of each of the primers, and 2.5 U Amplitaq polymerase (Perkin Elmer, Foster City, CA). Standard procedures were used for gels, and band intensities were quantitated by means of phosphoimaging. PCR primer sequences were as follows: catalase, 5′-GGCACACTTTGACAGAGAGCGGAT and 3′-AGTTTTTGATGCCCTGGTCGGTCT; GST-Yc, 5′-GAGATCGACGGGATGAAACTGGTG and 3′-GCGCTTTCAGGAGAGGGAAGTTGT; erythropoietin receptor, 5′-AGATGATGAGGGGCCCTTACTGGA and 3′-AAGGCTGTTCTCATAGGGGTGGGA; and glyceraldehyde-3-phosphate dehydrogenase, 5′-ACCACAGTCCATGCCATCAC and 3′-TCCACCACCCTGTTGCTGTA.
Cellular catalase assays and immunoblot analysis
Catalase activity in RBCs was measured as described by Beutler.53 For immunoblot experiments, RBCs were lysed in T-Per Extraction Buffer (Pierce). Lysates (50 μg) were electrophoresed in 10% denaturing polyacrylamide gel and transferred to a nitrocellulose membrane. The membrane was blocked with 1×triethanolamine-buffered saline containing 5% (wt/vol) nonfat dry milk and 0.2% Tween 20. Catalase was detected with a rabbit polyclonal antibody against human catalase (Oxis, Portland, OR) and peroxidase-labeled goat antirabbit antibody.
Statistical analyses
Statistical analyses were done with Statview software (SAS, Cupertino, CA). Data from the same number of +/+ and −/− mice were used to determine the mean (± SEM). The significance of difference between mean values was analyzed by using the Student ttest. Differences were considered significant if the P value was less than .05.
Results
RBCs deficient in p45NF-E2 accumulate elevated levels of reactive oxygen intermediates
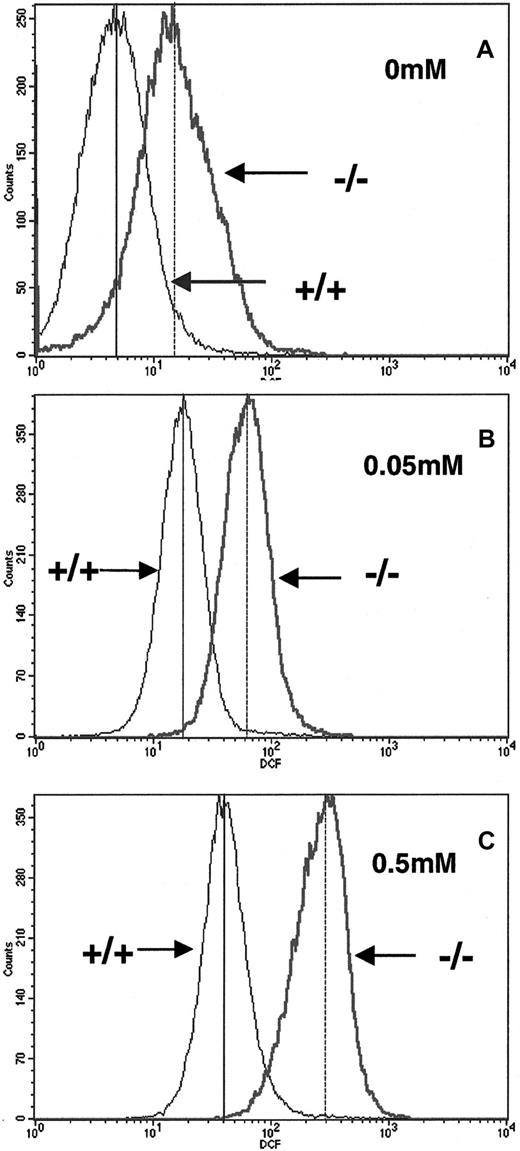
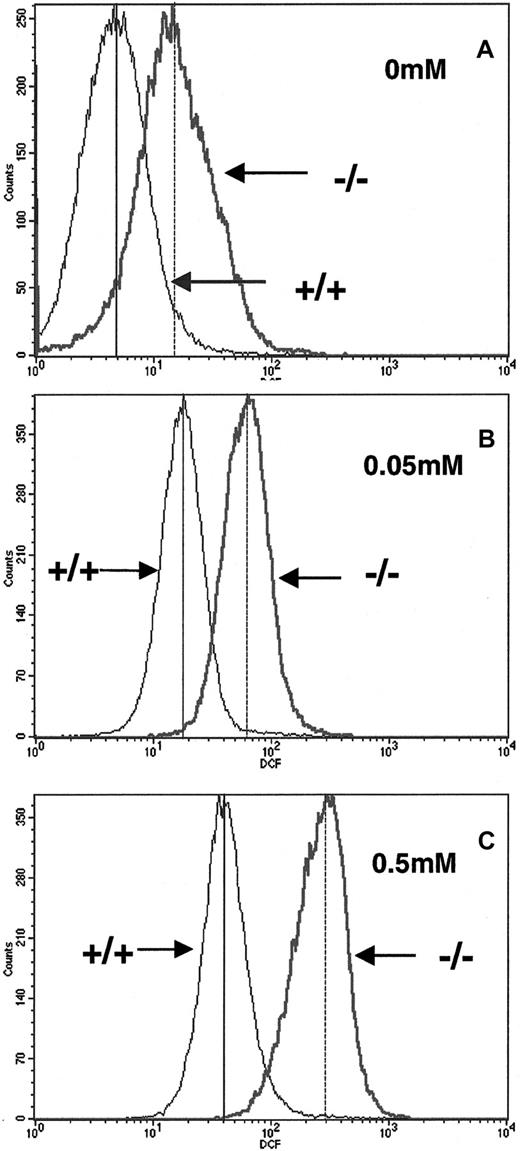
To determine whether p45nf-e2−/− RBCs are susceptible to oxidative stress, we measured oxidation of the DCFHDA fluorescent dye as a marker for reactive oxygen species (ROS) inside RBCs. We found that p45nf-e2−/− RBCs had a 3-fold elevation in basal levels of fluorescent DCFHDA formation compared with normal control cells (Figure1A). This finding indicates thatp45nf-e2−/− RBCs have an increased level of ROS compared with wild-type cells under steady-state conditions. Challenging the cells with H2O2 treatment led to a further increase in fluorescent DCFHDA levels in both wild-type and mutant cells (Figure 1B and 1C). However, the increase in fluorescent level was consistently greater in p45NF-E2–deficient RBCs. Mutant RBCs treated with 0.05 mM H2O2 had an approximately 5-fold increase in fluorescence, whereas wild-type cells had a 3-fold increase (Figure 1B). Increasing the concentration of H2O2 to 0.5 mM further increased fluorescence in wild-type cells, to values about 7-fold above baseline. In contrast, mutant RBCs had a significantly greater increase (20-fold; Figure 1C). Similar results were obtained when cells were incubated with phenylhydrazine (data not shown).
Elevated reactive oxygen intermediates in RBCs from p45NF-E2–deficient mice.
Generation of reactive oxygen molecules was measured by intracellular oxidation of DCFHDA. Concentrations of H2O2used in treatment are indicated. Mean fluorescence levels for +/+ and −/− RBCs are indicated in each box by vertical solid and dotted lines, respectively.
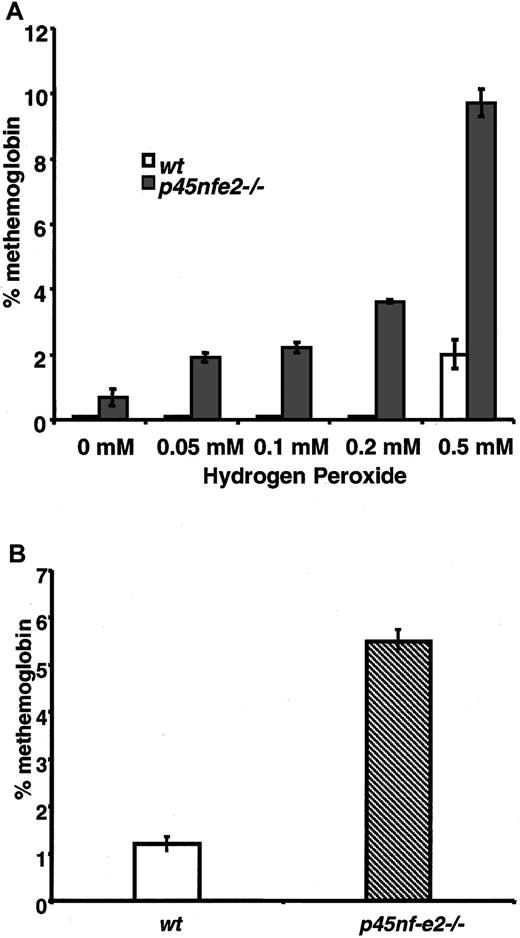
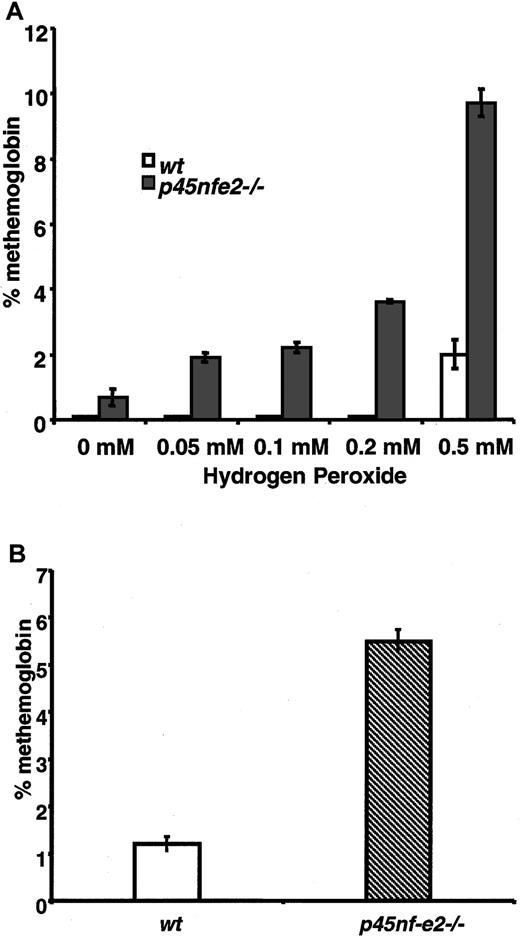
To further assess the consequences of oxidative treatment on mutant RBCs, we measured oxidation of hemoglobin in the form of methemoglobin. In H2O2-treated cells, increased levels of methemoglobin were observed in p45NF-E2–deficient RBCs compared with normal cells. Methemoglobin was readily induced inp45nf-e2−/− RBCs with as little as 0.05 mM H2O2 (Figure 2A). In contrast, significantly higher concentrations of H2O2 were required to induce formation of methemoglobin in control RBCs. Similarly, elevated levels of methemoglobin were observed in RBCs fromp45nf-e2−/− mice given intraperitoneal injections of dapsone (Figure 2B). RBCs from β-thalassemic mice treated with H2O2 did not have elevated methemoglobin levels, indicating that the increased sensitivity to oxidant stress was specific to the p45NF-E2 mutation (0.6 ± 0.1% and 0.7 ± 0.1%, respectively, for 4 wild-type and 4 Hbbth-3/Hbbth-3 mice). These results indicate that normal RBCs were better able to cope with the increased intracellular oxidative burden, whereas p45NF-E2–deficient RBCs had diminished capacity in this regard.
Elevated methemoglobin formation in p45NF-E2 mutant RBCs in response to oxidant treatment.
(A) Methemoglobin formation in erythrocytes after incubation with various concentrations of H2O2. (B) Methemoglobin levels in mice given 50 μmol/kg dapsone. Data points represent mean values (n = 3); bars represent SEM.P < .01 for all values compared with wild-type levels.
Increased osmotic fragility in p45NF-E2–deficient RBCs
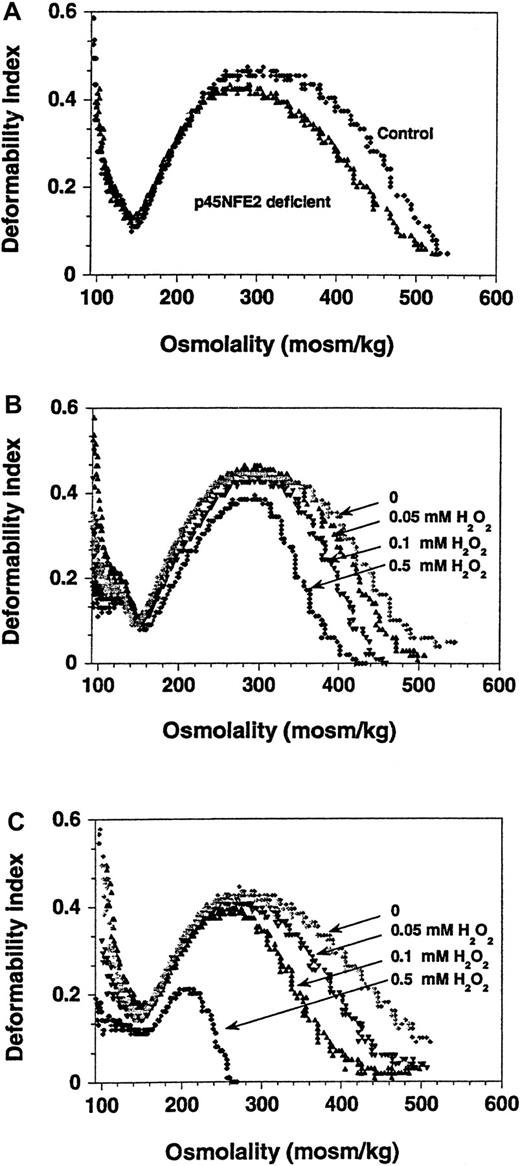
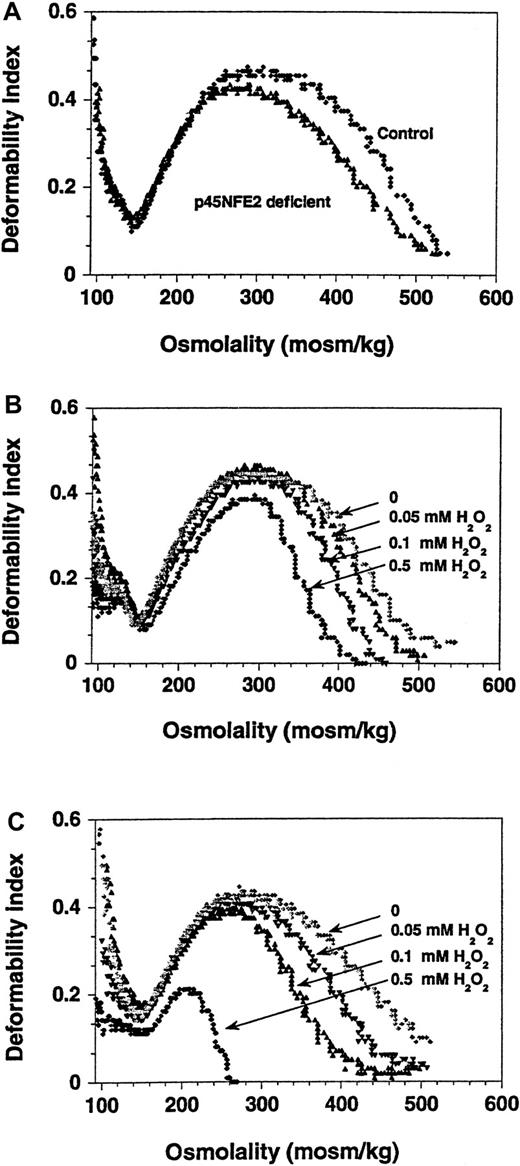
Because the deformability of erythrocytes was previously shown to be affected by oxidative stress,30,31 we assessed the effects of H2O2 on p45NF-E2 mutant cells by using ektacytometry. As shown in Figure3, the osmotic deformability profile of p45NF-E2 mutant RBCs was considerably different than that of normal RBCs. A decrease in the maximal deformability index was readily apparent even in untreated p45NF-E2 mutant cells compared with normal controls (Figure 3A). Challenge with as little as 0.05 mM H2O2 led to a further decrease in the deformability index in mutant RBCs. Virtually no change was detected in normal cells that were treated similarly (Figure 3B). Comparison studies (Figure 3B and 3C) showed that the alteration in the deformability profile depended on the H2O2concentration. At a concentration of 0.5 mM H2O2, the deformability ofp45nfe2−/− RBCs in comparison to normal RBCs was completely abolished (Figure 3C). Whether the abnormal membrane deformability at baseline was caused only by increased ROS in the p45NF-E2–deficient erythrocytes is not known, but it is clear that loss of deformability was further exacerbated by oxidative stress. Similar changes in the osmotic deformability profile and a decrease in the deformability index due to oxidation-induced changes in RBC membranes were previously observed in hemoglobinopathies such as thalassemia.32-34 The oxidant-induced decreased deformability in the hypertonic arm of the profile indicates changes in the mechanical properties of the membrane35 and suggests that mutant cells may be more rigid than normal cells. This may lead to their premature removal as they move through the reticuloendothelial system.36 37
Osmotic gradient deformability profiles show reduced deformability of p45NF-E–deficient RBCs.
Representative curves from analyses of RBCs from normal andp45nf-e2−/− mice are shown. (A) Untreated control and p45NF-E2 mutant RBCs. (B) Control RBCs treated with H2O2. (C) p45NF-E2 mutant RBCs treated with H2O2.
Phenylhydrazine induces severe anemia in p45NF-E2–deficient mice
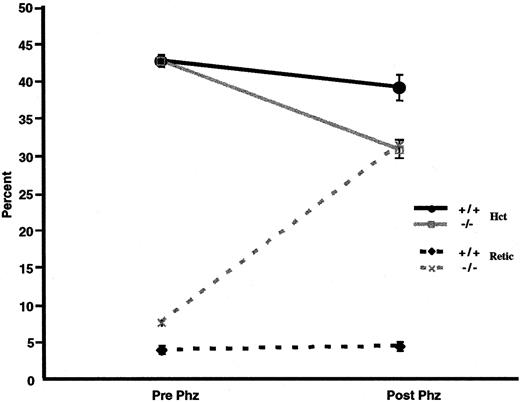
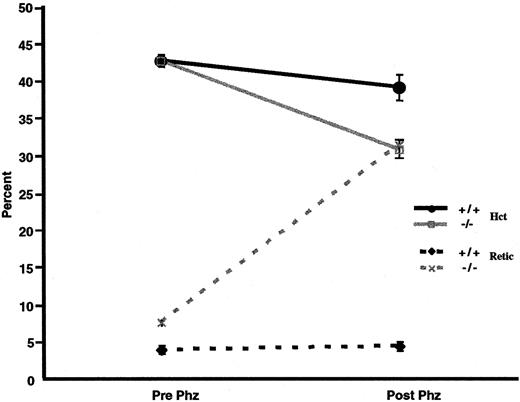
We examined whether p45NF-E2–deficient mice also have an increased susceptibility to oxidative agents in vivo. Thus, both normal control and p45nf-e2−/− mice were given intraperitoneal injections of phenylhydrazine. Forty-eight hours later, there was an approximately 5-point drop in hematocrit level in normal control mice (Figure 4). Inp45nf-e2−/− mice, however, the decrease in hematocrit was significantly greater (∼15 points;P < .01), and it was accompanied by a dramatic increase in reticulocytes (30%) above the normally elevated levels in mutant mice (Figure 4). In contrast, no significant increase in reticulocytes was observed in normal control mice. Additionally, oxidative treatment of p45nf-e2−/− mice significantly altered the morphologic features of their RBCs compared with those in normal control mice. Echinocytes were readily apparent after phenylhydrazine or dapsone treatment inp45nf-e2−/− RBCs (data not shown). Others have also observed formation of echinocytes when erythrocytes are treated with various oxidants, including H2O2 and dapsone.31 38 The morphologic alterations have been attributed to peroxidation of membrane proteins as a result of oxidative stress. These findings suggest thatp45nf-e2−/− mice have an increased susceptibility to oxidative-stress–induced hemolysis as a result of drug treatment.
Effects of phenylhydrazine treatment.
Solid lines represent hematocrit values, and dotted lines represent the percentage of reticulocytes in control (black) and p45NFE2 (gray) samples. Data points represent mean values (n = 3); bars represent SEM. P < .01 for untreatedp45nfe2−/− mice versus phenylhydrazine-treated p45nfe2−/−mice.
RBCs from p45NF-E2–deficient mice have decreased survival
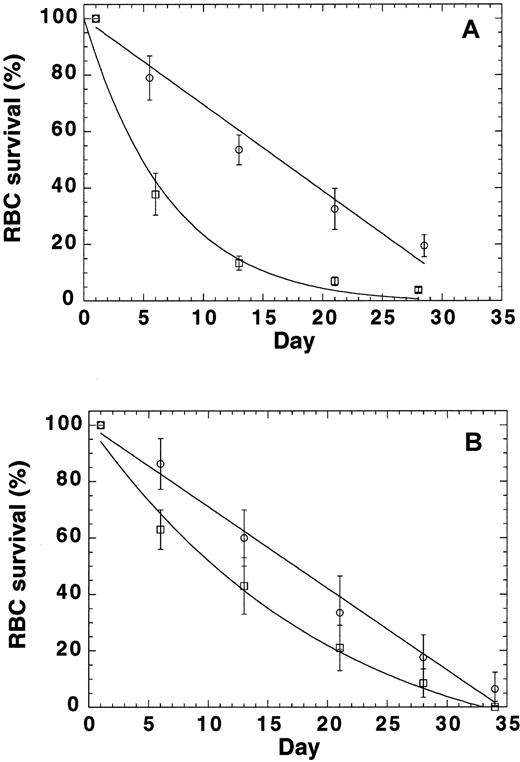
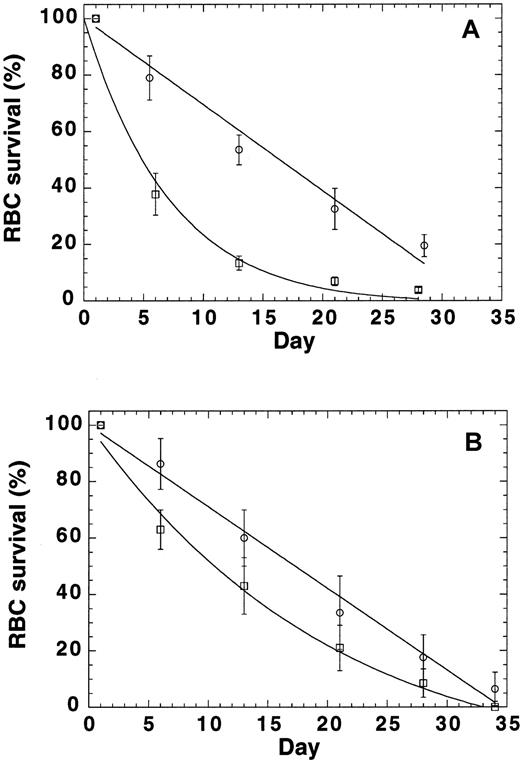
Because the findings described above indicated that mutant RBCs are prone to oxidative damage, we conducted RBC survival studies to test the idea that p45nf-e2−/− RBCs have an accelerated turnover rate. Labeling of RBCs by tail-vein injection of biotin provided RBC survival data in normal mice (Figure5A). The labeling resulted in biotinylation of more than 95% of the RBC population. The data were normalized to express the percentage of biotinylated cells relative to time zero. Our data indicated a linear replacement of murine RBCs in the control mice (k = 0; R = 0.99), with an potential lifespan (T) of 33 days, or a turnover of approximately 3% per day with a half-life of 16.5 days (Figure 5A). This corresponds well with a reticulocyte count in these mice of 2.5%. In contrast, random RBC removal was observed in the p45nf-e2−/− mice. The extinction time (T) was still about 30 days, but extra destruction was also observed (k = 0.11; R = 0.98), and it resulted in a half-life of 5 days. These data showed that another RBC destruction factor, independent of RBC age, was present inp45nf-e2−/− mice.
RBC turnover in normal control mice and
p45nfe2−/−mice.(A) RBCs were labeled by means of tail vein injection of biotin. At time zero, more than 95% of the cell population was biotinylated. The normalized number of biotinylated RBCs (± SD) as a function of time are shown for 4 control (circles) andp45nfe2−/− (squares) mice. (B) RBCs were collected from control andp45nfe2−/− mice, biotinylated, and reinjected into the tail vein of control mice. At time zero, 7% to 10% of the cell population was biotinylated. The normalized number of biotinylated RBCs (± SD) as a function of time are shown for control RBCs (circles) and p45nfe2−/− RBCs (squares) injected into 4 different control mice. The data were fitted to the following equation: percentage of biotinylated cells = (100−(100/T)*t) exp(−kt), in which T equals the time at which the average RBC leaves the circulation (mean potential lifespan), t equals the sample time in days, and k equals the rate of random removal.
To evaluate whether the premature removal of RBCs was the result of RBC characteristics only or depended on other factors in the mice, we labeled RBCs ex vivo and monitored their survival in normal mice (Figure 5B). Infusion of biotinylated RBCs in the tail vein resulted in 7% to 10% biotinylated RBCs in the population. The data were normalized to express the percentage of biotinylated cells relative to time zero. The survival of ex vivo–labeled normal RBCs in control mice (Figure 5B) was virtually identical to the results shown in Figure 5A for in vivo biotinylated cells. Our data again indicated a linear replacement (k = 0; R = 0.99), with an potential lifespan (T) of 34.5 days, or a turnover of approximately 2.9% per day resulting in a half-life of 17 days. In contrast,p45nf-e2−/− RBCs also had a reduced survival in control mice. Again, random RBC removal was observed. The extinction time (T) was still about 30 days, but extra destruction was also observed (k = 0.03; R = 0.99), and it resulted in a half-life of 11 days. Although survival ofp45nf-e2−/− RBCs in C57 mice was reduced compared with normal RBCs, the difference was less pronounced compared with the survival of p45nf-e2−/− RBCs inp45nf-e2−/− mice. These findings suggest that the reduced survival in the mutants may have 2 components—one inherent in the RBC and one resulting from other factors, such as bleeding and splenomegaly, in the mice.
Expression of catalase gene is reduced in p45NF-E2–deficient RBCs
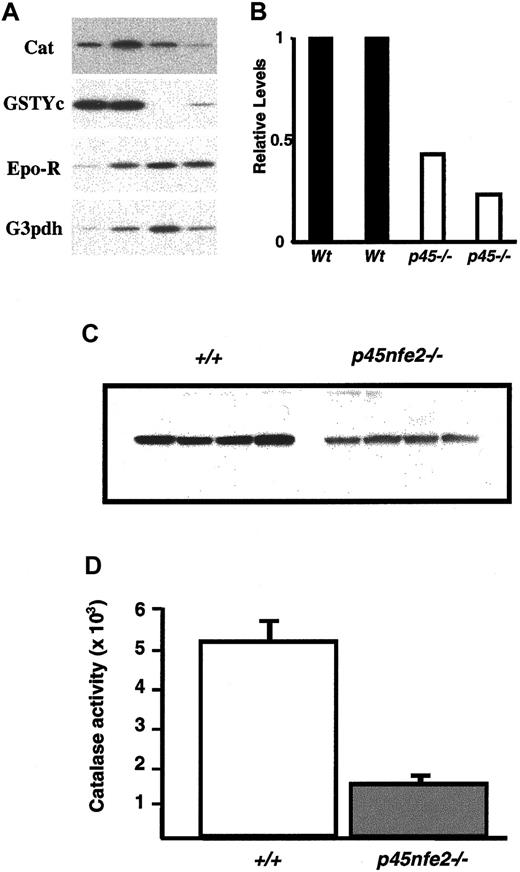
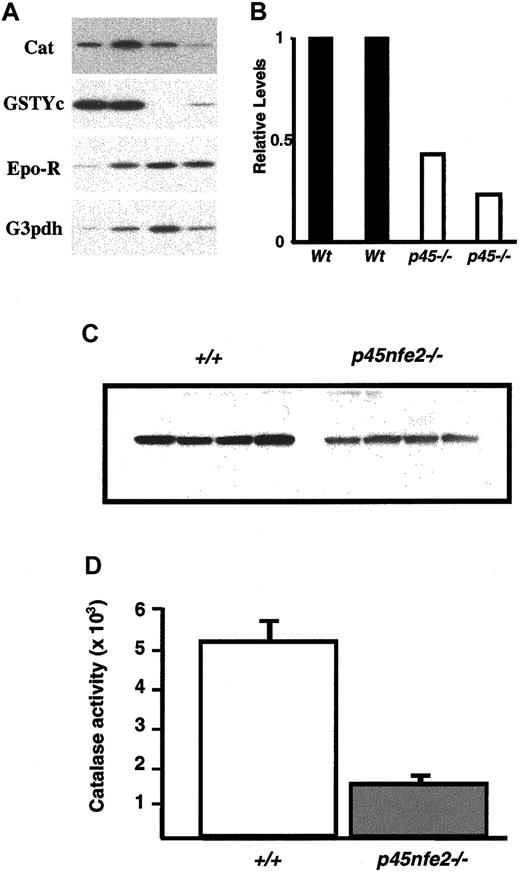
To begin to define the molecular basis of the increased sensitivity to oxidants in mutant RBCs, we measured mRNA levels of various genes involved in protecting RBCs from oxidative stress. Total RNA from sorted Ter-119+ cells of wild-type andp45nf-e2−/− mice was prepared and analyzed by RT-PCR. In mutant Ter-119+ cells, the transcripts encoding the GST-Yc and NQO1 genes were reduced in comparison to wild-type cells (Figure 6A and data not shown). RT-PCR also revealed reduced catalase levels in mutant Ter-119+cells. The reduction in the catalase mRNA was accompanied by a significant decrease in catalase protein and activity in RBCs fromp45nf-e2−/− mice (Figure 6). In contrast, we did not detect significant differences in transcripts encoding the glutathione synthesis genes (data not shown). The reduction in catalase is a possible mechanism for the diminished capacity of the RBCs to deal with oxidants.
Decreased expression of oxidative stress genes in
p45nfe2−/−mice.(A) RT-PCR analysis of sorted Ter-119+ cells. Ter-119+ cells were isolated from the spleen and bone marrow of mice. Each lane represents pooled samples from 3 to 5 animals. RT-PCR results for the indicated genes are shown. (B) Quantitative analysis of catalase mRNA expression in Ter-119+ cells. Radioactive signals from the RT-PCR were quantitated by phosphoimaging analysis using MacBAS software, version 2.5. Values were normalized on the basis of results for the loading control erythropoietin receptor. Expression levels are shown relative to the signal for sample 1, which was assigned an arbitrary expression level of 1. (C) Western blot analysis of wild-type andp45nf-e2−/− RBC extracts using a catalase-specific antibody. (D) Catalase activity in RBCs of wild-type and p45nf-e2−/− mice.
Discussion
Mature RBCs are particularly prone to oxidative damage because they are constantly exposed to high levels of oxygen. In addition, iron released from hemoglobin can be deleterious because it acts as a catalyst for generation of hydroxyl radicals by means of Fenton-type reactions.39,40 Moreover, mature RBCs have a limited capacity to replace damaged proteins by de novo synthesis, and they must circulate for an extended period in the body. Under normal circumstances, however, RBCs are protected against oxidative damage with its complement of antioxidant enzymes and molecules. The importance of the protective mechanisms of RBCs is evident from a consideration of human hemolytic disorders due to a variety of enzyme deficiencies involving pathways that maintain intracellular reductive molecules.27,41-44 Deficiencies compromising the capacity to detoxify oxidant molecules such as H2O2 and oxygen radicals result in oxidant-induced denaturation of intracellular molecules and premature destruction of RBCs. Thus, patients with deficiencies in glutathione synthesis also have hemolytic anemia, as well as other disorders.45,46 Presumably, the failure to maintain glutathione levels compromises antioxidant defenses and ultimately results in oxidative destruction of RBCs. Other enzymopathies that might compromise intracellular reductive capacity have also been described; they include abnormalities involving glutathione peroxidase and glutathione reductase activity.41,44,47 48 However, the cause and effect relations in these abnormalities remain unknown.
Although it is clear that antioxidants play an important role in protecting cells, knowledge of the molecular mechanisms that regulate their expression in RBCs is limited. Expression of a variety of genes encoding antioxidant enzymes is mediated partly by acis-active DNA element designated the ARE.4Although several proteins bind the ARE, factors mediating expression of genes controlled by the ARE have not been identified. Among possible factors, Nrf1 and Nrf2 were implicated as playing a part in ARE-mediated regulation of antioxidant gene expression. In transfection studies, Nrf1 and Nrf2 activated expression of a human NQO1 promoter plasmid that contained an ARE.49 In our study investigating the role of Nrf1 in the oxidative-stress response, we demonstrated that nrf1−/− fibroblasts are sensitive to the toxic effects of oxidative-stress–inducing compounds.24 One basis for this enhanced sensitivity is reduced expression of genes encoding enzymes involved in glutathione synthesis. Our results support a direct role for Nrf1 in the regulation of the glutamylcysteine synthetase–regulatory subunit gene and also implicate glutathione synthetase as a downstream target for Nrf1. These findings in turn suggest a basis for a correspondingly low glutathione concentration and reduced stress response innrf1−/− cells. Analogously,nrf2−/− fibroblasts also have reduced glutathione levels and are sensitive to oxidants (unpublished data). Although Nrf2 knockout mice are viable and fertile,25homozygous nrf2 mutants were found to have diminished expression of GST and NQO126 and to be sensitive to the toxic effects of the butylated hydroxytoluene antioxidant.50 The widespread expression of Nrf1 and Nrf2 suggests that these CNC factors might be important in regulating oxidative-stress genes in various organs. Given these findings, it is reasonable to believe that p45NF-E2, as the principal CNC-bZIP factor in erythroid cells, plays a similarly important role in regulating expression of genes involved in maintaining redox status in RBCs.
This study found an additional phenotype in p45NF-E2–deficient mice. We identified a role for p45NF-E2 in protecting RBCs from oxidative stress. Our in vitro analysis made it clear that RBCs fromp45nf-e2−/− mice have elevated levels of reactive oxygen intermediates. Moreover, methemoglobin formation was induced readily in these cells, and this was associated with a marked decrease in membrane deformability. The severe anemia that resulted from treatment with phenylhydrazine indicates that mutant animals are prone to oxidant-induced hemolysis in vivo, and results obtained from the RBC survival studies support the idea that the turnover rates of p45NF-E2–deficient RBCs are increased compared with those of normal cells. The results of our survival study appear to be at odds with a study that showed normal clearance of mutant RBCs,51 but we do not know the reason for the difference between studies. It may be related to the different methods or mouse stocks used. In our study, control mice had the same background as the mutant mice. Nevertheless, the data overall support the idea that RBCs derived fromp45nf-e2−/− mice are prone to oxidant-induced damage and premature removal from the circulation, and we could not rule out the possibility that the erythroid abnormalities observed in the mutant mice were consequences of oxidative damage.
It is possible that the inability to maintain reducing power observed in this study was caused by abnormalities in p45NF-E2–deficient RBCs that have not yet been characterized. Alternatively, the reduced capacity to deal with oxidative stress might involve diminished activity in various antioxidant enzymes or reflect a diminished reserve in the reductive capacity in mutant RBCs. Because of findings from analyses of other CNC knockouts, we believe that the increase in sensitivity results from decreased expression of oxidative-stress response genes. Considering that Nrf1 was found to play a role in regulating glutathione synthesis, it seems likely that p45-NFE2 assumes this role in RBCs. However, we were unable to consistently detect differences in the expression of glutathione synthase and glutamylcysteine synthetase genes in this study. The finding that GST and catalase genes are down-regulated in mutant RBCs provides a possible explanation for a molecular basis for the observed sensitivity to oxidant compounds. The promoters for NQO1 and various GSTs are regulated by AREs; however, a role for AREs in the regulation of catalase and GST-Yc has not been reported. We believe our findings suggest that p45NF-E2 has an important role in maintaining redox status in RBCs through regulating expression of various antioxidant genes under the control of the ARE. We previously found that catalase has an essential role in the detoxification of H2O2-derived radical species in the RBC.52 A reduction in catalase activity would therefore be one important factor in the sensitivity of the RBCs ofp45nf-e2−/− mice to oxidant stress. It is likely that expression of a broad set of other enzymes is also affected. Further understanding will require identification of other downstream targets of p45NF-E2 in the exact oxidative-stress response pathway. The p45nf-e2−/− mice may be useful models for examining hemolytic disorders.
We thank members of the laboratory and Y. W. Kan for reading the manuscript and Paul Dazin for technical assistance with flow cytometry.
Supported by grants DK50267 and DK02603 from the National Institutes of Health.
The publication costs of this article were defrayed in part by page charge payment. Therefore, and solely to indicate this fact, this article is hereby marked “advertisement” in accordance with 18 U.S.C. section 1734.
References
Author notes
J. Chan, 533 Parnassus Ave, Rm U442, University of California, San Francisco, San Francisco, CA 94143-0793; e-mail: jchan@socrates.ucsf.edu.

