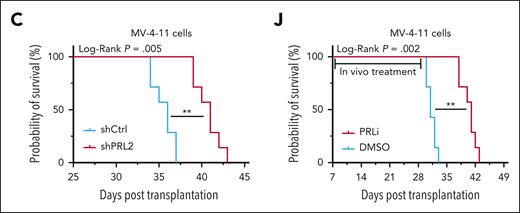
Page 252: In Figure 5C, the red graph curve should be blue (representing shCtrl) and the blue curve should be red (representing shPRL2). In Figure 5J, both the colors of the curves and the colors in the color legend in the graph should be reversed so that red denotes PRLi and blue denotes DMSO. In the description of panel C in the figure legend, “n = 7 mice group” should read “n = 7 mice per group.” The corrected Figure 5C and J are shown below.
Genetic and pharmacological inhibition of PRL2 decreases leukemia burden and extends the survival of mice transplanted with human leukemia cell lines. (C) Kaplan-Meier survival curve of sublethally irradiated NSG mice transplanted with 3 × 10⁶ MV-4-11 cells expressing shCtrl or shPRL2 (n = 7 mice per group). (J) Kaplan-Meier survival curve of NSG mice treated with DMSO or PRLi (n = 7 mice per group). DMSO, dimethyl sulfoxide; PRLi, PRL inhibitor; shCtrl, control shRNA.
Genetic and pharmacological inhibition of PRL2 decreases leukemia burden and extends the survival of mice transplanted with human leukemia cell lines. (C) Kaplan-Meier survival curve of sublethally irradiated NSG mice transplanted with 3 × 10⁶ MV-4-11 cells expressing shCtrl or shPRL2 (n = 7 mice per group). (J) Kaplan-Meier survival curve of NSG mice treated with DMSO or PRLi (n = 7 mice per group). DMSO, dimethyl sulfoxide; PRLi, PRL inhibitor; shCtrl, control shRNA.
Page 254: In Figure 6E, both the colors of the curves and the colors in the color legend in the graph should be reversed so that red denotes PRLi and blue denotes DMSO. The corrected Figure 6E is shown below.
Pharmacological inhibition of PRL2 reduces leukemia burden and extends the survival of mice transplanted with primary human AML cells. (E) Kaplan-Meier survival curve of NSG mice transplanted with 4 × 10⁶ human CD45+ leukemia cells (AML3179) following 3 weeks of DMSO or PRLi treatment (n = 6 mice per group).
Pharmacological inhibition of PRL2 reduces leukemia burden and extends the survival of mice transplanted with primary human AML cells. (E) Kaplan-Meier survival curve of NSG mice transplanted with 4 × 10⁶ human CD45+ leukemia cells (AML3179) following 3 weeks of DMSO or PRLi treatment (n = 6 mice per group).


