

Background: At its introduction in 2001, the list price of imatinib was $26,400/y; in February 2016, just prior to the transition to the generic status, the list price had risen to $120,000/y. While a transition to generic status was projected to reduce the list price, the magnitude and rate of decline in a real-world setting remains unknown. Further, the pricing patterns of 2nd generation TKIs (dasatinib and nilotinib) pre- to post- imatinib generic transition are not known. We address these gaps in this report.
Methods: Truven Health MarketScan Database was used to determine the monthly drug expenditures for 1155 patients with CML diagnoses between 9/1/2014 and 11/30/2017 and receiving imatinib, nilotinib, or dasatinib as single agents. Patients were either commercially insured (n=977) or insured by Medicaid (n=178); median age at diagnosis was 50y; 54% were males. Expenditure for 30-day blocks/patient for imatinib, dasatinib, or nilotinib was calculated and pricing was adjusted via consumer price index for medical services in 2017. A single interrupted time series (ITS) method evaluated imatinib monthly expenditures for the health plan from 9/1/2014 to 11/30/2017, with imatinib switching to generic at 2/1/2016 as the "interruption". The initial six-month period post-interruption was excluded to allow for the new price structure to stabilize, resulting in a post-interruption period of observation from 8/1/2016 to 11/30/2017 (generic phase). Nilotinib and dasatinib were evaluated using a comparative ITS design.
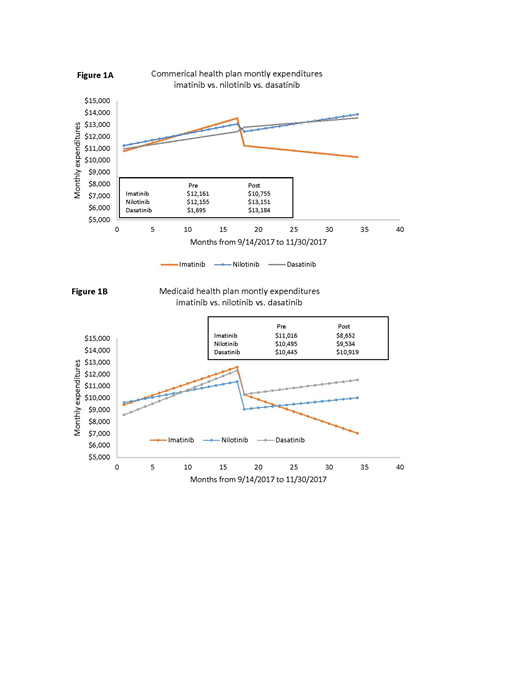
Results: Pre-generic vs. generic imatinib: As shown in Figures 1A and 1B, there was a significant (p<0.001) pre-generic increase in expenditure (commercial insurance: $173/patient/month, p<0.001; Medicaid: $199/patient/month, p=0.001). Controlling for secular trends, there was a statistically significant (p<0.001) reduction over the 6-month interruption (2/2016-8/2016: between the pre-generic and generic phase: commercial: $2,255/patient; Medicaid: $2,125/patient). This was followed by a continued small decline in expenditure during the generic phase (commercial, -$60/month/patient; p=0.04; Medicaid: -$203/month/patient; p=0.001). The annual health plan expenditure for imatinib during 2017 was estimated at $116,324. Difference-in-difference of slopes from pre-generic to generic phase (imatinib vs. nilotinib; imatinib vs. dasatinib): As shown in Figures 1A and 1B, the monthly per patient expenditures associated with both nilotinib and dasatinib maintained an increasing trend in both the pre-generic and generic phase of imatinib, resulting in a significant difference-in-difference slope for both commercially-insured patients (nilotinib: $-211, p=0.002; dasatinib: $-192, p=0.003) and Medicaid patients (nilotinib: $-350, p=0.002; dasatinib: $-243, p<0.001). This indicates that nilotinib and dasatinib had a greater magnitude of increase in expenditure from 2014 to 2017 than the decline in expenditure for imatinib for the same time period.
Conclusion: After the switch to generic, the monthly expenditure for imatinib declined; the decline was steeper for Medicaid patients than commercially-insured patients. Although the proportions of patients receiving brand name versus generic imatinib are not known, the percent change in Imatinib expenditure over the time period analyzed was modest. Nilotinib and dasatinib health plan expenditure demonstrated a continued increase over time.
No relevant conflicts of interest to declare.

