Abstract
Background: Chronic lymphocytic leukemia displays an extremely variable clinical behaviour. The availability of effective first-line regimens and recent data on the efficacy of novel molecules targeting B-cell receptor (BCR) signalling make prognostication and prediction of response to treatment a mandatory exercise in clinical practice. A plethora of prognostic biomarkers have been identified, but few of them were validated by multivariable analysis in the context of prospective studies.
Methods: Based on previous analyses, 18 biomarkers known to have prognostic significance were included in this survey: stereotyped receptors and BCR subsets, CD38, ZAP70, CD49d, IGHV gene mutational status, 17p-/TP53 mutations, 11q-, telomere length, complex karyotype, NOTCH1 and SF3B1 mutations, age, gender, performance status (PS), stage, lymphocytosis, beta-2-microglobulin, thymidine kinase (TK).
A literature search was performed to identify reports describing the prognostic impact of each biomarker. Twenty-one papers fulfilling the following stringent requirements were included in this analysis: i) thorough assessment of the main known prognostic parameters, i.e. salient clinical and genetic data; ii) prospective design of the study (clinical trial) or single/multicentre study using a learning cohort and a validation cohort.
Each prognostic marker was analysed: i) as a prognostic factor, with reference to its impact on time to first treatment (TTFT), complete response (CR) rate, progression free survival (PFS) and overall survival (OS); ii) as a predictive factor, in terms of response to specific treatment and transformation into Richter's syndrome.
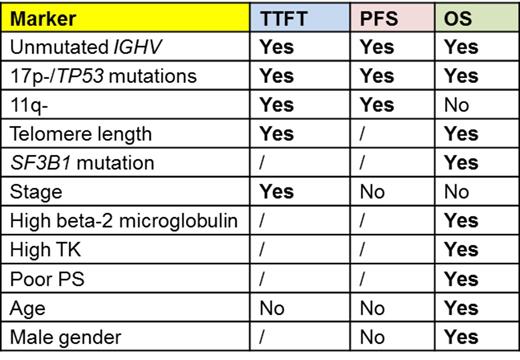
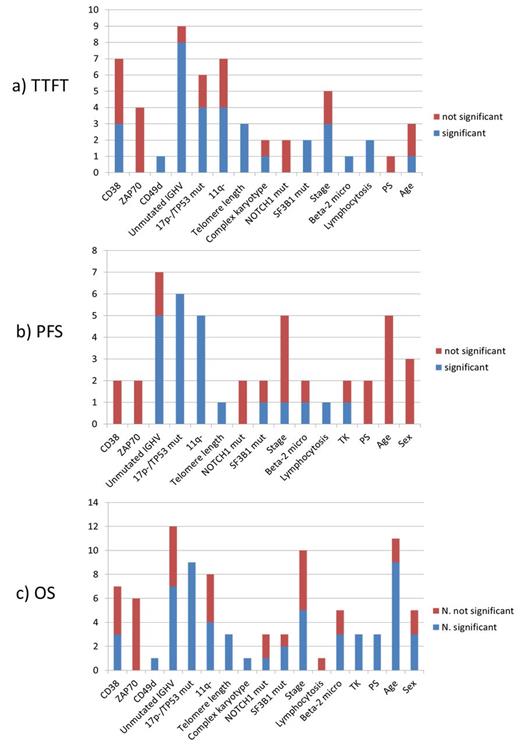
Results: Sixteen of the 18 parameters showed unfavourable prognostic significance in at least 1 study (Figure 1). No paper fulfilling our stringent inclusion criteria was found to address the impact of stereotyped BCR or BCR subsets and ZAP70 expression did not show independent significance in any of the selected studies. Eleven parameters showed unfavourable impact on TTFT, PFS and/or OS in at least 2/3 of the selected studies (Table 1), thus representing reproducible markers of outcome. 17p-/TP53 mutations and unmutated IGHV proved independent predictors for all outcome measures in the majority of the studies; the same applies to 11q- for TTFT and PFS and serum beta-2-microglobulin for OS (Figure 1). Telomere length proved a reproducible predictor of outcome, but the detection method is not standardized yet. No univocal data emerged from our survey on the predictivity of NOTCH1 and SF3B1 mutations. Host characteristics such as poor PS, advanced age and gender maintained a relevant role in predicting OS (Figure 1).
Even though no paper with the required characteristics was found to address the impact of biomarkers on evolution to Richter's syndrome and on response rate, available evidence points to a role for 17p-/TP53 mutations in identifying cases with an inferior CR rate, that was not assessed by multivariable analysis.
Conclusions: This review shows that 17p-/TP53 mutations and unmutated IGHV are to be considered the most reliable markers for usage in clinical practice. 11q- has a solid prognostic impact but lost its predictivity on OS in patients eligible to modern chemoimmunotherapy regimens. Beta-2 microglobulin levels along with basic patient's characteristics strongly correlate with OS, while measures of disease burden do not retain a prognostic role. The prognostic significance of CD38 and ZAP70 was overcome by more robust genetic parameters. Adequate clinical trials are needed to assess the impact of biomarkers on predicting response to specific treatments.
Markers with unfavourable prognostic significance for one or more outcome measures in at least 2/3 of the studies (out of a total of at least 3 studies).
Markers with unfavourable prognostic significance for one or more outcome measures in at least 2/3 of the studies (out of a total of at least 3 studies).
Number of studies assessing the impact of each parameter in terms of a) TTFT; b) PFS; c) OS: the blue part of each column represents the number of studies showing negative impact on prognosis; the red part represents the number of studies showing no prognostic impact.
Number of studies assessing the impact of each parameter in terms of a) TTFT; b) PFS; c) OS: the blue part of each column represents the number of studies showing negative impact on prognosis; the red part represents the number of studies showing no prognostic impact.
Cuneo:Roche: Speakers Bureau; Gilead: Speakers Bureau; Jannsen: Speakers Bureau; Celgene: Speakers Bureau; Novartis: Speakers Bureau.
Author notes
Asterisk with author names denotes non-ASH members.


