Abstract
Introduction
It has previously been suggested that the tumor microenvironment in diffuse large B-cell lymphoma (DLBCL) has prognostic significance. Furthermore, gene expression profiling in DLBCL patients has identified separate subsets with glycolytic and mitochondrial (oxidative phosphorylative) metabolic signatures. Glycolytic metabolism forms the basis for FDG PET scans, widely used in staging and response assessment in DLBCL. While many assume that the tumor as a whole is primarily glycolytic, the metabolic patterns of cancer cells (C) and surrounding cancer-associated stromal cells (CAS) remain relatively unknown. We investigated the in situ metabolic patterns of C and CAS cells as well as tumor-associated macrophages (TAM) in DLBCL.
Methods
All patients diagnosed with DLBCL at Thomas Jefferson University from 2009-12 with available diagnostic tissue (N=28) were studied. Two immunohistochemical (IHC) biomarkers of metabolism were used as stains. Monocarboxylate transporter 4 (MCT4) shuttles glycolysis-derived lactate out of the cell and is a biomarker for glycolysis. Translocase of the outer mitochondrial membrane 20 (TOMM20) is a biomarker for mitochondrial mass, i.e. the oxidative phosphorylation phenotype. The horseradish immunoperoxidase method was used to stain 5 μm thick, paraffin-embedded tissue samples, using TOMM20 and MCT4 antibodies (Santa Cruz). Immunostains were graded on a scale of 0 to 2+ based on the intensity and percentage of immunoreactivity in C, CAS, and TAM cells. Available clinical data collected by chart review included SUVmax (SUVm) on PET/CT scan, R-IPI, treatment regimen, complete response (CR) rates and Ki-67. Fisher's exact test was used to test for association among categorical variables.
Results
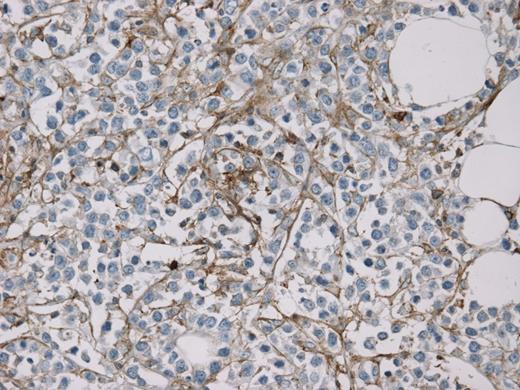
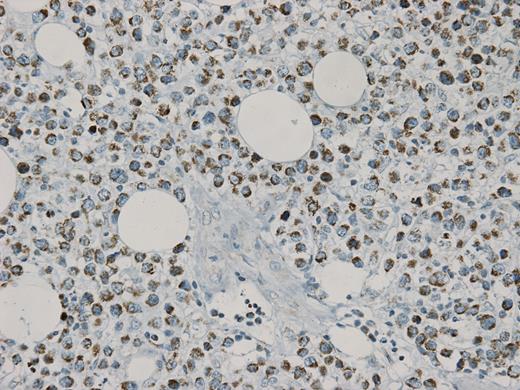
Cancer cells in 27/28 samples (96%) stained 2+ for TOMM20, with one sample staining 1+. MCT4 expression was completely absent in C cells in all samples. Conversely, TOMM20 was either not expressed (46%) or had 1+ expression (54%) in CAS and TAM. MCT4 expression was 2+ in 46% of CAS and 75% of TAM, and 1+ in the CAS and TAM of the remaining samples. Reactive lymphocytes (RL) had no MCT4 expression and uniform 1+ TOMM20 expression and can be regarded as internal controls. Levels of MCT4 expression in CAS correlated with MCT4 expression in TAM in the same patient (p=0.0069). 16/28 patients (57%) attained CR with anthracycline/rituximab based frontline therapy. MCT4 staining in CAS/TAM was associated with better CR rates with increasing intensity of scoring. (1+/1+ < 1+/2+ < 2+/2+; p=0.032).
| S.No . | Stage . | R-IPI . | TOMM20 . | MCT4 . | SUVm . | CR . | ||||||
|---|---|---|---|---|---|---|---|---|---|---|---|---|
| C . | CAS . | TAM . | RL . | C . | CAS . | TAM . | RL . | |||||
| 1 | 4 | P | 2+ | 1+ | 1+ | 1+ | 0 | 2+ | 2+ | 0 | 19.82 | Y |
| 2 | 4 | * | 2+ | 0 | 0 | 1+ | 0 | 1+ | 2+ | 0 | * | N |
| 3 | 4 | G | 2+ | 1+ | 1+ | 1+ | 0 | 2+ | 2+ | 0 | 19.00 | N |
| 4 | * | * | 2+ | 1+ | 1+ | 1+ | 0 | 2+ | 2+ | 0 | * | Y |
| 5 | 4 | G | 2+ | 0 | 0 | 1+ | 0 | 1+ | 2+ | 0 | 3.50 | Y |
| 6 | 4 | P | 2+ | 0 | 0 | 1+ | 0 | 1+ | 2+ | 0 | 18.80 | N |
| 7 | 4 | P | 2+ | 1+ | 1+ | 1+ | 0 | 2+ | 2+ | 0 | * | Y |
| 8 | 4 | P | 2+ | 1+ | 1+ | 1+ | 0 | 2+ | 2+ | 0 | 16.51 | N |
| 9 | 4 | * | 2+ | 0 | 0 | 1+ | 0 | 1+ | 2+ | 0 | 42.19 | Y |
| 10 | * | * | 2+ | 1+ | 1+ | 1+ | 0 | 1+ | 1+ | 0 | * | N |
| 11 | 4 | G | 1+ | 0 | 0 | 0 | 0 | 1+ | 1+ | 0 | * | Y |
| 12 | 2 | VG | 2+ | 1+ | 1+ | 1+ | 0 | 2+ | 2+ | 0 | 30.72 | Y |
| 13 | 4 | P | 2+ | 0 | 0 | 1+ | 0 | 1+ | 1+ | 0 | * | N |
| 14 | 4 | P | 2+ | 1+ | 1+ | 1+ | 0 | 2+ | 2+ | 0 | 32.00 | N |
| 15 | 4 | * | 2+ | 0 | 0 | 1+ | 0 | 1+ | 2+ | 0 | 17.31 | Y |
| 16 | 4 | G | 2+ | 0 | 0 | 1+ | 0 | 1+ | 2+ | 0 | 7.90 | Y |
| 17 | 2 | * | 2+ | 1+ | 1+ | 1+ | 0 | 2+ | 2+ | 0 | 16.52 | Y |
| 18 | 4 | P | 2+ | 0 | 0 | 1+ | 0 | 2+ | 2+ | 0 | 38.90 | Y |
| 19 | 4 | G | 2+ | 1+ | 1+ | 1+ | 0 | 1+ | 1+ | 0 | 31.00 | N |
| 20 | 4 | G | 2+ | 0 | 0 | 1+ | 0 | 1+ | 1+ | 0 | 27.00 | N |
| 21 | 4 | * | 2+ | 0 | 0 | 1+ | 0 | 1+ | 2+ | 0 | 12.68 | Y |
| 22 | 4 | * | 2+ | 1+ | 1+ | 1+ | 0 | 2+ | 2+ | 0 | * | Y |
| 23 | 4 | P | 2+ | 1+ | 1+ | 1+ | 0 | 1+ | 1+ | 0 | 6.99 | N |
| 24 | 4 | P | 2+ | 1+ | 1+ | 1+ | 0 | 2+ | 2+ | 0 | 26.91 | Y |
| 25 | 1 | * | 2+ | 0 | 0 | 1+ | 0 | 1+ | 1+ | 0 | 20.86 | N |
| 26 | 4 | P | 2+ | 0 | 0 | 1+ | 0 | 2+ | 2+ | 0 | 9.80 | Y |
| 27 | 4 | G | 2+ | 1+ | 1+ | 1+ | 0 | 2+ | 2+ | 0 | 23.50 | Y |
| 28 | 4 | P | 2+ | 1+ | 1+ | 1+ | 0 | 1+ | 2+ | 0 | * | N |
P=poor G=good VG=very good *=NA
Conclusions
Cancer cells in DLBCL do not express MCT4, but instead strongly express TOMM20, suggesting an oxidative phosphorylative rather than a glycolytic metabolic phenotype. Conversely, CAS and TAM always express MCT4, suggesting a glycolytic phenotype. Glycolysis and lactate export in CAS/TAM may be spatially related with mitochondrial metabolism in cancer cells, indicating tumor-stromal metabolic coupling. Glycolytic stroma in DLBCL may contribute to the PET-avidity in these tumors. Increasing MCT4 staining in CAS and TAM was associated with better CR rates, perhaps indicating tumors with increased chemosensitivity. Further investigation of the underlying mechanisms are needed to develop a better understanding of tumor-stromal interaction and its possible role in treatment of DLBCL.
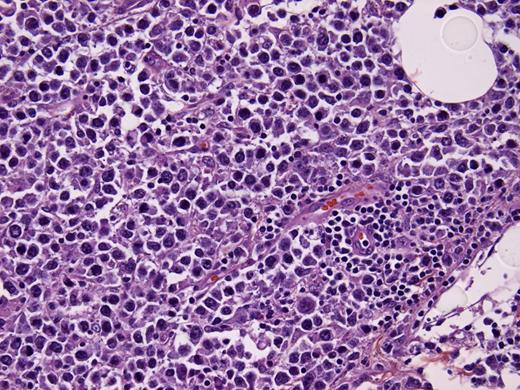
H&E (40x). Tissue sample (study patient) showing cancer cells admixed with stromal elements
H&E (40x). Tissue sample (study patient) showing cancer cells admixed with stromal elements
MCT4 stain (40x) demonstrating exclusive staining of stromal cells, sparing cancer cells
MCT4 stain (40x) demonstrating exclusive staining of stromal cells, sparing cancer cells
TOMM-20 stain (40x) demonstrating 2+ staining of cancer cells, sparing stromal cells
TOMM-20 stain (40x) demonstrating 2+ staining of cancer cells, sparing stromal cells
Pro:Seattle Genetics: Consultancy, Other: Travel expenses, Research Funding; Takeda: Honoraria, Other: Travel expenses.
Author notes
Asterisk with author names denotes non-ASH members.


