Abstract
Introduction: Traditional prognostic factors for adult acute lymphocytic leukemia (ALL) include age, white blood count at diagnosis, and cytogenetic (CG) risk. We sought to identify a more detailed prognostic risk score for newly diagnosed adult patients (pts) based on these and other pre-treatment characteristics.
Methods: 82 newly diagnosed ALL pts given induction chemotherapy (IC) at our institution between the years 2003-2011 were included, and data were obtained by chart review. Institutional review board approval was obtained. Variables examined included: gender, age, immunophenotype, CG risk, pre-IC body mass index (BMI), pre-IC and day 28 serum albumin, absolute lymphocyte (ALC) and neutrophil (ANC) counts, positive culture (blood or other) during IC, positive imaging suggestive of infection (during IC), and allogeneic hematopoietic cell transplant (AHCT). CG risk was ascribed by CALGB criteria (Blood 1999; 93: 3983). BMI was defined by: underweight (≤ 18.5), normal (> 18.5-25.0), overweight (> 25.0-30.0), moderately obese (> 30.0-35.0), severely obese (> 35.0-40.0), and very severely obese (> 40.0). The primary endpoint was overall survival (OS) which was measured from IC to death or last follow-up. Proportional hazards models were used for univariable and multivariable analyses. In the multivariable analysis stepwise variable selection was used to identify independent predictors. Results were internally validated using a bootstrap algorithm. For convenience measured factors were discretized using a recursive partitioning algorithm. Prognostic groups were formed by assigning “points” to each factor that were based on the magnitude of the estimated regression coefficients of the final model, and then summing the total number of points present.
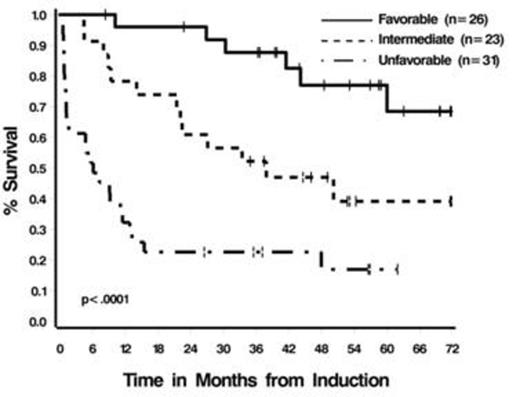
Results: Median age at diagnosis was 43 yrs (range 18-78); 58% male. 71% of pts (58/82) had a B-cell immunophenotype. CG risk included: normal: 15 pts (18%), high: 41 pts (50%), miscellaneous: 9 pts (11%), and unknown: 17 pts (21%). Twenty-four pts (29%) were Ph+. The majority of pts (70%: 57/82) received the CALGB 19802 regimen (Cancer 2013; 119: 90) for IC +/- a tyrosine kinase inhibitor (if they were Ph+). 27% of pts (22/ 82) received AHCT in CR1. Estimated median OS is 41.5 months (95% CI: 15.5-N/A). In univariable analysis age, pre-induction BMI, Day 28 ALC, pre- and Day 28 albumin, Day 28 ANC, Day 28 platelet count, evidence of infection, and CG risk were all seen to impact outcome. In multivariable analysis pre-IC BMI and albumin, age, and Day 28 ALC were identified as independent predictors. Assigning 1 “points” each for age >50, albumin prior to IC ≤ 3.2 g/dL, or Day 28 ALC ≤ 50 /uL and 2 points for BMI ≥ 35, 3 prognostic groups were defined: favorable (0 points) 32% of pts (26/80): estimated 5-yr OS of 68% +/-11%; intermediate (1 points) (29% of pts, 23/80): estimated 5 yr OS of 39% +/-11%, and unfavorable (≥ 2 points) (39% of pts, 31/80) with estimated 5 yr OS of 17% +/- 7% (Figure 1).
Conclusion:
We have constructed a simple prognostic model for newly diagnosed adults with ALL. This model will need to be validated in a larger group of uniformly treated patients.
Prognostic Factors for OS in Univariable and Multivariable Analysis
| Factor . | Univariable (HR (95% C.I.)) . | Multivariable (HR (95% C.I.)) . |
|---|---|---|
| Age at dx (≤50 vs. >50) | 3.29 (1.80-5.99), p=.0001 | 2.83 (1.45-5.53), p=.002 |
| Pre-IC BMI (<35 vs. >35) | 2.95 (1.57-5.52), p=0.0008 | 3.88 (1.84-8.17), p=.0004 |
| Pre-IC albumin (≥ 3.2 vs. < 3.2 g/dl) | 2.61 (1.43-4.77), p=0.002 | 2.66 (1.33-5.30), p=.0006 |
| Day 28 ALC (> 50/uL vs. ≤50/uL) | 3.57 (1.61-7.91), p=0.002 | 3.11 (1.33-7.28), p=.009 |
| CG risk | 2.03 (0.98-4.22); p=0.06 | ------ |
| Day 28 albumin (>2.3 vs. ≤2.3 g/dl) | 3.37 (1.66-6.83), p=0.0008 | ------ |
| Day 28 ANC (>200/uL vs. ≤200/uL) | 4.51 (1.94-10.51), p=.0005 | ------ |
| Day 28 platelets (>75K/uL vs. ≤75K/uL) | 2.44 (1.26-4.72), p=.008 | ------ |
| Any positive culture (no vs. yes) | 2.19 (1.19-4.04), p=0.01 | ------ |
| Blood culture positive for bacteria (no vs. yes) | 2.34 (1.28-4.30), p=0.006 | ------ |
| Positive imaging suggestive of infection (no vs. yes) | 2.44 (1.34-4.46), p=0.004 | ------ |
| Positive blood culture and image (no vs. yes) | 1.96 (1.07-3.57), p=0.03 | ------ |
No relevant conflicts of interest to declare.
Author notes
Asterisk with author names denotes non-ASH members.


