Abstract
C-type lectin-like receptor 2 (CLEC-2) is an essential platelet-activating receptor in hemostasis and thrombosis that is activated by the snake venom rhodocytin. We present here a differential proteomic analysis of basal and rhodocytin-activated platelets with the aim of providing novel clues on CLEC-2 signaling regulation. Proteome analysis was based on 2D-DIGE, phosphotyrosine immunoprecipitations followed by 1D SDS-PAGE and mass spectrometry. Protein-protein interactions were studied by coimmunoprecipitations and a systems biology approach. Overall, we identified 132 proteins differentially regulated after CLEC-2 platelet activation, including most of the major players reported so far in the signaling cascade. In addition, we identified various proteins not previously known to participate in CLEC-2 signaling, such as the adapters Dok-2 and ADAP, tyrosine kinase Fer, and tyrosine phosphatase SHIP-1. We also report an increased association between Dok-2 and SHIP-1 in rhodocytin-stimulated platelets, which might negatively regulate CLEC-2 signaling. Moreover, we also present a comparative analysis of proteomic data for CLEC-2 and glycoprotein VI signaling. We think that our data provide thrombosis-relevant information on CLEC-2 signaling regulation, contributing to a better understanding of this important signaling cascade.
Introduction
During the past decade, platelet proteomics has allowed the identification of a number of novel receptors and signaling proteins1 whose functions and interactions with other molecules are highly relevant for platelet activation and aggregation. One of those novel platelet receptors, which was discovered in a cooperative endeavor of several groups, including ours,2 is CLEC-2, a C-type lectin-like type II transmembrane receptor originally identified in immune cells.3 CLEC-2 is the molecular target for rhodocytin, a very potent platelet-activating protein isolated from the venom of the Malayan pit viper Calloselasma rhodostoma.2 CLEC-2 is highly expressed on platelets, where is present as a dimer,4,5 and at lower levels on other hematopoietic cells. It signals through a cytosolic YxxL sequence known as a hemi-ITAM.6 Recent data indicate that CLEC-2 might be involved in hematogenous tumor metastasis as the receptor mediates tumor cell-induced platelet activation by interacting with podoplanin on the tumor cell surface.7 In addition, CLEC-2 has been identified as being involved in the capture and transfer of infectious HIV-1 by platelets.8 The role of CLEC-2 in thrombosis and hemostasis remains controversial. Some authors proposed that CLEC-2 is playing an essential role,9 whereas data from other researchers suggest that the role is minor.10 Nevertheless, there is no doubt CLEC-2 has an impressive platelet activating potential.
Rhodocytin stimulates phosphorylation of the single YxxL motif of CLEC-2, thereby leading to its association with the SH2 domains of Syk.2,11 Interestingly, phosphorylation of CLEC-2 depends on its localization in lipid rafts, on actin polymerization, and secondary mediators.12
In recent years, we have successfully analyzed some of the most important signaling cascades in human platelets by proteomics,13-16 leading to the identification of novel proteins. We present here a detailed proteome analysis of the CLEC-2 signaling cascade with the aim of depicting the CLEC-2 signalosome and providing novel clues on CLEC-2 signaling regulation. Proteome analysis was based on 2-dimensional differential in-gel electrophoresis (2D-DIGE), and phosphotyrosine immunoprecipitations followed by 1D-SDS-PAGE, for protein separation, and mass spectrometry for protein identification. Validations and protein-protein interactions were studied by immunoprecipitations and Western blotting.
Methods
Reagents, antibodies, and suppliers
Agarose-conjugated and nonconjugated antiphosphotyrosine monoclonal antibodies (clone 4G10) and anti–SLAP-130 polyclonal antibody were purchased from EMD Millipore. Anti-Fer, anti-Btk, anti–Dok-2 polyclonal antibodies, and anti–SHIP-1, and antifibrinogen monoclonal antibodies were purchased from Santa Cruz Biotechnology. Normal mouse and rabbit IgGs, agarose conjugated, were also from Santa Cruz Biotechnology. Sypro Ruby gel stain was purchased from Lonza Group, and Pro-Q Diamond was purchased from Invitrogen. Protein A Sepharose was purchased from GE Healthcare. Tris was purchased from Calbiochem. Unless specifically stated, the suppliers of other chemicals and instruments were the same ones as described previously17,18 or were obtained from Sigma-Aldrich.
Platelet preparation and activation with rhodocytin
Blood was obtained from healthy volunteers who had not taken antiplatelet medication in the previous 10 days. Washed platelets were prepared as described previously, using acid citrate dextrose solution (117mM sodium citrate, 111mM glucose, and 78mM citric acid) as anticoagulant.19 Platelets were resuspended in Tyrode-HEPES (134mM NaCl, 0.34mM Na2HPO4, 2.9mM KCl, 12mM NaHCO3, 20mM HEPES, 5mM glucose, 1mM MgCl2, pH 7.3) at 8 × 10⁸ platelets/mL, and incubated at room temperature for 30 minutes (resting step). Before activation, integrilin (final concentration 9μM; GlaxoSmithKline) was added to prevent platelet aggregation. Aliquots containing 500 μL of platelets were warmed at 37°C for 5 minutes before stimulation with rhodocytin (final concentration 300nM). Unless stated otherwise, stimulations were carried out at 37°C for 5 minutes with constant stirring at 1200 rpm in a 490-2D Chrono-log aggregometer. Unstimulated (basal) samples were treated with rhodocytin diluent (Tris 20mM, pH 8.0). When indicated, platelet stimulations with collagen-related peptide (CRP; final concentration 10 μg/mL) for 90 seconds were also carried out. In some of the validation experiments, inhibitors of the secondary mediators (2 U/mL apyrase and 10μM indomethacin) were added to platelets before stimulations. For the 2D-DIGE analysis, 12 aliquots (6 basal and 6 activated) were immediately frozen in liquid nitrogen, after stimulation, and stored at −80°C. For the phosphotyrosine immunoprecipitation-based proteomic analysis, 12 aliquots (6 basal and 6 activated) were lysed with in an NP-40-based lysis buffer as described previously13 before antiphosphotyrosine immunoprecipitacion.
1D-SDS-PAGE for proteomic analysis
After antiphosphotyrosine immunoprecipitations, proteins were eluted from the beads in Laemmli buffer and pooled into 2 aliquots (ie, basal and stimulated). Samples were run in a 16 × 14 cm 10% SDS-PAGE gel. The gel was stained with Pro-Q diamond to visualize the phosphoproteins and then with Sypro Ruby for total protein staining. Differential bands were manually excised for mass spectrometry (MS) analysis.
2D-DIGE
Proteins were precipitated in 20% trichloroacetic acid in acetone, as previously described.19 Protein pellets were resuspended in 75 μL DIGE buffer (65mM CHAPS, 5M urea, 2M thiourea, 0.15M NDSB-256, 30mM Tris, 1mM sodium vanadate, 0.1mM sodium fluoride, and 1mM benzamidine). Protein quantitation was done with Coomassie Plus protein reagent (Thermo Scientific). In total, 6 gels were run in the experiment. A total of 50 μg of protein from each sample (basal and rhodocytin-activated) was randomly labeled with 400 pmol minimal CyDye DIGE fluors (Cy3 and Cy5), and 50 μg of a pool (25 μg from basal samples and 25 μg from rhodocytin-activated samples) were labeled with 400 pmol Cy2. The labeling protocol is described in detail in supplemental Methods (see the Supplemental Materials link at the top of the article). Therefore, each gel contained 150 μg of mixed labeled protein. For reswelling, samples were diluted in a total of 500 μL of 2D sample buffer (5M urea, 2M thiourea, 2mM tributylphosphine, 65mM DTT, 65mM CHAPS, 0.15 M NDSB-256, 1mM sodium vanadate, 0.1mM sodium fluoride, and 1mM benzamidine), and ampholytes (Servalyt 4-7) were added to a final concentration of 1.6% (volume/volume). First dimension was on immobilized pH gradient strips 4-7, 24 cm (GE Healthcare), and second dimension on 11% SDS-PAGE gels. Further details on the electrophoresis protocol can be found in supplemental Methods. After electrophoresis, gels were scanned directly in a Typhoon 9410 (GE Healthcare).
Differential image analysis
Scanned images were processed with Progenesis SameSpots (Version 4.5) from Nonlinear Dynamics Ltd. Six DIGE gels (pI 4-7) were prepared for both basal and rhodocytin-activated platelets. Both manual and automatic alignment was used to align the images. SameSpots detects the spots simultaneously across all images generating a master gel list containing all the features. This master gel list of detected spots and boundaries is then applied to all the aligned gels, which prevents the loss of any data points and should in principle increase the precision of spot volume estimates. Internal calibration of the 2D-DIGE gel images with regard to pI and molecular weight was carried out with SameSpots built-in tools. All gels were compared with each other, and fold values as well as P values of all spots were calculated by SamesSpots Version 4.5 software using 1-way ANOVA analysis. Differential expression of a protein present in the gels was considered significant when the fold change was at least 1.5 and the P value was < .05.
MS analysis
Differentially regulated spots and bands were excised manually from the gels and in-gel digested with trypsin following the protocol defined by Shevchenko with minor modifications.20 Proteins were reduced with DTT and alkylated with iodoacetamide before trypsin digestion. Protein identifications were by liquid chromotography (LC)–MS/MS and matrix-assisted laser desorption ionization–time of flight (MALDI-TOF)/TOF. For the former, an EASY-nLC (Proxeon, Bruker Daltonik) and a Bruker Amazon ETD ion trap were used. Database search was performed with the Mascot Version 2.3 search tool (Matrix Science) screening SwissProt (release 57.15). MALDI-TOF/TOF analysis was in a 4800 MALDI-TOF/TOF analyzer (Applied Biosystems). Precise details on the MS protocols and database searching parameters can be found in supplemental Methods.
Immunoprecipitation and Western blotting
Basal and stimulated platelets (8 × 10⁸/mL, 500 μL) were lysed as described previously.13 For the tyrosine immunoprecipitation-based proteomic study, 10 μg of agarose-conjugated 4G10 monoclonal antiphosphotyrosine antibody was added to the lysates per immunoprecipitation. For immunoprecipitations related to validation experiments, 4 μg of each antibody was added to the lysates, except in the case of antiphosphotyrosine antibody, where 5 μg was added, and anti–Dok-2 protein-A-Sepharose conjugated antibody, where 3 μg was added. Regarding Western blotting, primary antibodies and their dilutions were as follows: rabbit anti–Dok-2 (1:500), rabbit anti-Fer (1:500), rabbit anti-BTK (1:500), rabbit anti–SLAP-130 (1:500), 4G10 mouse antiphosphotyrosine mAb (1:1000), and mouse anti–SHIP-1 (1:200). Further details on immunoprecipitation and Western blotting protocols can be found in supplemental Methods.
Ingenuity Pathways Analysis
Ingenuity Pathways Analysis software (IPA, Ingenuity Systems, www.ingenuity.com) was used to investigate possible interactions among all the identified proteins. Interactive pathways were generated to observe potential direct and indirect relations among the differentially regulated proteins.
Results
Tyrosine phosphoproteome analysis of CLEC-2–activated platelets
We investigated the proteome of CLEC-2–activated platelets, focusing on tyrosine-phosphorylated proteins. Platelets were activated with the CLEC-2 specific agonist, rhodocytin. Samples were preincubated with integrilin to prevent platelet aggregation and the consequent interference of αIIbβ3 outside-in signaling. Time-course and dose-response experiments were carried out to verify the optimal conditions to achieve maximal tyrosine phosphorylation induced by rhodocytin (not shown). A concentration of 300nM of rhodocytin for 5 minutes was selected for subsequent investigations.
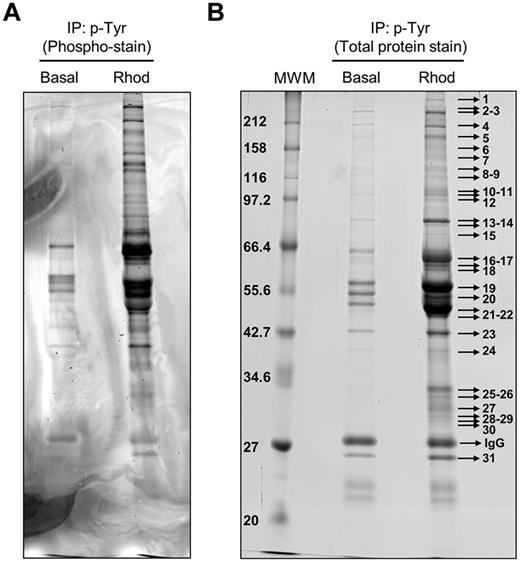
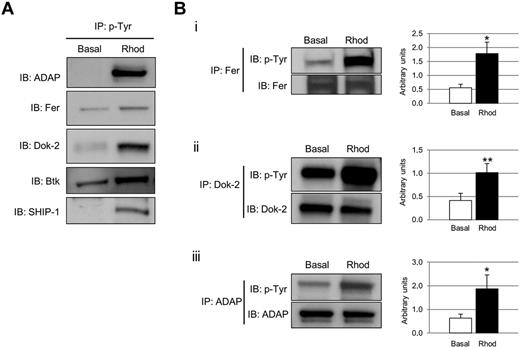
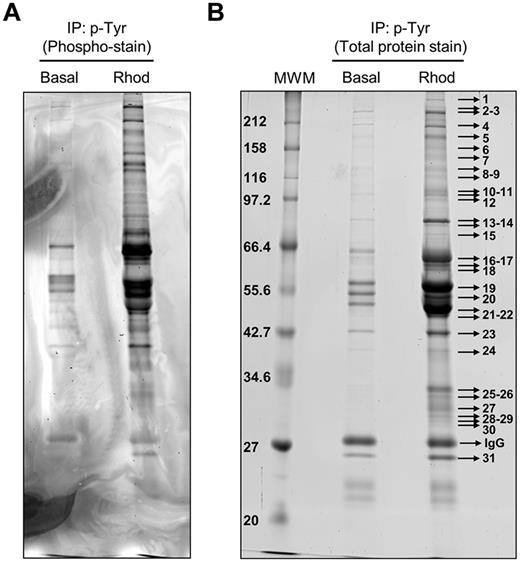
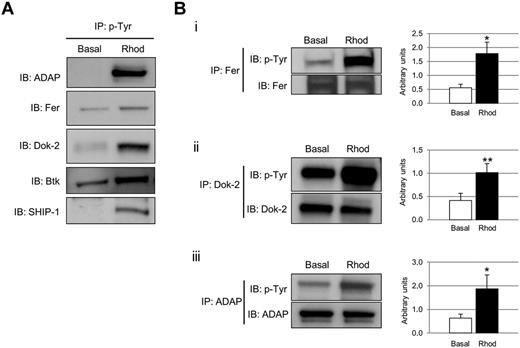
Phosphotyrosine-immunoprecipitated proteins from basal and rhodocytin-stimulated platelets were separated on 10% SDS-PAGE gels and stained with the specific phosphoprotein gel stain Pro-Q Diamond, which detects all sites of protein phosphorylation (Figure 1A). Gels were restained for total protein with the fluorescent dye Sypro Ruby, as described in “Methods” (Figure 1B). Specific bands corresponding to tyrosine-phosphorylated proteins were excised and analyzed by MS. This approach led to the identification of 83 different proteins specifically recruited to a phosphotyrosine signaling complex in response to rhodocytin (Table 1; supplemental Table 1). The majority of proteins identified consisted of cytoskeletal and signaling proteins, which play a fundamental role in platelet activation. Focusing on signaling proteins, this approach identified the major players reported so far in the CLEC-2 signaling cascade, with the main exception of the adapter LAT (Table 1). This group includes receptors (eg, CLEC-2, GPIbα, PECAM-1), adapters (eg, SLP76, GADS), tyrosine kinases (eg, Fyn, Lyn, Src, Syk, Btk), tyrosine phosphatases (eg, CD148), and others (eg, Vav1/3, PLCγ2). In addition, this study identified a number of signaling proteins not previously known to participate in CLEC-2 signaling (Table 1). Some examples include the adapters Dok-2, Grb2, and adhesion and degranulation promoting adapter protein (ADAP; SLAP-130); tyrosine kinase Fer; and tyrosine phosphatases SHP-1, and SHIP-1. Validation of the proteomic data was done by Western blotting on a selection of the aforementioned proteins (Figure 2A). As an additional validation strategy, tyrosine phosphorylation of ADAP, Fer, and Dok-2 was confirmed by a combination of immunoprecipitations and Western blotting (Figure 2B).
Tyrosine phosphoproteome analysis of rhodocytin-stimulated platelets. (A) Phosphoprotein staining of a 10% SDS-PAGE gel showing phosphorylated proteins obtained after 4G10 antiphosphotyrosine immunoprecipitation of basal and rhodocytin-stimulated platelets. (B) Total protein staining of the same gel showing all the proteins immunoprecipitated with the 4G10 antibody in basal and rhodocytin-stimulated platelets. Indicated bands were excised from the gel and analyzed by MS. Proteins identified are reported in supplemental Table 1. Basal indicates basal platelets; Rhod, platelets stimulated with rhodocytin (300nM, 5 minutes); and IP, immunoprecipitation.
Tyrosine phosphoproteome analysis of rhodocytin-stimulated platelets. (A) Phosphoprotein staining of a 10% SDS-PAGE gel showing phosphorylated proteins obtained after 4G10 antiphosphotyrosine immunoprecipitation of basal and rhodocytin-stimulated platelets. (B) Total protein staining of the same gel showing all the proteins immunoprecipitated with the 4G10 antibody in basal and rhodocytin-stimulated platelets. Indicated bands were excised from the gel and analyzed by MS. Proteins identified are reported in supplemental Table 1. Basal indicates basal platelets; Rhod, platelets stimulated with rhodocytin (300nM, 5 minutes); and IP, immunoprecipitation.
Selection of proteins tyrosine phosphorylated after CLEC-2 platelet stimulation. (A) Phosphotyrosine immunoprecipitation analysis of several proteins detected to be altered in the proteomic experiment: ADAP, Fer, Dok-2, Btk, and SHIP-1. (B) Tyrosine phosphorylation of a selection of proteins identified in the tyrosine phosphoproteome analysis was further validated using a combination of immunoprecipitations and Western blot. (i) Fer. (ii) Dok-2. (iii) ADAP. Proteins were separated on 4%-12% NuPAGE Bis-Tris gels before Western blotting. Densitometry graphs representing average band intensities: *P < .05. **P < .01. Basal indicates basal platelets; Rhod, platelets stimulated with rhodocytin (300nM, 5 minutes); IP, immunoprecipitation; and IB, immunoblot. Experiments were done at least 4 times.
Selection of proteins tyrosine phosphorylated after CLEC-2 platelet stimulation. (A) Phosphotyrosine immunoprecipitation analysis of several proteins detected to be altered in the proteomic experiment: ADAP, Fer, Dok-2, Btk, and SHIP-1. (B) Tyrosine phosphorylation of a selection of proteins identified in the tyrosine phosphoproteome analysis was further validated using a combination of immunoprecipitations and Western blot. (i) Fer. (ii) Dok-2. (iii) ADAP. Proteins were separated on 4%-12% NuPAGE Bis-Tris gels before Western blotting. Densitometry graphs representing average band intensities: *P < .05. **P < .01. Basal indicates basal platelets; Rhod, platelets stimulated with rhodocytin (300nM, 5 minutes); IP, immunoprecipitation; and IB, immunoblot. Experiments were done at least 4 times.
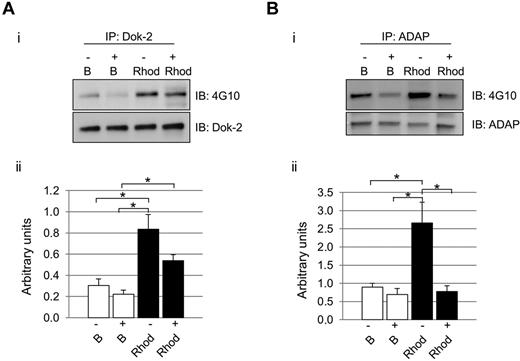
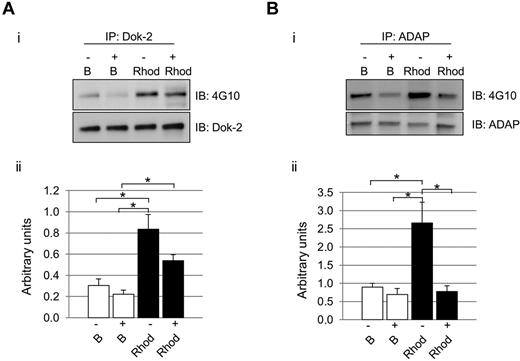
As mentioned in “Introduction,” maximal activation of CLEC-2 signaling is highly dependent on secondary mediators.12 We hypothesized that the influence of secondary mediators would not affect all signaling proteins in the same level, as we could observe in the case of Dok-2 and ADAP. As highlighted above, in both cases, there was an increase in protein tyrosine phosphorylation levels after rhodocytin stimulations in the absence of inhibitors of secondary mediators, in agreement with the proteomic data. Interestingly, in the case of Dok-2, there was also an increase in tyrosine phosphorylation levels after rhodocytin stimulation in the presence of inhibitors of secondary mediators. Regarding ADAP, though, secondary mediators were shown to be crucial for tyrosine phosphorylation of this protein downstream of CLEC-2 (Figure 3).
Differential effect of secondary mediators on Dok-2 and ADAP tyrosine phosphorylation after CLEC-2 activation. Platelets were stimulated with rhodocytin in the presence (+) and absence (−) of inhibitors of secondary mediators (apyrase and indomethacin). (A) Dok-2. (B) ADAP. (i) Representative images. (ii) Densitometry graphs representing average band intensities and statistics. *P < .05. Proteins were separated on 4%-12% NuPAGE Bis-Tris gels before Western blotting. B indicates basal platelets; Rhod, platelets stimulated with rhodocytin (300nM, 5 minutes); IP, immunoprecipitation; and IB, immunoblot. Experiments were done at least 4 times.
Differential effect of secondary mediators on Dok-2 and ADAP tyrosine phosphorylation after CLEC-2 activation. Platelets were stimulated with rhodocytin in the presence (+) and absence (−) of inhibitors of secondary mediators (apyrase and indomethacin). (A) Dok-2. (B) ADAP. (i) Representative images. (ii) Densitometry graphs representing average band intensities and statistics. *P < .05. Proteins were separated on 4%-12% NuPAGE Bis-Tris gels before Western blotting. B indicates basal platelets; Rhod, platelets stimulated with rhodocytin (300nM, 5 minutes); IP, immunoprecipitation; and IB, immunoblot. Experiments were done at least 4 times.
2D-DIGE analysis of basal versus CLEC-2–activated platelets
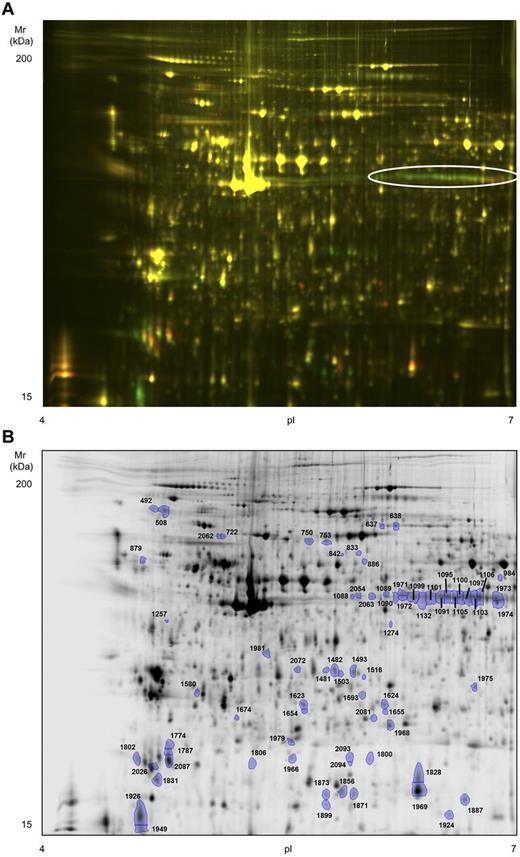
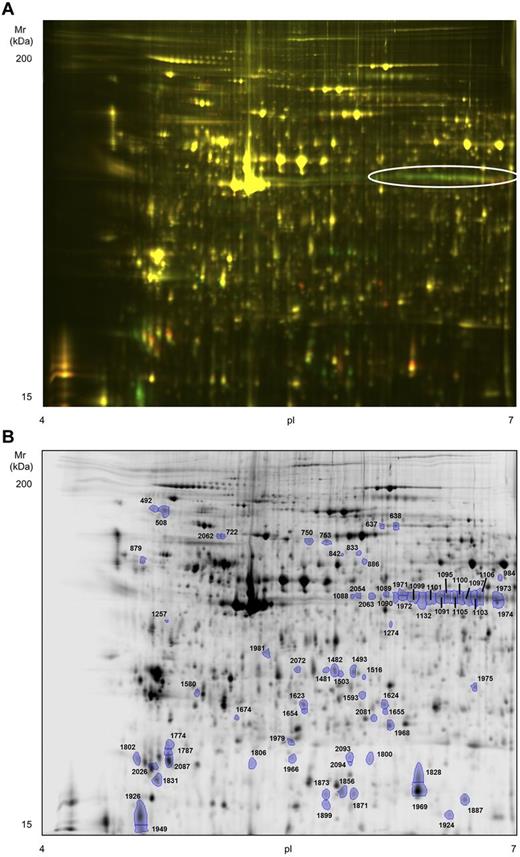
To obtain a more comprehensive picture of the biochemical events that follow platelet activation with rhodocytin, we undertook a 2D-DIGE proteome analysis of basal versus rhodocytin-activated platelets. Platelets were again stimulated with 300nM rhodocytin for 5 minutes in the presence of integrilin to prevent aggregation. Although we followed the standard recommendations for DIGE labeling,21 we used an in-house developed sample buffer because we observed a better resolution with it compared with the standard recommended buffer (“Methods”). We focused on the analysis of the pI 4-7 range because we previously showed that 85% of the platelet proteome detected by 2-dimensional gel electrophoresis (2-DE) is composed in that range.22 The 2D-DIGE analysis led to the identification of 2094 protein spots per gel, 73 of which were differentially regulated between basal and rhodocytin groups (fold change cut-off, 1.5; P < .05; Figure 4). Forty-four protein features were up-regulated in rhodocytin-activated samples, and 29 down-regulated. Of the 73 features, 63 were successfully analyzed by MS. Five spots, present in rhodocytin-stimulated platelets, contained proteins from the snake venom, which was something expected (not shown). The remaining 58 spots led to the identification of 58 unique proteins or open reading frames (Table 2; supplemental Table 2). A selection of differentially regulated protein features is shown in supplemental Figure 1. Nineteen spots had more than 1 protein, whereas 16 proteins were present in more than 1 spot. In the latter case, there was a shift of many proteins toward a more acidic region after rhodocytin stimulation, which is consistent with protein phosphorylation. This is exemplified by pleckstrin, which is the major protein kinase C substrate in platelets.23 As shown in Figure 4A and supplemental Figure 1A, there is an array of 13 pleckstrin spots, the majority of which are up-regulated in rhodocytin-activated platelets, which correspond to different phosphorylated forms of the protein.
High-resolution 2D-DIGE proteome analysis of rhodocytin-activated platelets. Proteins were labeled with the corresponding Cy-dyes (“Methods”) and separated using isoelectric focusing (pH range 4-7, 24 cm) and 10% SDS-PAGE gels. (A) Representative image of the 2D-DIGE analysis where the fluorescence emission from Cy3 and Cy5 dyes is superimposed. Green color spots are up-regulated in rhodocytin-stimulated platelets, whereas red-orange color spots are down-regulated. The array of altered spots that contained the protein pleckstrin is indicated. (B) Representative image of the analysis in gray scale. Spots differentially regulated comparing nonstimulated and rhodocytin-activated platelets are indicated. Further information about protein identifications can be found in supplemental Table 2.
High-resolution 2D-DIGE proteome analysis of rhodocytin-activated platelets. Proteins were labeled with the corresponding Cy-dyes (“Methods”) and separated using isoelectric focusing (pH range 4-7, 24 cm) and 10% SDS-PAGE gels. (A) Representative image of the 2D-DIGE analysis where the fluorescence emission from Cy3 and Cy5 dyes is superimposed. Green color spots are up-regulated in rhodocytin-stimulated platelets, whereas red-orange color spots are down-regulated. The array of altered spots that contained the protein pleckstrin is indicated. (B) Representative image of the analysis in gray scale. Spots differentially regulated comparing nonstimulated and rhodocytin-activated platelets are indicated. Further information about protein identifications can be found in supplemental Table 2.
A high proportion of the proteins identified through the 2D-DIGE analysis are cytoskeletal (34.5%) and signaling (22.4%), consistent with the critical role played by these 2 groups in mediating platelet function and their regulation by phosphorylation. Some of the signaling proteins identified were already known to participate in CLEC-2 signaling (eg, SFK, SKAP-HOM), whereas others not (eg, CrkL, Grb2). Interestingly, only 9 of the proteins that had been identified in the tyrosine phosphoproteome analysis of rhodocytin-stimulated platelets were also identified by the 2D-DIGE approach, namely, β-actin, caldesmon, clusterin, fyn, Grb2, integrin αIIb, SKAP-HOM, thrombospondin-1, and tubulin. One of those proteins is the adapter Grb2, which was found in 1 spot up-regulated in rhodocytin-activated platelets (2D-DIGE analysis; supplemental Figure 1B) and in 1 band corresponding to proteins tyrosine-phosphorylated in response to platelet activation with rhodocytin (Table 1).
Dok-2 is tyrosine phosphorylated downstream of CLEC-2, leading to an increased interaction with SHIP-1
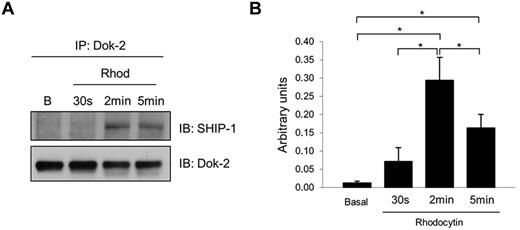
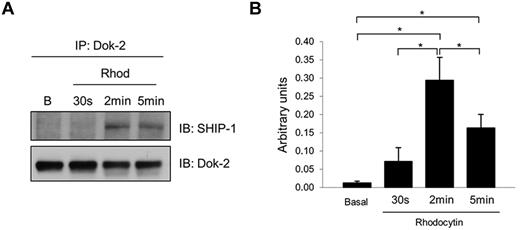
We previously showed that the adapter Dok-2 was tyrosine-phosphorylated downstream of the collagen receptor glycoprotein VI (GPVI).13 We now show that this protein is also tyrosine phosphorylated downstream of CLEC-2. In addition, we wanted to identify Dok-2 interacting proteins as this could provide insight into their functional roles in CLEC-2 signaling in human platelets. One potential candidate, identified in our study, was SHIP-1 because it has been reported to interact with Dok-2 in T cells.24 Coimmunoprecipitation experiments demonstrated an increased association of Dok-2 with SHIP-1 induced by CLEC-2 platelet activation. Time-course experiments showed that the maximum interaction between Dok-2 and SHIP-1 was after 2 minutes of rhodocytin stimulation (Figure 5). Immunoprecipitations using control antibodies (rabbit IgG) were run to demonstrate the specificity of the SHIP-1 band (supplemental Figure 2).
Dok-2 interaction with SHIP-1 is increased after CLEC-2 platelet stimulation. Dok-2 and SHIP-1 interaction was studied using coimmunoprecipitation and time-course experiments. Proteins were separated using 4%-12% NuPAGE Bis-Tris gels before Western blotting. (A) Representative images. (B) Densitometry graphs showing average band intensities and statistics. *P < .05. Basal indicates basal platelets; Rhod, platelets stimulated with rhodocytin (300nM) for 30 seconds, 2 minutes, and 5 minutes; IP, immunoprecipitation; and IB, immunoblot. Experiments were performed at least 4 times.
Dok-2 interaction with SHIP-1 is increased after CLEC-2 platelet stimulation. Dok-2 and SHIP-1 interaction was studied using coimmunoprecipitation and time-course experiments. Proteins were separated using 4%-12% NuPAGE Bis-Tris gels before Western blotting. (A) Representative images. (B) Densitometry graphs showing average band intensities and statistics. *P < .05. Basal indicates basal platelets; Rhod, platelets stimulated with rhodocytin (300nM) for 30 seconds, 2 minutes, and 5 minutes; IP, immunoprecipitation; and IB, immunoblot. Experiments were performed at least 4 times.
Ingenuity Pathways Analysis of all proteins identified
The present study reports the identification of 132 unique proteins, 43 of which correspond to signaling proteins. Ingenuity Pathways Analysis software (IPA, Ingenuity Systems, www.ingenuity.com) was used to investigate possible interactions between all the proteins identified to highlight predominant networks and pathways. Two networks were highlighted by the software: one related to cardiac inflammation, cardiovascular disease and inflammatory disease, which interconnected 56 of 132 proteins; and another related to cellular movement, immune cell trafficking, and hematologic system development and function, which established connections among 50 of 132 proteins (supplemental Figure 3A). Top molecular and cellular functions were: hematologic system development and function, inflammatory response, tissue development, and cellular assembly and organization (supplemental Figure 3B). The top 2 canonical pathways related to the proteins identified are actin cytoskeleton signaling and integrin signaling.
Comparative analysis of GPVI and CLEC-2 proteomic studies
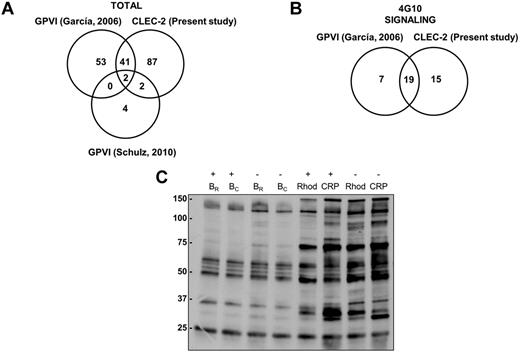
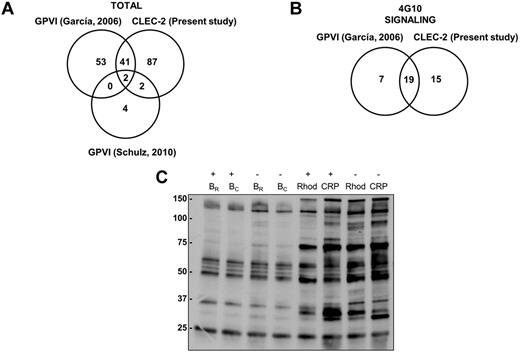
Because of the postulated similarities between the GPVI and the CLEC-2 signaling cascades, we analyzed the results obtained so far for both pathways by proteomics. That includes the present study for CLEC-2 and 2 previous studies for GPVI, one by our group14 and the other by Schulz et al.25 The studies by our group were based on 2-DE/DIGE, phosphotyrosine immunoprecipitations followed by SDS-PAGE, and MS, whereas the study by Schulz et al25 was based on 2D-DIGE and MS. In all cases, 2-DE/DIGE studies were without inhibitors of secondary mediators. In total, 132 unique proteins were identified as differentially regulated after CLEC-2 platelet activation, whereas 102 proteins were identified downstream of GPVI activation (Figure 6A). The overlap between GPVI and CLEC-2 studies is of 45 proteins.
Comparative analysis of GPVI and CLEC-2 signalosomes. (A) Venn diagram showing comparative data on proteins identified by GPVI and CLEC-2 signaling proteomic analyses. (B) Venn diagram showing comparative data on signaling proteins identified by GPVI and CLEC-2 tyrosine phosphoproteome analyses. (C) Tyrosine phosphoproteome profile comparing platelets stimulated with rhodocytin and with CRP. Immunoblot with 4G10 is shown to visualize tyrosine-phosphorylated proteins after antiphosphotyrosine immunoprecipitation with the 4G10 antibody and protein separation on a 4%-12% NuPAGE Bis-Tris mini gel. B indicates basal platelets; Rhod, platelets stimulated with rhodocytin (300nM, 5 minutes); CRP, platelets stimulated with collagen-related peptide (10 μg/mL, 90 seconds); IP, immunoprecipitation; and IB, immunoblot. Platelet stimulations were in the presence (+) and absence (−) of inhibitors of secondary mediators (apyrase and indomethacin).
Comparative analysis of GPVI and CLEC-2 signalosomes. (A) Venn diagram showing comparative data on proteins identified by GPVI and CLEC-2 signaling proteomic analyses. (B) Venn diagram showing comparative data on signaling proteins identified by GPVI and CLEC-2 tyrosine phosphoproteome analyses. (C) Tyrosine phosphoproteome profile comparing platelets stimulated with rhodocytin and with CRP. Immunoblot with 4G10 is shown to visualize tyrosine-phosphorylated proteins after antiphosphotyrosine immunoprecipitation with the 4G10 antibody and protein separation on a 4%-12% NuPAGE Bis-Tris mini gel. B indicates basal platelets; Rhod, platelets stimulated with rhodocytin (300nM, 5 minutes); CRP, platelets stimulated with collagen-related peptide (10 μg/mL, 90 seconds); IP, immunoprecipitation; and IB, immunoblot. Platelet stimulations were in the presence (+) and absence (−) of inhibitors of secondary mediators (apyrase and indomethacin).
If we focus on the phosphotyrosine proteome analysis, comparing data from the CLEC-2 and GPVI studies, 19 of the 26 differentially regulated signaling proteins identified downstream of GPVI are also involved in CLEC-2 signaling, highlighting the similarities between both signaling cascades (Figure 6B; supplemental Table 3). Indeed, we carried out a comparative analysis of protein tyrosine phosphorylation levels after platelet activation with rhodocytin and with the GPVI specific agonist CRP. This was done in the presence and absence of inhibitors of secondary mediators. Doses and activation times for each agonist were the same as those used in the proteomic studies, leading to a maximum increase in tyrosine phosphorylation levels in each case. The results indicate the existence of similarities between both signaling cascades, although in the case of CLEC-2 full signaling activation (ie, protein tyrosine phosphorylation) is highly dependent on secondary mediators, as expected (Figure 6C).
Discussion
The proteome of rhodocytin-stimulated platelets was investigated to provide a more complete picture on the intracellular signaling events that follow CLEC-2 activation. The combination of different complementary proteomic methods proved to be an efficient way to accomplish this objective. We previously applied with success a similar strategy to analyze the proteome of the GPVI signaling cascade,14 which shares similarities with the CLEC-2 signaling cascade. Indeed, as indicated in “Comparative analysis of GPVI and CLEC-2 proteomic studies,” proteomic data from both studies indicate that there is a considerable overlap between both signaling cascades. Moreover, this analysis confirmed that full CLEC-2 signaling activation is highly dependent on secondary mediators, as previously described.12 This fact could also explain why our proteomic studies led to the identification of more proteins involved in CLEC-2 signaling than in GPVI signaling, although we should also bear in mind that the gel-based proteome analysis was of higher resolution in the case of the former.
2D-DIGE is considered to be more quantitative and reproducible than traditional 2-DE and has been recently applied to the study of GPVI signaling.25 We decided to use this strategy to analyze the proteome of rhodocytin-stimulated platelets to obtain information complementary to the tyrosine phosphoproteome analysis-based approach. The lower number of proteins identified with the 2D-DIGE approach compared with the phosphotyrosine immunoprecipitation-based approach (58 vs 83) and the low degree of overlapping between both approaches (only 9 proteins in common) can be attributed to the following factors related to the 2D-DIGE approach: the inability of certain proteins to be properly resolved by 2D-DIGE because of solubility problems during IEF; the low level of expression of tyrosine phosphorylated proteins, as is the case for many signaling proteins, and their colocalization with other, more highly expressed proteins on the 2D gel. In addition, we should also bear in mind the 2D-DIGE analysis covered only the pI 4-7 range. Overall, both proteomic approaches complement each other, although there is a clear improvement in the analysis when using the phosphotyrosine immunoprecipitation-based approach, indicating the convenience of introducing an affinity step. Indeed, analysis of the tyrosine phosphoproteome of rhodocytin-stimulated platelets was achieved by enrichment of samples using a specific antiphosphotyrosine antibody. Our results confirmed that tyrosine phosphorylation of CLEC-2 signaling proteins is highly dependent on secondary mediators, as expected. Interestingly, Dok-2 tyrosine phosphorylation levels are also increased after CLEC-2 activation in the presence of inhibitors of secondary mediators. This is an indication of the complexity of the CLEC-2 signaling cascade.
We should bear in mind that some of the differences observed in the proteomic analysis might be the result of the effect of secondary mediators on their signaling pathways, and not only on CLEC-2 signaling. Previous 2-DE/DIGE-based proteomic studies on platelet signaling had this same limitation,14,25 which in the case of CLEC-2 signaling is unavoidable because of the crucial role ADP and TxA2 play in this pathway. Nevertheless, detailed validation studies, in line with those shown here, and database analysis of the proteins identified should help to clarify any ambiguity related to the results.
One of the remarkable findings of this study was the detection of the majority of the tyrosine-phosphorylated signaling proteins known to be involved in platelet activation by CLEC-2 to date. This not only validates the quality of the approach, but it also highlights the potential importance of the other proteins identified, especially the signaling ones. Among this group of proteins, we validated several of them and paid special attention to adapters. Adapter proteins can help to recruit other signaling proteins to the cascade that may be relevant for its positive or negative regulation. For instance, CLEC-2 signaling is partially dependent on SLP-76, suggesting that other adapter proteins may be recruited to the signaling cascade and function as alternatives to SLP-76.6 Indeed, this is one of the main differences reported so far between CLEC-2 and GPVI signaling because the latter is fully dependent on SLP-76.6 Moreover, it has been shown that Gads, which constitutively associates with SLP-76 and tyrosine phosphorylated LAT in platelets, plays only a limited role in CLEC-2 signaling, suggesting that there is a Gads-independent pathway of platelet activation downstream of LAT.6,26 This illustrates the relevance of further investigating the regulation of CLEC-2 signaling. In our analysis, we identified the ADAP, also known as SLAP-130, as being tyrosine phosphorylated in response to platelet activation by CLEC-2. ADAP is a Src substrate and has been recently identified as an essential component of αIIbβ3-mediated platelet mechanotransduction that promotes F-actin assembly and enables platelet spreading and thrombus stabilization under fluid shear stress.27
Another adapter protein identified in our analysis is Dok-2, which we recognized in platelets for the first time a few years ago.13 Indeed, we previously reported the involvement of Dok-2 in GPVI signaling.14 This could explain its involvement in CLEC-2 signaling given the similarities between both pathways. It has been shown that after T cell receptor for antigen stimulation, Dok-2 interacts with the phosphatase SHIP-1 forming a negative signaling complex.24 Moreover, SHIP-1 favors recruitment of Dok-2 to LAT. Indeed, it was demonstrated that Dok-2 is a critical element of a LAT-dependent negative feedback loop that attenuates early T-cell receptor signal.24 Our data demonstrate that Dok-2 is tyrosine phosphorylated downstream of CLEC-2 in human platelets leading to an increased interaction with SHIP-1. We hypothesize that Dok-2 participates in a negative signaling complex, together with SHIP-1, which may negatively regulate CLEC-2 signaling.
In conclusion, we have used a global proteomics approach to improve our knowledge on CLEC-2 signaling regulation. Together with the majority of proteins involved in CLEC-2 signaling known to date, we report the identification of a considerable number of proteins not previously known to be involved in the cascade. For instance, we show, for the first time, the involvement of the tyrosine kinase Fer, and the adapters ADAP and Dok-2, in CLEC-2 signaling. Indeed, Dok-2 is tyrosine phosphorylated after CLEC-2 platelet activation regardless of the action of secondary mediators. In addition, we report an increased association between Dok-2 and SHIP-1 in rhodocytin-stimulated platelets, which might negatively regulate CLEC-2 signaling. We believe our data provide thrombosis-relevant information on CLEC-2 signaling regulation, contributing to a better understanding of this signaling cascade and the molecular mechanism underlying platelet activation and thrombus formation.
This article contains a data supplement.
The publication costs of this article were defrayed in part by page charge payment. Therefore, and solely to indicate this fact, this article is hereby marked “advertisement” in accordance with 18 USC section 1734.
Acknowledgments
The authors thank the personnel from the Servizo de Vixilancia da Saúde, Universidade de Santiago de Compostela for their assistance on blood collection from healthy volunteers.
This work was supported by the Spanish Ministry of Economy and Competitiveness (MINECO; grant SAF2010-22151), the European regional development fund, and the Galician Government (Consellería de Educación, Xunta de Galicia, Spain; grant INCITE09PXIB203145PR). A.G. is a Ramón y Cajal Research fellow (MINECO). A.F.P. is an FPI predoctoral fellow (MINECO). J.A.E. received financial support from the Deutsche Forschungsgemeinschaft (SFB/TR23, project A8).
Authorship
Contribution: A.F.P. performed experiments, analyzed data, and contributed to writing the paper; J.A. and E.G. performed mass spectrometry analysis; I.R. performed experiments, analyzed data, and contributed to writing the “Methods” section of the paper; P.V. and M.J.G.-L. performed experiments; J.A.E. provided vital reagents; M.I.L. provided vital analytical tools; and A.G. designed research, analyzed data, provided vital reagents and analytical tools, and wrote the manuscript.
Conflict-of-interest disclosure: The authors declare no competing financial interests.
Correspondence: Dr Ángel García, Centro de Investigación en Medicina Molecular y Enfermedades Crónicas (CIMUS), Universidade de Santiago de Compostela, Avda de Barcelona s/n, 15782 Santiago de Compostela, Spain; e-mail: angel.garcia@usc.es or anxogarcia@hotmail.com.

