Abstract
Abstract 4857
Several previous studies demonstrated the poor treatment outcomes for the patients with nodal peripheral T-cell lymphomas (PTCLs) including PTCL, not otherwise specified (PTCL-NOS), ALK-negative anaplastic large cell lymphoma (ALCL) and angioimmunoblastic T-cell lymphoma (AITL) when compared with ALK-positive ALCL and aggressive B-cell lymphomas. For the treatment of T-cell lymphomas, promising results of chemotherapy regimens including etoposide in several studies were evidenced. We conducted the prospective study to determine the effectiveness and tolerability of the combination chemotherapy with cyclophosphamide, doxorubicin, vincristine and prednisone (CHOP) with addition of etoposide (CHOEP-21) for newly diagnosed nodal peripheral T-cell lymphomas (PTCLs) treated at Maharaj NakornChiang Mai Hospital in the Northern part of Thailand.
From October 2008 to November 2011, patients ages 18–60 years with newly diagnosed nodal PTCLs excluding ALK-positive ALCL were enrolled to receive CHOEP-21 (CHOP plus etoposide 100 mg/m2 days 1–3) every 3 weeks for 8 cycles with granulocyte colony-stimulating factor (G-CSF) starting from day 4–11. None of them proceeded to undergo autologous stem cell transplantation (ASCT) due to financial problems. Event-free survival (EFS) which is the primary endpoint, was calculated from the date of diagnosis until disease progression or relapsed, change to other treatment, or death from any cause. Secondary end point of the study was overall survival (OS), response rate and toxicities of regimen.
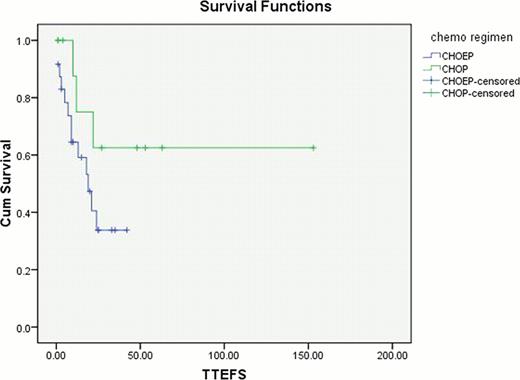
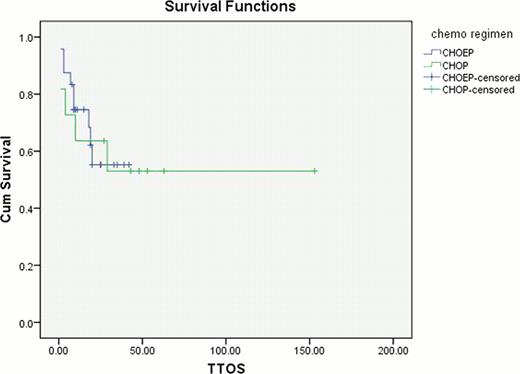
24 patients were enrolled. Twenty of them were male with a mean age of 49 years. Majority of the patients had PTCL, NOS (n = 16), 7 patients had AITL and only one ALK-negative ALCL patient. Almost all except one were in stage III-IV with 62% of the patients had international prognostic index (IPI) ≥ 2. From median follow up of 16 months, overall response (OR) was 58% (33% CR) but 28.5% of these patients eventually relapsed as shown in table 1. Estimated 2-year EFS and OS were 33.8% and 55%, respectively. When compared with the 11 historical control receiving CHOP regimen, the outcomes including EFS, OS and OR were not statistically different, even though patients receiving CHOEP had more advanced stage and bone marrow involvement than those receiving CHOP regimen (Table 2, Figure 1 and 2). Infection (grade 3–4 of 8.3%) and hematologic toxicities were the most common adverse effects with acceptable grade 3–4 neutropenia (7.6%) and thrombocytopenia (4.6%).
The CHOEP-21 without following ASCT did not seem to improve outcomes in patients with nodal PTCLs. Other treatment strategies are warranted to study in these groups of patients.
Response to treatment
| Histopathology . | Total . | CR (%) . | PR (%) . | PD (%) . | Relapsed (%) . | Alive (%) . | Alive in CR (%) . |
|---|---|---|---|---|---|---|---|
| PTCL, NOS | 16 | 3 (19) | 4 (17) | 9 (56) | 2 (13) | 9 (56) | 2 (13) |
| AITL | 7 | 4 (57) | 2 (29) | 1 (14) | 2 (29) | 5 (71) | 3 (43) |
| ALCL, ALK-negative | 1 | 1 (100) | 0 (0) | 0 (0) | 0 (0) | 1 (100) | 1 (100) |
| Total | 24 | 8 (33) | 6 (25) | 10 (42) | 4 (17) | 15 (63) | 6 (25) |
Comparison between CHOEP and CHOP historical control patient characteristics and outcome
| Parameter . | CHOP . | CHOEP . | P value . |
|---|---|---|---|
| Number of patients | 11 | 24 | - |
| Age, mean+SD y (range) | 48.4+10.3 (25–60) | 48.9+9.9 (18–60) | 0.683 |
| Sex (male:female ratio) | 5: 6 | 5: 1 | 0.008 |
| Histologic subtype, no. patients (%) | |||
| - PTCL, NOS | 7 (64) | 16 (64) | 0.666 |
| - ALCL, ALK-negative | 0 (0) | 1 (9) | |
| - AITL | 4 (36) | 7 (27) | |
| Ann Arbor stage III - IV, no. patients (%) | 5 (45) | 23 (95) | 0.006 |
| Bone marrow involvement, no. patients (%) | 1 (9) | 4 (36) | 0.017 |
| Elevated LDH serum level, no. patients (%) | 7 (64) | 14 (58) | 0.539 |
| IPI score, no. patients (%) | |||
| 0–1 | 6 (54) | 9 (38) | 0.02 |
| 2–3 | 3 (27) | 12 (50) | |
| 4–5 | 2 (18) | 3 (12) | |
| CR (%) | 8 (72) | 8 (33) | 0.466 |
| Overall response rate; CR+PR (%) | 8 (72) | 14 (58) | 0.081 |
| Relapse/refractory (%) | 3 (27) | 10 (42) | 0.032 |
Kaplan Meier curve for EFS in CHOEP and CHOP regimen
Kaplan Meier curve for OS in CHOEP and CHOP regimen
No relevant conflicts of interest to declare.
Author notes
Asterisk with author names denotes non-ASH members.


