Abstract
Abstract 1962
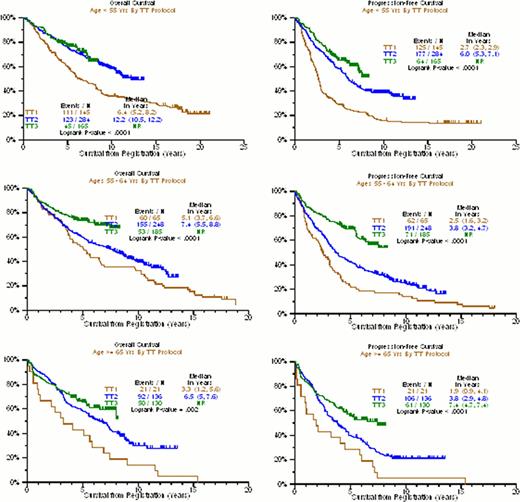
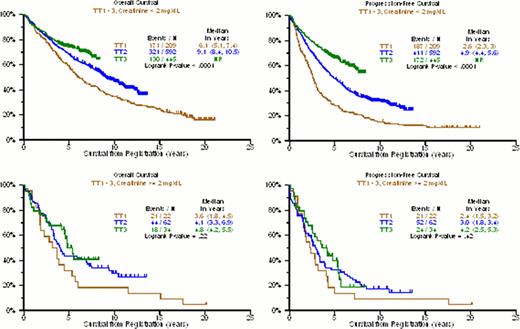
Older age and higher serum creatinine levels have long been considered adverse features for overall survival (OS) and progression-free survival (PFS) in MM. Here we are reporting on these variables and their impact on clinical outcomes with the evolution of TT protocols. Among patients <55yr, median OS was 6.4yr with TT1 with 30% alive at 15yr and 12.2yr with TT2. KM curves for TT2 and TT3 were superimposable and medians have not been reached for TT3. (p<0.0001) (Figure 1). The proportions alive were 30% at 15yr in TT1, 60% at 10yr in TT2, and 80% at 5yr in TT3. Median PFS was 2.7yr with TT1, 6.0yr with TT2, and not reached with TT3; ∼10% remain event-free from 15 to 20 years in TT1, 40% at 10yr in TT2, and almost 60% at 5yr in TT3 (p<0.0001). For the middle age group 55–64yr, 15% are alive at 15yr in TT1, 40% at 10yr in TT2, and 75% at 5yr in TT3 (p=0.006). The corresponding PFS was ∼10% at 15yr with TT1, 25% at 10yr with TT2, and 70% at 5yr with TT3 (p<0.0001). For patients >64yr, median OS was 3.3yr with TT1, 6.5yr with TT2, and not reached with TT3 (p=0.01); 15% are alive at 10yr with TT1, 30% at 10yr with TT2, 70% at 5yr with TT3. PFS was 1.9yr with TT1, 3.8yr with TT2 and not reached with TT3; No patients remain at 16yr with TT1, 30% at 10yr with TT2, and 65% at 5yr with TT3. Within protocols, age effects on OS were most apparent in TT1; with TT2 those <55yr outperformed the 2 older age groups, and no significant age difference was apparent for TT3. As to renal function, creatinine >=2 mg/dL was significantly linked to inferior OS in all 3 trials, with medians of 3.6yr v 6.1yr in TT1, 4.1yr v 9.1yr in TT2, and ∼50% v 75% alive at 5yr in TT3 (p=0.008,p=0.001,p=0.002) (Figure 2). PFS was 2.5yr with TT1 regardless of renal function(p=0.36), 3yr v 4.9yr with TT2 (p=0.002), and ∼40% v 70% at 5yr with TT3 (p<0.0001). Thus, major advances in both OS (p<0.0001) and PFS (p<0.0001) were observed with the transition from TT1 to TT2 to TT3 among patients with creatinine <2 mg/dL, whereas results remained dismal for the more impaired renal function group (OS: p=0.22, PFS: p=0.42). Accounting for all possible interactions between TT trial, age, and creatinine, multivariate logistic regression to predict 4-yr OS and 4-yr PFS showed consistently improved OR for OS with TT3>TT2>TT1 regardless of age groups; 4-yr PFS also benefited from TT3>TT2>TT1, but this was most clearly seen in the 55–64yr age group. Significant interactions with creatinine were not observed but levels >=2mg/dL remained an independent dominant adverse variable (OS: OR=2.31, p<0.0001; PFS: OR=2.11, p<0.0001) (Table 1). In conclusion, treatment advances have been realized in patients with preserved renal function across age groups. The poor outcome in patients with creatinine >=2.0mg/dL may not only reflect host- but also MM-related issues. Delaying more toxic VTD-PACE induction until improvement in renal function with VTD for 1 or 2 cycles may improve clinical outcomes.
Multivariate Logistic Regression on Age, Creatinine and Protocol
Stepwise selection was used to determine the best models for 4-year OS and PFS in TT1-3. All 2-way (i.e. TT by Age) and 3-way (i.e. TT by Age by Creatinine) interactions were considered for inclusion in the logistic models. The lack of any significant interactions with Creatinine may be due to the small number of patients enrolled to TT trials with Creatinine >= 2 mg/dL.
| Endpoint . | OR Comparison . | OR (95% CI) . | p-value . |
|---|---|---|---|
| 4-year OS | TT2 v TT1 | 0.58 (0.42, 0.81) | 0.0013 |
| TT3 v TT2 | 0.77 (0.59, 1.01) | 0.0623 | |
| Age 55–64 v Age < 55 | 1.77 (1.34, 2.34) | <.0001 | |
| Age >= 65 v Age 55–64 | 1.25 (0.92, 1.71) | 0.1596 | |
| Cr >= 2mg/dL | 2.31 (1.57, 3.41) | <.0001 | |
| 4-year PFS | TT2 v TT1 Age < 55 | 0.28 (0.18, 0.43) | <.0001 |
| TT3 v TT2 Age < 55 | 0.75 (0.49, 1.15) | 0.1881 | |
| TT2 v TT1 Age 55–64 | 0.55 (0.31, 0.99) | 0.0463 | |
| TT3 v TT2 Age 55–64 | 0.33 (0.22, 0.51) | <.0001 | |
| TT2 v TT1 Age >= 65 | 0.63 (0.25, 1.64) | 0.3459 | |
| TT3 v TT2 Age >= 65 | 0.59 (0.36, 0.97) | 0.0385 | |
| Cr >= 2mg/dL | 2.11 (1.41, 3.16) | 0.0003 |
No relevant conflicts of interest to declare.
Author notes
Asterisk with author names denotes non-ASH members.


