Abstract
Abstract 1530
The 2007 International Working Group criteria incorporates FDG PET for lymphoma response assessment. The purpose of this study was to assess the prognostic value of FDG PET-based visual five-point and quantitative response criteria in pediatric HL.
We retrospectively analyzed multi-site FDG PET or PET/CT images from COG AHOD0031, a phase III study for newly diagnosed pediatric intermediate-risk HL. FDG PET was obtained at baseline (PET1), at mid-therapy after 2 cycles of ABVE-PC chemotherapy (PET2) and if the PET2 was positive, after completion of further chemotherapy (PET3). We randomly selected 150 patients with PET2 enrolled since 1/2007, a cohort likely to have high-quality archived PET images, and that represented 5 specific groups (Stage I, IIA, IIB, III, and IV) in proportion to their representation in the AHOD0031 study. From this cohort, a subset of patients (N=94) with qualified PET images were selected for review.
PET images were analyzed by consensus of 2 experienced readers blinded to clinical outcome data. Visual analysis of the highest PET tumor uptake was scored on a 5-point scale (1 No uptake above surround background, 2 ≤ mediastinal blood pool, 3 > mediastinal blood pool but ≤ liver, 4 Moderately increased compared to liver, 5 Markedly increased compared to liver). Quantitative PET analysis included highest tumor maximum body-weight standardized uptake value (SUVmax), normal liver average SUV (SUVavg) and blood pool SUVavg. SUV parameters analyzed at PET1, PET2 and PET3 include the following: tumor SUVmax (T-SUV), ratio of tumor SUVmax/liver SUVavg (TL-SUV), ratio of tumor SUVmax/mediastinal blood pool SUVavg (TBP-SUV), and percent reduction in these values from two PET scan intervals (i.e. % change TSUV from PET1 to PET2 = T-SUV12). Event free survival (EFS) was chosen as a clinical endpoint of interest and analyzed by Kaplan-Meier analysis and log-rank test for the visual scale and by Cox proportional hazards model for the SUV parameters. The tumor visual and SUV analyses were compared using receiver-operating-characteristic (ROC) analysis using area under ROC curve (ROC-AUC) where outcome is 2-year EFS. The SUV value that corresponds to the point closest to the upper left corner on ROC curve was selected as the optimal cutoff.
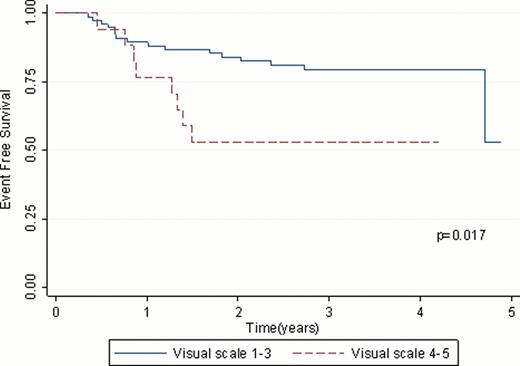
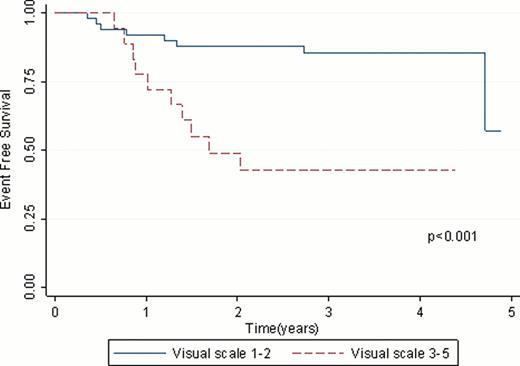
Visual analysis at PET2 using reference liver activity as a threshold (visual scale ≥4 as positive) had a better separation of EFS between the 2 groups (Fig 1, P=0.017) compared to blood pool threshold (visual scale ≥3 as positive) (P=0.14). Among the 69 patients with PET3, reference blood pool as a threshold (visual scale ≥3 as positive) had a better separation of EFS (Fig 2, P<0.001) compared to liver threshold (visual scale ≥4 as positive) (P=0.29).
The PET2 TL-SUV was most highly predictive of EFS (P=0.02); T-SUV (P=0.06) and TBP-SUV (P=0.06) were of borderline significance as predictors of EFS. An evaluation of the predictive value of change in SUV between PET scans showed that the percent reduction in SUV in the interval from PET1 to PET2 was most predictive of EFS using TL-SUV12 (P=0.03); T-SUV12 (P=0.1) and TBP-SUV12 (P=0.08) were not robust predictors of EFS.
ROC analysis at PET2 for prediction of 2-year EFS had ROC-AUC by five-point visual criteria of 0.6876, T-SUV of 0.6998, TL-SUV of 0.6969, TBP-SUV of 0.6745. These visual and SUV PET criteria at PET2 and PET3 for prediction of 2-year EFS showed overall no significant difference in pair-wise comparisons of ROC-AUC. General optimal cut-off SUV threshold values at PET2 were selected, notably with TL-SUV of 1.26 (P=0.015).
A pronounced (but not complete) response at mid-therapy, as measured using a five-point visual FDG PET assessment with liver (not blood pool) as a reference threshold (visual scale ≥4 as positive) is highly predictive of EFS. Quantitative assessment using SUV parameters at mid-therapy PET can also predict responders in pediatric HL and seems most effective using the PET2 TL-SUV or percent reduction TL-SUV12 ratios.
Although visual and quantitative PET based assessments were comparable in this small retrospective analysis, a larger prospective study is needed. We propose general optimal cut-off SUV threshold values at mid-therapy PET for validation in future larger retrospective and prospective studies.
No relevant conflicts of interest to declare.
Author notes
Asterisk with author names denotes non-ASH members.


