Abstract
TLR ligands (TLR-Ls) represent novel vaccine adjuvants, but their immunologic effects in humans remain poorly defined in vivo. In the present study, we analyzed the innate responses stimulated by different TLR-Ls in rhesus macaques. MPL (TLR4-L), R-848 (TLR7/8-L), or cytosine-phosphate-guanine oligodeoxynucleotide (TLR9-L) induced a rapid and robust expansion of blood neutrophils, with a concomitant reduction in PBMCs. Furthermore, all TLR-Ls induced rapid (3-8 hours) expansion of CD14+ monocytes, but only TLR7/8-L and TLR9-L mobilized the CD14+CD16+ and CD14dimCD16++ monocytes, and only TLR7/8-L and TLR9-L induced activation of myeloid dendritic cells (mDCs) and plasmacytoid DCs (pDCs), production of IP-10 and type-I IFN, and expression of type-I IFN–related and chemokine genes in the blood. In the draining lymph nodes (LNs), consistent with the effects in blood, all TLR-Ls induced expansion of CD14+ monocytes, but only TLR7/8-L and TLR9-L expanded the activated CD14+CD16+ cells. TLR4-L and TLR9-L differentially induced the expansion of mDCs and pDCs (1-3 days), but did not activate DCs. In contrast, TLR7/8-L did not induce DC expansion, but did activate mDCs. Finally, both TLR9-L and TLR7/8-L induced the expression of genes related to chemokines and type-I IFNs in LNs. Thus different TLR-Ls mediate distinct signatures of early innate responses both locally and systemically.
Introduction
Emerging evidence demonstrates that many successful vaccines induce Ag-specific T- and B-cell responses by activating the innate immune system.1 This is most evident in live attenuated vaccines such as the yellow fever vaccine YF-17D.2 In contrast, inactivated vaccines, including subunit, conjugate, toxoid, or carbohydrate vaccines, typically stimulate suboptimal immunity and often require adjuvants to enhance protective immunity, especially in immune-compromised populations such as the elderly or infants.3–6
Vaccine adjuvants can enhance the magnitude and modulate the quality, breadth,7,8 and persistence of an immune response,3–6,9 and can also help to limit the dose of Ag required to induce optimal immunity. Despite their clear benefits and widespread use in vaccines, until recently, the only adjuvant licensed worldwide for clinical use was alum.10 More recently, MF-59, an oil-in-water solution based on squalene, has been licensed as a vaccine adjuvant for influenza vaccines.11 Furthermore, a derivative of lipopolysaccharide (LPS), the monophosphoryl lipid-A (MPL), has been approved recently for use as one of the components of the AS04 adjuvant (alum + MPL) used in Cervarix,12,13 the vaccine against cervical cancer. Despite the recent licensure of such adjuvants, there is a great need for additional adjuvants that stimulate optimally effective cellular and humoral immune responses against pathogens such as HIV or malaria.1,3
TLR ligands (TLR-Ls) represent an emerging new class of molecules with great potential as vaccine adjuvants.3–5,8,10 Several TLR-dependent compounds are in advanced preclinical and clinical trials (eg, cytosine-phosphate-guanine oligodeoxynucleotide [CpG-ODN],10 poly I-C/L-C,10 and glucopyranosyl lipid adjuvant14 ) and some have already been licensed for clinical use as adjuvants (eg, MPL-AS0413 ) or therapeutics (eg, imidazoquilines15 ). TLRs sense a wide range of pathogen-associated molecular patterns from bacteria, viruses, and parasites (reviewed in Kawai and Akira16 and in Takeuchi and Akira17 ). The nontoxic derivatives of LPS-MPL18 or glucopyranosyl lipid adjuvant14 are detected by TLR4. TLR7 and TLR8 sense viral ssRNAs or small synthetic molecule compounds (eg, R-837 or R-848).15,19 TLR9 recognizes unmethylated CpG motifs of bacterial and viral DNA.19,20
TLRs are expressed by professional APCs, including dendritic cells (DCs).16,21 Interestingly, distinct TLRs are differentially expressed on different subsets of APCs. In humans, myeloid DCs (mDCs) express TLR4 and TLR8,3,19 and a subset of these are efficient at inducing cross-presentation of exogenously acquired antigens to CD8+ T cells22,23 ; however, a functional TLR8 is not expressed in mice. In contrast, human plasmacytoid DCs (pDCs) express intracellular TLR7 and TLR9, which recognize viral and bacterial nucleic acids and mediate the production of type I IFNs,3,19 whereas in mice, TLR7 and TLR9 are also expressed by CD8− mDCs.3 The discrepancies in TLR expression between mouse and human DCs may limit the translation of any findings into clinical use, thus highlighting the need for nonhuman primate and human trials.
Activation of immature DCs in the periphery by TLR-Ls results in their maturation and migration to the draining lymph nodes (LNs), where they present Ag to naive T cells and initiate an immune response.1,3,21 Neutrophils can also sense the TLR-Ls (with the exception of TLR3) and mediate a rapid response by phagocytosis of infected cells, release of NETs, and production of chemokines to attract T and B cells to the site of antimicrobial invasion.24,25 Monocytes, in cooperation with neutrophils, also mediate and participate in early inflammatory response to microbes. However, distinct monocyte subtypes can be distinguished that respond differentially to the TLR stimuli.26–32 The “classical” CD14+CD16− and “intermediate” CD14+CD16+ monocytes sense bacterial products by extracellular TLR2 and TLR4, whereas the “nonclassical” CD14−/dimCD16++ “patrolling” monocytes mediate the production of pro-inflammatory cytokines after sensing the nucleic acids and viruses through TLR7 and TLR8.32
Despite their promise, lingering safety concerns pose an impediment to the rapid clinical development of TLR-Ls. Although the adjuvant effects of such ligands are amply evident, there is only a fragmentary understanding of the local and systemic innate responses stimulated by them in vivo. Such understanding is of critical importance in the rational assessment of safety profiles and in the facilitation of a mechanistic understanding of the potential toxicities associated with the adjuvants. In the present study, we describe a systematic evaluation of the local and systemic innate responses stimulated by subcutaneous injection of various TLR-Ls, including MPL (TLR4-L), R-848 (TLR7/8-L), and CpG (TLR9-L), into nonhuman primates.
Our study demonstrates that different TLR adjuvants mediate distinct cellular and molecular signatures of early innate responses, both in the periphery and in the lymphatic organs. Injection of MPL induced rapid systemic expansion of neutrophils and CD14+CD16− monocytes, followed by their migration to LNs, which was correlated with local expression of complement genes. In contrast, both R-848 and CpG-ODN induced robust systemic expansion of neutrophils and CD14+CD16+ monocytes, activation of peripheral DCs, and cytokine production that was correlated with chemokine and type-I IFN–related gene expression in blood. However, only injection of CpG-ODN mediated sustainable inflammatory response in the blood (up to 6 days) and increased the frequency of activated “inflammatory” monocytes and pDCs in draining LNs that was associated with local complement, chemokine, and type-I IFN–related gene signatures.
Methods
Animals and injections
Nine adult, Indian rhesus macaques (Macaca mulatta) were maintained in the Yerkes National Primate Research Center. Animals were cared for under guidelines established by the Animal Welfare Act and the National Institutes of Health Guide for the Care and Use of Laboratory Animals33 with protocols approved by the Emory University. Nonhuman primates were age and weight matched, divided into 3 groups of 3 animals each, and injected intradermally in the upper left and right back flank with a total of 10 injections (5 × 100 μL in the left flank and 5 × 100 μL in the right flank) for a final volume of 1 mL with one of the following TLR-Ls: group 1: 100 μg of MPL (PHAD; Avanti Polar Lipids); group 2: 2 mg of Resiquimod (R-848; Enzo Life Sciences International); group 3: 2 mg of CpG-ODN 2006 type B (TLR9-L, 5′ TCG TCG TTT TGT CGT TTT GTC GTT 3′ with a full phosphothioate [PTO] backbone; TriLink BioTechnologies).
Tissue collection and flow cytometry
PBMCs and plasma were isolated from blood samples using CPT-EDTA tubes (Vacutainer; BD Biosciences), as described previously34 and in supplemental Methods (available on the Blood Web site; see the Supplemental Materials link at the top of the online article). LN cells were isolated from biopsies as described in supplemental Methods. Complete blood counts were performed, with total blood collected on EDTA using an automated hematology analyzer (Sysmex KX21). Freshly isolated PBMCs or LN cells were stained with an appropriate cocktail using Abs described in supplemental Methods. At least 5 × 10⁵ total cells (PBMCs or LN cells) were acquired for analysis on a 3-laser LSRII instrument (BD Biosciences). Data were analyzed with FlowJo software Version 9.2 (TreeStar).
RNA analysis
After PMBC and LN isolation, 2 × 10⁶ cells were lysed in 1 mL of TRIzol reagent (Invitrogen) and cryopreserved at −80°C. After all time points were collected for each individual, the samples were thawed, and the RNA isolation proceeded according to the manufacturer's protocol. Total RNA sample quality was evaluated by spectrophotometer and RNA was reverse-transcribed using the High-Capacity cDNA Archive Kit Protocol (Applied Biosystems). The Quantitative Real-Time PCR Analysis Low-Density Arrays for 96 genes were custom designed by Applied Biosystems (supplemental Table 1). All sequences were amplified using the Applied Biosystems 7900HT Sequence Detection System. Raw data were obtained using SDS2.3 software (Applied Biosystems). Gene-expression data were normalized relative to the geometric mean of 3 housekeeping genes, 18s, Actb, and Gusb. Subsequently, real-time StatMiner Version 4.0 software (Integromics) was used to perform a quality control for all runs, to perform relative quantification delta-delta Ct analysis to calculate the fold differences between samples, and to determine statistical significance.
Results
Intradermal injection of TLR-Ls induces rapid, systemic expansion of neutrophils and reduced PBMC numbers
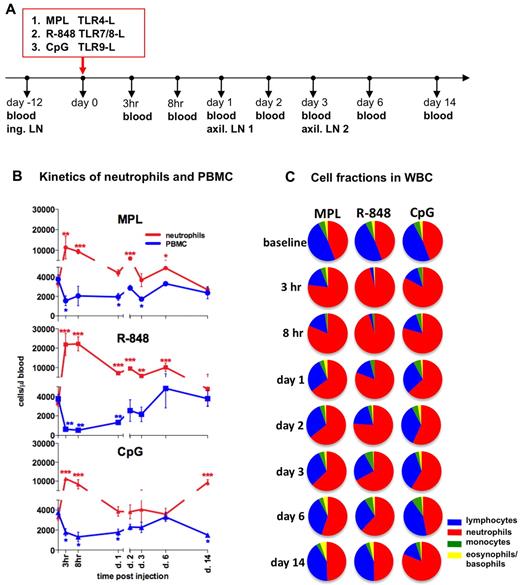
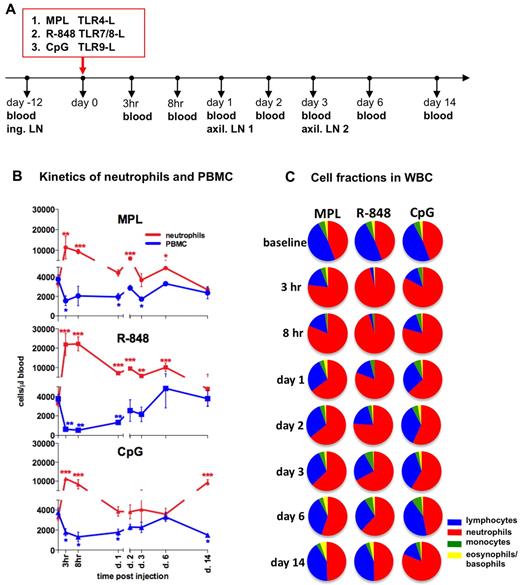
To assess the early systemic immune effects of TLR adjuvants, we intradermally injected (in the upper, back left and right flanks) rhesus macaques with MPL (group 1), R-848 (group 2), or CpG-ODN (group 3). We collected blood samples 12 days before injection (baseline) and then at 3 and 8 hours and 1, 2, 3, 6, and 14 days after injection (Figure 1A).
Injection of TLR-Ls induces rapid, systemic expansion of neutrophils and reduced PBMC numbers. (A) Experimental design. Rhesus macaques (n = 3) were injected intradermally with the TLR agonists MPL (100 μg), R-848 (2 mg), and CpG-ODN (2 mg) at day 0. Blood was collected for analysis before injection and at 3 and 8 hours and 1, 2, 3, 6, and 14 days after injection. Inguinal (ing.) LNs were collected before injection (day −12, baseline) and the left and right axillary (axil.) LNs at days 1 and 3 after injection. (B) Kinetics of total numbers of neutrophils (red) and PBMCs (blue) in blood were assessed within the total WBCs by hematologic analysis. The PBMC subset represents pooled numbers of lymphocytes and monocytes. Statistical analysis of cell kinetics indicates significant change relevant to the baseline. Data are means ± SEM. *P < .05; **P < .01; ***P < .001 by t test. (C) Fractions of neutrophils (red), lymphocytes (blue), monocytes (green), and basophils and eosinophils (yellow) were assessed as in panel B. Each pie chart shows the mean percentage of the indicated cell populations within the experimental group at the indicated time points.
Injection of TLR-Ls induces rapid, systemic expansion of neutrophils and reduced PBMC numbers. (A) Experimental design. Rhesus macaques (n = 3) were injected intradermally with the TLR agonists MPL (100 μg), R-848 (2 mg), and CpG-ODN (2 mg) at day 0. Blood was collected for analysis before injection and at 3 and 8 hours and 1, 2, 3, 6, and 14 days after injection. Inguinal (ing.) LNs were collected before injection (day −12, baseline) and the left and right axillary (axil.) LNs at days 1 and 3 after injection. (B) Kinetics of total numbers of neutrophils (red) and PBMCs (blue) in blood were assessed within the total WBCs by hematologic analysis. The PBMC subset represents pooled numbers of lymphocytes and monocytes. Statistical analysis of cell kinetics indicates significant change relevant to the baseline. Data are means ± SEM. *P < .05; **P < .01; ***P < .001 by t test. (C) Fractions of neutrophils (red), lymphocytes (blue), monocytes (green), and basophils and eosinophils (yellow) were assessed as in panel B. Each pie chart shows the mean percentage of the indicated cell populations within the experimental group at the indicated time points.
Injection of any of the TLR-Ls mediated a rapid increase in absolute numbers of WBCs beginning as early as at 3 hours and lasting for at least 8 hours before declining to baseline values by day 1 (supplemental Figure 1A). This increase was mostly because of increased numbers of neutrophils (Figure 1B-C). Neutrophils comprised 45% ± 4% (3299 ± 319 cells/μL) of all WBCs at baseline (Figure 1B-C). However, within 3 hours of injection of R-848, MPL, or CpG-ODN, 92% ± 3.2%, 76% ± 10.3%, and 82% ± 3.8%, respectively, of all WBCs were neutrophils (Figure 1C). Injection of any TLR-L induced a rapid increase in the absolute numbers of neutrophils within 3 hours, which declined substantially within 24 hours (Figure 1B). Administration of R-848 induced an increase of total neutrophils at 3 hours (21 855 ± 5701 cells/μL) and at 8 hours (22 206 ± 3607 cells/μL), significantly higher than other TLR agonists (Figure 1B and supplemental Figure 1B). Interestingly, there was a “secondary expansion” of neutrophils on day 14 in the animals that received CpG-ODN (Figure 1B-C). The kinetics of elevated frequencies and absolute numbers of neutrophils coincided with a decrease in frequencies and absolute numbers of PBMCs in all of the groups injected with TLR-Ls (Figure 1B-C).
In summary, injection of all 3 TLR adjuvants induced an increase in the frequencies and absolute numbers of neutrophils. Injection of R-848 induced highest expansion of neutrophils, which encompassed greater than 90% of the WBC population at 3-8 hours.
All TLR-Ls induce systemic expansion of monocytes, but only R-848 and CpG-ODN induce rapid, transient expansion of CD14+CD16+ inflammatory monocytes
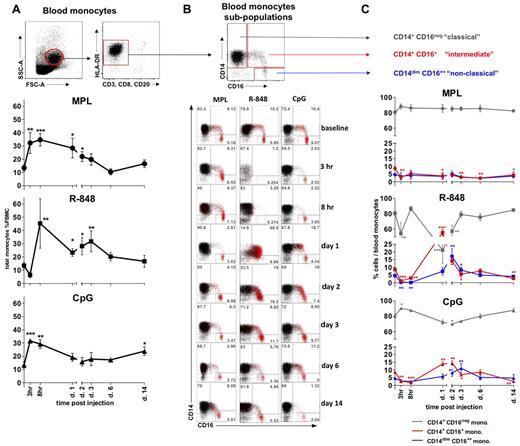
We assessed the frequencies of total monocytes defined within the SSC-AhiFSC-Ahi PBMCs as the CD3−CD8−CD20− HLA-DR+ population (Figure 2A). Injection of MPL and CpG-ODN induced, respectively, a 2.4- and 2.5-fold increase of monocyte frequencies at 3 hours (Figure 2A). These elevated numbers of total monocytes were detectable for up to 2 days and decreased to baseline values after day 3 (Figure 2A and data not shown). Despite an initial rapid reduction (Figure 2A), the frequencies and numbers of total monocytes rapidly rebounded at 8 hours after R-848 injection, and this increase was sustained for up to 6 days, reaching baseline levels by day 14 (Figure 2A and data not shown).
All TLR-Ls induce systemic expansion of monocytes, but only R-848 and CpG-ODN induce rapid, transient expansion of CD14+CD16+ inflammatory monocytes. (A) The total monocyte population was identified within the SSC-AhiFSC-Ahi PBMCs as the CD3−CD8−CD20− HLA-DR+ population. Kinetics of total monocyte frequencies within PBMCs were assessed at the indicated time points after TLR-L injection. (B) Three distinct subpopulations were defined within the total monocytes by CD14 and CD16 staining: CD14+CD16−, CD14+CD16+, and CD14dimCD16++. The flow cytometric dot blot representation of monocyte subpopulations frequencies within the total monocytes at baseline (day −12) and at 3 and 8 hours and 1, 2, 3, 6, and 14 days after TLR-L injection are shown. The CD16+ cells (red) are overlaid on the total monocyte population (black). Numbers in gates represent the frequency of distinct subpopulations within the total monocytes in one representative animal from each experimental group. (C) Kinetics of frequencies of the CD14+CD16− (gray), CD14+CD16+ (red), and CD14dimCD16++ (blue) subpopulations within the total monocytes were assessed at the indicated time points after TLR-L injection. Statistical analysis of cell kinetics in panels A and C indicates significant change relevant to the baseline. Data are means ± SEM. *P < .05; **P < .01; ***P < .001 by t test.
All TLR-Ls induce systemic expansion of monocytes, but only R-848 and CpG-ODN induce rapid, transient expansion of CD14+CD16+ inflammatory monocytes. (A) The total monocyte population was identified within the SSC-AhiFSC-Ahi PBMCs as the CD3−CD8−CD20− HLA-DR+ population. Kinetics of total monocyte frequencies within PBMCs were assessed at the indicated time points after TLR-L injection. (B) Three distinct subpopulations were defined within the total monocytes by CD14 and CD16 staining: CD14+CD16−, CD14+CD16+, and CD14dimCD16++. The flow cytometric dot blot representation of monocyte subpopulations frequencies within the total monocytes at baseline (day −12) and at 3 and 8 hours and 1, 2, 3, 6, and 14 days after TLR-L injection are shown. The CD16+ cells (red) are overlaid on the total monocyte population (black). Numbers in gates represent the frequency of distinct subpopulations within the total monocytes in one representative animal from each experimental group. (C) Kinetics of frequencies of the CD14+CD16− (gray), CD14+CD16+ (red), and CD14dimCD16++ (blue) subpopulations within the total monocytes were assessed at the indicated time points after TLR-L injection. Statistical analysis of cell kinetics in panels A and C indicates significant change relevant to the baseline. Data are means ± SEM. *P < .05; **P < .01; ***P < .001 by t test.
We also assessed the frequencies of monocyte subpopulations defined by the expression of the CD14 and CD16 surface markers26–28,30,32 (Figure 2B). MPL injection mobilized only the “classical” CD14+CD16− monocytes, with a noticeable diminution in the frequencies of the “intermediate” CD14+CD16+ monocytes starting at 3 hours and lasting up to 14 days (Figure 2B-C). No significant change in the frequency of the “nonclassical” CD14dimCD16++ subset was detectable throughout the study.
In contrast, despite an initial rapid decline in the frequencies of total monocytes at 3 hours, injection of R-848 yielded a striking increase in the frequencies of the “intermediate” CD14+CD16+ subpopulation that comprised as much as 55.5% ± 4.1% of all monocytes on day 1 (Figure 2B-C). The increase in the frequency of the “intermediate” CD14+CD16+ subpopulation of monocytes coincided with the diminution of the CD14+CD16− fraction on day 1 (Figure 2B-C). We also observed a maximal expansion in the frequency of “nonclassical” CD14dimCD16++ monocytes on day 2, 1 day after the peak expansion of the “intermediate” CD14+CD16+ subpopulation. Frequencies of both CD16pos monocyte fractions diminished in numbers on the following days (Figure 2B-C).
Injection of CpG-ODN resulted in an initial reduction in frequencies of the “intermediate” CD14+CD16+ subpopulation of monocytes (3 and 8 hours), followed by their significant increase on days 1 and 2 (Figure 2B-C). The frequency of the CD14+CD16+ monocytes diminished on day 3, coinciding with significant increase of the “patrolling” CD14dimCD16++ fraction. Frequencies of both CD16+ monocyte subpopulations were reduced to baseline levels by day 6, with the secondary decrease in the frequency of the “intermediate” subset at 14 days.
In summary, although all of the TLR agonists mediated a rapid (3-8 hours) expansion of the total numbers and frequencies of total blood monocytes, only R-848 and CpG-ODN significantly enhanced the frequency of “intermediate” CD14+CD16+ and “nonclassical” CD14dimCD16++ monocytes.
R-848 and CpG-ODN trigger DC activation in blood
We also evaluated the frequency and activation of mDCs and pDCs (supplemental Figure 2A) after TLR-L injection in PBMCs. Injection of MPL induced little or no detectable effect on the numbers or activation status of DCs (supplemental Figure 2B-C). Inoculation with R-848 resulted in a rapid decrease of the total numbers and frequencies of pDCs and mDCs within 3-8 hours after injection, with frequencies below 0.1% of PBMCs for each of the DC subtypes (supplemental Figure 2B-C and data not shown). Frequencies of pDCs returned to baseline values after 2 days; however, the percentages of mDCs remained significantly reduced for 2 weeks (supplemental Figure 2B-C). The residual pDCs and mDCs had highly enhanced expression of CCR7, CD80, and CD86 from 3 hours to 3 days after injection (supplemental Figure 2B-C).
Injection of CpG-ODN initially reduced the frequencies of mDCs on day 1, which returned to initial magnitude on day 2 with further decline on days 3-14 (supplemental Figure 2C). Frequencies of pDCs expanded significantly between 3 hours and 2 days after CpG-ODN immunization and declined to baseline levels on day 3 (supplemental Figure 2B). CpG-ODN injection promoted the enhanced expression of CCR7 on pDCs (supplemental Figure 2B) but only limited activation of mDCs (supplemental Figure 2C).
In summary, R-848 induced an initial decrease in the magnitudes of peripheral pDCs and mDCs but mediated their high activation. In contrast, injection of CpG-ODN resulted in the expansion of pDCs and the up-regulation of surface CCR7 expression. MPL had no discernible effect on peripheral DCs.
R-848 induces a robust, systemic increase in inflammatory cytokines
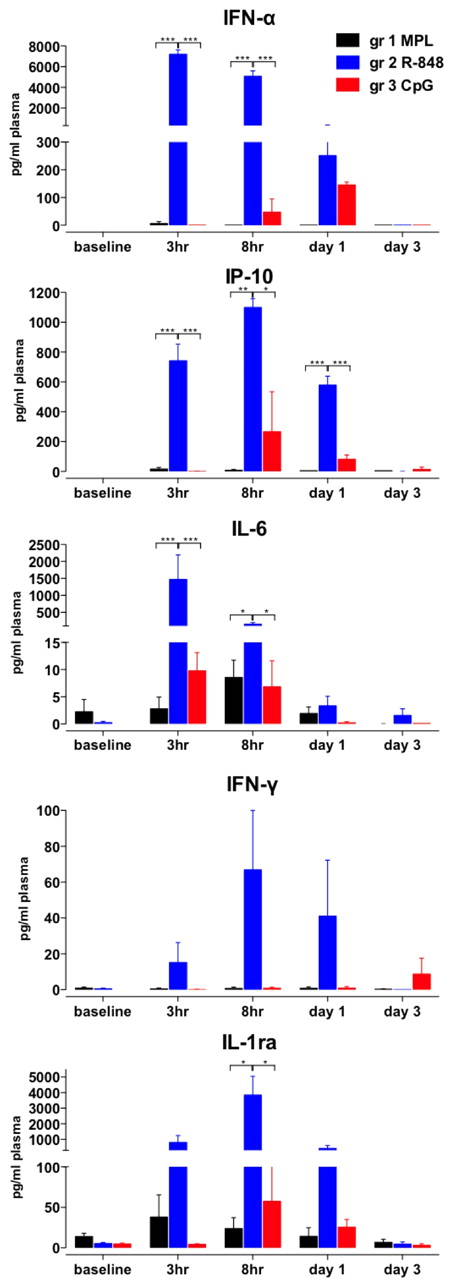
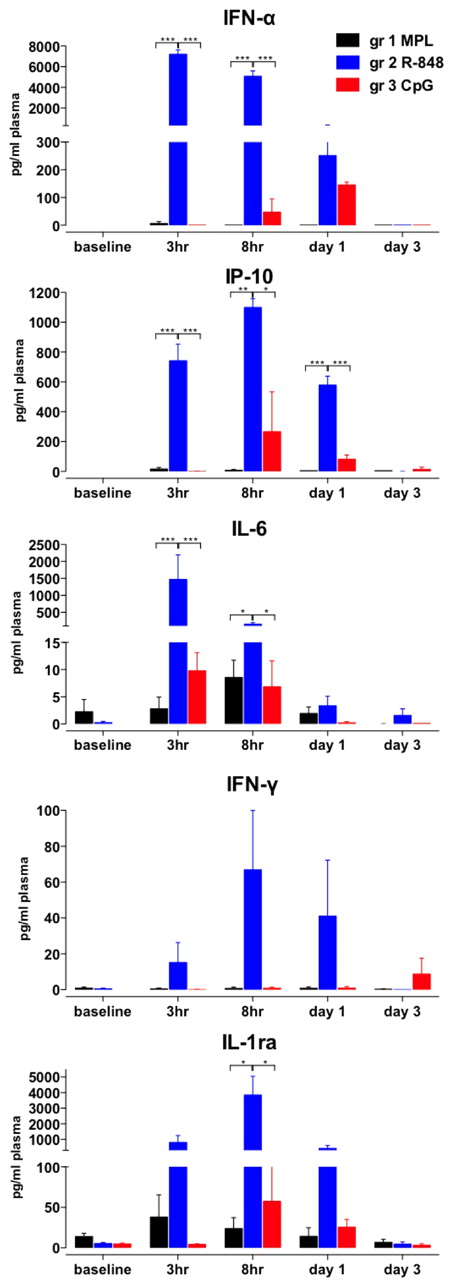
We also evaluated serum cytokines (Figure 3), and injection of R-848 stimulated robust secretion of IFN-α, IP-10, IL-6, and IL-1ra within 3-8 hours, significantly more than any other of the tested TLR-Ls (Figure 3). In addition, in animals that were injected with R-848 we detected high levels of serum IFN-γ and TNF-α (Figure 3 and data not shown). CpG-ODN also induced IFN-α, IL-6, IP-10 and IL-1ra between 3 hours and day 3, although significantly less than that induced by R-848 (Figure 3). Furthermore, CpG-ODN stimulated secretion of IFN-α and IP-10, albeit more slowly than R-848 (Figure 3). MPL induced the secretion of IL-6 and IL-1ra within the 3-8 hours after injection, but did not stimulate IFN-α, IFN-γ, or IP-10 (Figure 3). Therefore, R-848 injection induced a more rapid and abundant increase in systemic pro-inflammatory cytokines than other TLR-Ls.
R-848 induces robust, systemic increase in inflammatory cytokines. Plasma samples were collected at after TLR-L injection as described in Figure 1A. Cytokine concentrations were measured by an automated Luminex system (IFN-γ, IL-6, and IL-1ra) and ELISA (IP-10 and IFN-α) at the indicated time points (baseline, 3 hours, 8 hours, and 1 and 3 days) after TLR-L injection and are represented as the concentration (in picograms) of cytokines per milliliter of plasma. Data are means ± SEM. *P < .05; **P < .01; ***P < .001 by ANOVA.
R-848 induces robust, systemic increase in inflammatory cytokines. Plasma samples were collected at after TLR-L injection as described in Figure 1A. Cytokine concentrations were measured by an automated Luminex system (IFN-γ, IL-6, and IL-1ra) and ELISA (IP-10 and IFN-α) at the indicated time points (baseline, 3 hours, 8 hours, and 1 and 3 days) after TLR-L injection and are represented as the concentration (in picograms) of cytokines per milliliter of plasma. Data are means ± SEM. *P < .05; **P < .01; ***P < .001 by ANOVA.
Various TLR adjuvants induce blood transcriptional signatures that differ in potency, quality, and duration
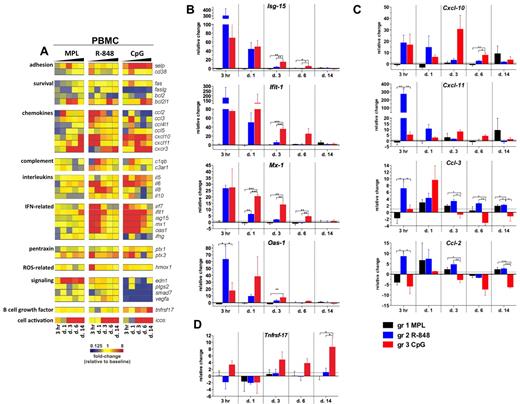
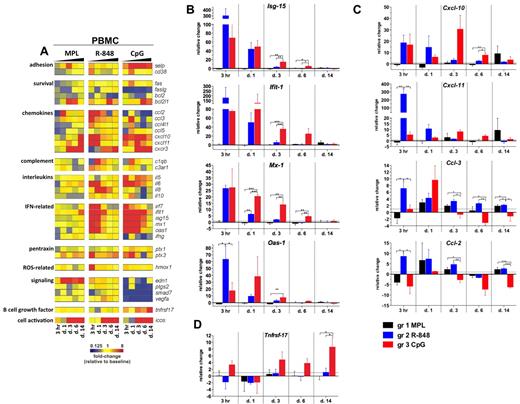
To determine the molecular signatures of the systemic immune responses mediated by TLR adjuvants, we evaluated the expression of selected gene transcripts in the total PBMCs. The genes for which mean mRNA transcription was differentially changed (ie, up- or down-regulated) from baseline (day −12) by at least 2-fold at any tested time point in any of the groups are presented as a gene-expression heat map in Figure 4A.
Signatures of inflammatory gene transcripts in PBMCs after TLR adjuvant injection. RNA was isolated from PBMCs cryopreserved with TRIzol reagent at 3 hours and 1, 3, 6, and 14 days after TLR-L injection and analyzed by low-density array quantitative real-time PCR for a panel of 93 genes involved in immune responses. All gene analytes at all time points were first normalized to the average cycling threshold value of expression of the housekeeping genes for 18s ribosomal RNA, Actb (β-actin), and Gusb (β-glucuronidase). Transcripts were grouped by their immune function and origin and their expression was evaluated at the time points matching innate cells kinetics in blood. (A) Heat map of gene transcripts. Each row represents the fold change relative to baseline (day −12) at the indicated time point after TLR-L injection in each of the experimental groups. The 34 genes with at least a 2-fold change from baseline at any given time point in any of the experimental groups are presented. Kinetics of expression of ISGs (B): Isg-15, Ifit-1, Mx-1, and Oas-1; chemokines (C): Cxcl-10 (IP-10), Cxcl-11 (I-TAC), Ccl-3 (MIP-1α), Ccl-2 (MCP-1), and the B-cell growth factor Tnfrsf-17 (D) are represented as the relative change in mRNA copies at the indicated time points after TLR-L injection compared with baseline (day −12). Dotted line marks the cutoff (y = 1) of relative expression change. Data are means ± SEM. *P < .05; **P < .01; ***P < .001 by ANOVA.
Signatures of inflammatory gene transcripts in PBMCs after TLR adjuvant injection. RNA was isolated from PBMCs cryopreserved with TRIzol reagent at 3 hours and 1, 3, 6, and 14 days after TLR-L injection and analyzed by low-density array quantitative real-time PCR for a panel of 93 genes involved in immune responses. All gene analytes at all time points were first normalized to the average cycling threshold value of expression of the housekeeping genes for 18s ribosomal RNA, Actb (β-actin), and Gusb (β-glucuronidase). Transcripts were grouped by their immune function and origin and their expression was evaluated at the time points matching innate cells kinetics in blood. (A) Heat map of gene transcripts. Each row represents the fold change relative to baseline (day −12) at the indicated time point after TLR-L injection in each of the experimental groups. The 34 genes with at least a 2-fold change from baseline at any given time point in any of the experimental groups are presented. Kinetics of expression of ISGs (B): Isg-15, Ifit-1, Mx-1, and Oas-1; chemokines (C): Cxcl-10 (IP-10), Cxcl-11 (I-TAC), Ccl-3 (MIP-1α), Ccl-2 (MCP-1), and the B-cell growth factor Tnfrsf-17 (D) are represented as the relative change in mRNA copies at the indicated time points after TLR-L injection compared with baseline (day −12). Dotted line marks the cutoff (y = 1) of relative expression change. Data are means ± SEM. *P < .05; **P < .01; ***P < .001 by ANOVA.
Injection of MPL stimulated a relatively weak transcriptional signature compared with that induced by R-848 or CpG-ODN; however, only MPL mediated the expression of endothelin-1 (Edn-1, Figure 4A). Interestingly, although MPL induced modest levels of IL-6 serum cytokines, induction of Il-6 gene expression was not detectable, possibly reflecting posttranscriptional mechanisms of regulation.
In contrast to MPL, R-848 triggered a rapid (3 hours) and robust transcription of several genes, including type I IFN–stimulated genes (ISGs) and chemokines, which returned to baseline levels by day 3 (Figure 4A-C). This was consistent with the serum cytokine data (Figure 3). Transcription of Il-6 was boosted at 3 hours and 1 day (Figure 4A). Interestingly, only R-848 injection induced high expression of Il-8 on days 1 and 3 (Figure 4A). Despite its potency, the transcriptional signature induced by R848 was short lived, with the expression of most genes declining to baseline levels by 3 days.
Injection of CpG-ODN also induced robust transcription of ISGs on day 1 (Figure 4A-B). In contrast to the transient induction of such genes induced by R-848, CpG-ODN induced a sustained induction of ISGs, which were still up-regulated on day 6 (Figure 4A-B). Furthermore, consistent with the serum cytokine data (Figure 3), CpG-ODN induced expression of Il-6 at 3 hours and at 1, 3, and 6 days (Figure 4A).
We also evaluated the expression of the Tnfrsf-17 (BCMA), a gene encoding a B-cell growth factor known to regulate Ab responses.35 Early expression of Tnfrsf-17 has been shown to be correlated with the magnitude of the later Ab titers in response to vaccination with yellow fever YF-17D36 or the inactivated influenza vaccine.37 In the present study, transcription of Tnfrsf-17 was increased at 3 hours and at 3, 6, and 14 days in the animals immunized with CpG-ODN, and at day 14, was significantly higher than in animals injected with MPL or R-848 (Figure 4A,D).
In summary, injection of R-848 induced a rapid (3 hours) and robust transcription of ISGs, chemokine genes, and cytokine genes that diminished after 1 day. In contrast, injection of CpG-ODN mediated the up-regulation of ISGs and chemokine genes, which was sustained for up to 6 days and induced the up-regulation of Tnfrsf-17.
Distinct TLR-Ls differentially enhance the frequencies and activation of monocytes in draining LNs
Although cellular and cytokine changes in the blood provide a surrogate measure of adjuvant activity, assessment of changes in draining LNs provides a more direct measure of adjuvant action. Therefore, we assessed changes in the frequencies and activation of APC subsets in the draining axillary LNs after TLR-L injection. We injected the TLR-Ls intradermally, proximal to the axillary LNs, evenly on the left and right sides of the upper back and then collected the draining left and right axillary LNs on days 1 and 3, respectively (Figure 1A). Because removal of axillary LNs before injection of TLR-Ls was not possible, we evaluated baseline conditions in the inguinal LNs.
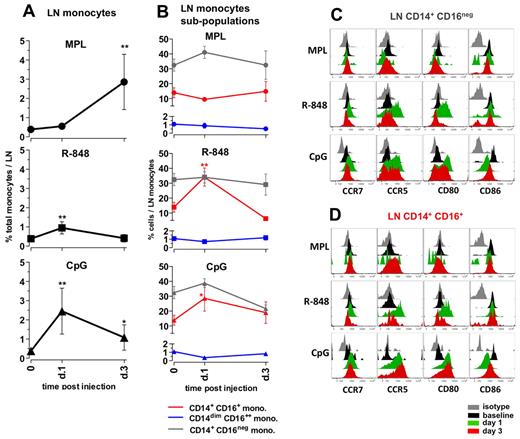
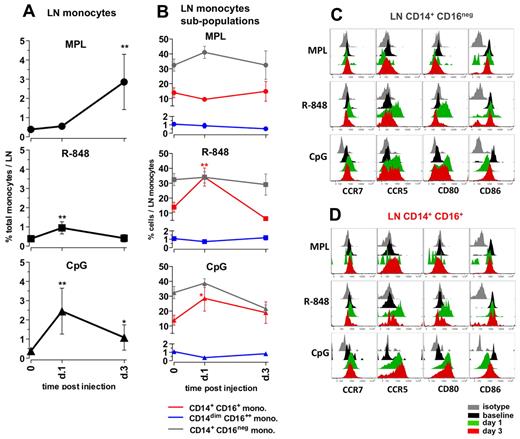
Administration of MPL resulted in a substantial increase in the frequencies of total monocytes, first detectable at day 3 (7.3-fold) and comprising approximately 3% of all cells in the LNs (Figure 5A). MPL did not induce a significant change in the frequencies of CD14/CD16 subpopulations within the monocytes (Figure 5B); however, on day 3, the CD14+CD16+ monocytes expressed high surface CCR5, but little or no CD80 or CD86 (Figure 5D). The increase in the numbers of the CD14+ monocytes was consistent with the increased numbers of cells expressing CD16328,32 observed in LN sections from animals injected with MPL (supplemental Figure 3).
Distinct TLR-ligands differentially enhance the frequencies and activation of monocytes in draining LNs. (A) The total monocyte population was identified within the SSC-AhiFSC-Ahi LN cells as the CD3−CD8−CD20− HLA-DR+ population. Kinetics of frequencies of total monocytes within the LNs were assessed at days 1 and 3 after TLR-L injection. (B) Kinetics of frequencies of the CD14+CD16− (gray), CD14+CD16+ (red), and CD14dimCD16++ (blue) subpopulations within the total LN monocytes were defined at days 1 and 3 after TLR-L injection. Statistical analysis in panels A and B indicates significant change relevant to baseline. Data are means ± SEM. *P < .05; **P < .01; ***P < .001 by t test. Activation phenotypes of the CD14+CD16− (C) and CD14+CD16+ (D) monocytes were measured by expression of the surface markers CCR7, CCR5, CD80, and CD86 at days 1 and 3 after TLR-L injection. Histograms represent the isotype control (gray), baseline at day −12 (black) and at day 1 (green) and day 3 (red) after TLR-L injection. A single representative animal is shown for each experimental group.
Distinct TLR-ligands differentially enhance the frequencies and activation of monocytes in draining LNs. (A) The total monocyte population was identified within the SSC-AhiFSC-Ahi LN cells as the CD3−CD8−CD20− HLA-DR+ population. Kinetics of frequencies of total monocytes within the LNs were assessed at days 1 and 3 after TLR-L injection. (B) Kinetics of frequencies of the CD14+CD16− (gray), CD14+CD16+ (red), and CD14dimCD16++ (blue) subpopulations within the total LN monocytes were defined at days 1 and 3 after TLR-L injection. Statistical analysis in panels A and B indicates significant change relevant to baseline. Data are means ± SEM. *P < .05; **P < .01; ***P < .001 by t test. Activation phenotypes of the CD14+CD16− (C) and CD14+CD16+ (D) monocytes were measured by expression of the surface markers CCR7, CCR5, CD80, and CD86 at days 1 and 3 after TLR-L injection. Histograms represent the isotype control (gray), baseline at day −12 (black) and at day 1 (green) and day 3 (red) after TLR-L injection. A single representative animal is shown for each experimental group.
Injection of R-848 induced a minor increase in the frequencies of total monocytes on day 1. Similarly to the systemic response mediated by R-848, there was an increase in the frequencies of the CD14+CD16+ population within the total LN monocytes on day 1 that diminished on day 3 (Figure 5B). Both the “classical” CD14+CD16− and the “intermediate” CD14+CD16+ subsets of monocytes expressed high levels of CCR5 and CD80 at day 1 that diminished by day 3 (Figure 5C-D).
Injection of CpG-ODN enhanced the frequencies of total monocytes (6.3-fold) on day 1 after injection, and these significantly increased numbers were sustained until day 3 (Figure 5A). This was consistent with the increased numbers of CD163+ cells on day 1 detectable by immunohistochemistry staining (supplemental Figure 3). Further, CpG-ODN boosted frequencies of the “intermediate” CD14+CD16+ fraction of monocytes on day 1, which diminished on day 3. Interestingly, both the CD14+CD16− and CD14+CD16+ fractions of monocytes expressed elevated levels of CCR5, CCR7, and CD80 on days 1 and 3 (Figure 5C-D).
In summary, 3 TLR-Ls induced distinct changes in the frequencies and activation status of monocytes in draining LNs. MPL induced expansion of monocytes at day 3, but these cells did not express high levels of CD80 and CD86 relative to baseline. R848 induced a modest expansion of the CD14+CD16+ subset of monocytes at day 1, but strikingly enhanced expression of CD80 and CCR5 on monocytes at day 1. CpG-ODN induced enhanced expansion of total monocytes and the fraction of CD14+CD16+ cells at day 1 that expressed higher levels of CCR5 and CD80 until day 3.
TLR-ligands induce distinct patterns of enhancing the frequencies and activation of DCs in draining LNs
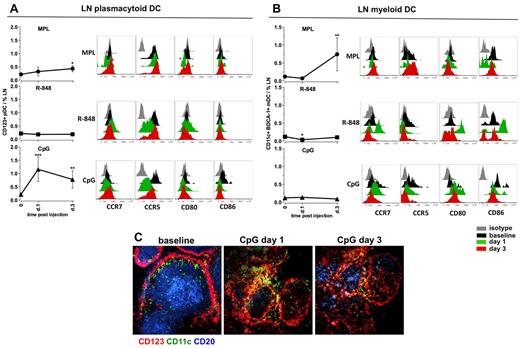
We also assessed the frequencies and activation phenotypes of mDCs and pDCs in draining LNs after injection of TLR-L. Injection of MPL resulted in mobilization of the mDCs (6.2-fold), but only a modest expansion of pDCs at day 3 (Figure 6A-B). However, we did not observe an increase in expression of activation markers on either of the DC subsets (Figure 6A-B). R-848 did not increase the frequencies of either DC subset, although the mDCs presented a highly activated phenotype by high expression of CD80 and CD86 and a decrease in CCR5 on pDCs on day 1, which returned to baseline levels by day 3 (Figure 6A-B).
MPL and CpG-ODN increase the numbers of activated DCs in draining LNs. Kinetics of frequencies of pDCs (A) and mDCs (B) were defined within the cells isolated from LNs by flow cytometry, as described in supplemental Figure 2. Statistical analysis indicates a significant change of cell frequency relevant to the baseline. Data are means ± SEM. *P < .05; **P < .01; ***P < .001 by t test. Activation and maturation profiles were measured by assessing the expression of the surface markers CCR7, CCR5, CD80, and CD86 at days 1 and 3 after TLR-L injection. Histograms represent the isotype control (gray), baseline at day −12 (black) and day 1 (green) and day 3 (red) after TLR-L injection. A single representative animal is shown for each experimental group. (C) Immunohistochemistry staining was performed on frozen LN sections for evaluating the in situ localization of APCs in the animals injected with CpG-ODN (days 1 and 3). Cells were assessed by CD123 (red) and CD11c (green) staining; B-cell follicles were visualized by CD20 staining (blue). One representative animal from the CpG-ODN experimental group is represented.
MPL and CpG-ODN increase the numbers of activated DCs in draining LNs. Kinetics of frequencies of pDCs (A) and mDCs (B) were defined within the cells isolated from LNs by flow cytometry, as described in supplemental Figure 2. Statistical analysis indicates a significant change of cell frequency relevant to the baseline. Data are means ± SEM. *P < .05; **P < .01; ***P < .001 by t test. Activation and maturation profiles were measured by assessing the expression of the surface markers CCR7, CCR5, CD80, and CD86 at days 1 and 3 after TLR-L injection. Histograms represent the isotype control (gray), baseline at day −12 (black) and day 1 (green) and day 3 (red) after TLR-L injection. A single representative animal is shown for each experimental group. (C) Immunohistochemistry staining was performed on frozen LN sections for evaluating the in situ localization of APCs in the animals injected with CpG-ODN (days 1 and 3). Cells were assessed by CD123 (red) and CD11c (green) staining; B-cell follicles were visualized by CD20 staining (blue). One representative animal from the CpG-ODN experimental group is represented.
In contrast, CpG-ODN significantly augmented the frequencies of pDCs on day 1 (5.5-fold, Figure 6A). The high numbers of pDCs were still evident on day 3 (Figure 6A). The augmented numbers of CD123+ cells were also detectable in the sections of draining LNs on days 1 and 3 after CpG-ODN injection (Figure 6C). Local pDCs diminished the expression of CCR5 on day 1, but no up-regulation of CCR7, CD80, or CD86 was detectable (Figure 6A). Immunization with CpG-ODN did not affect the frequencies of mDCs in draining LNs, but did enhance their expression of CD80 on days 1 and 3 (Figure 6B).
In summary, MPL induced expansion of mDCs at day 3, but these cells did not express high levels of CD80 and CD86 relative to baseline. R-848 did not induce expansion of the DC subsets, but did enhance the expression of CD80 and CD86 on mDCs at day 1. CpG-ODN enhanced the numbers of pDCs on days 1 and 3.
Different TLR adjuvants mediate distinct transcriptional signatures in LNs
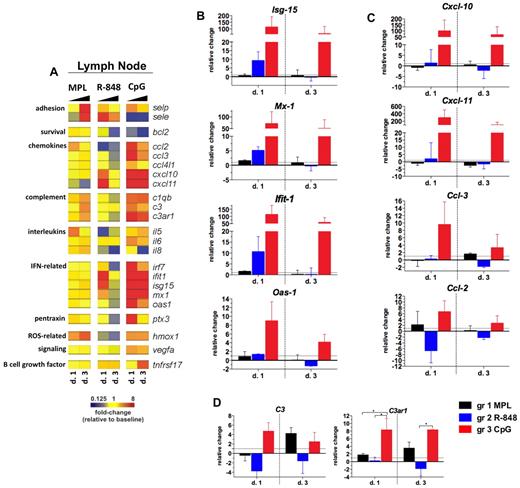
To investigate the local molecular signatures mediated by injection of TLR-Ls, we examined the expression of selected genes in draining LN cells (Figure 7A) using a similar approach as in PBMCs (Figure 4).
Ligands for TLR-4 and TLR-9 induce prolonged pro-inflammatory gene transcription in draining LNs. RNA was isolated from the LN whole-cell population cryopreserved with TRIzol reagent on days 1 and 3 after TLR-L injection, and were analyzed by low-density array quantitative real-time PCR for a panel of 93 genes involved in immune responses. All genes and time points were first normalized to the average cycling threshold value of expression of the housekeeping genes for 18s ribosomal RNA, Actb (β-actin), and Gusb (β-glucuronidase). Transcripts were grouped by their immune function and origin and their expression was evaluated at the time points matching the innate cell kinetics in blood. (A) Heat map of gene transcripts. Each row represents a mean –fold change relative to baseline at the indicated time point after TLR-L injection in each of the experimental groups. The 23 genes with a significant change from baseline at any given time point and experimental group are shown. Kinetics of expression of the ISGs Isg-15, Ifit-1, Mx-1, and Oas-1 (B); the selected chemokines: Cxcl-10 (IP-10), Cxcl-11 (I-TAC), Ccl-3 (MIP-1α), and Ccl-2 (MCP-1) (C); and complement genes: C3 and C3ar1 (D) are represented as the relative change of mRNA copies at the indicated time points after TLR-L injection compared with baseline. Dotted line marks the cutoff (y = 1) of the fold expression change. Data are means ± SEM. *P < .05; **P < .01; ***P < .001 by ANOVA.
Ligands for TLR-4 and TLR-9 induce prolonged pro-inflammatory gene transcription in draining LNs. RNA was isolated from the LN whole-cell population cryopreserved with TRIzol reagent on days 1 and 3 after TLR-L injection, and were analyzed by low-density array quantitative real-time PCR for a panel of 93 genes involved in immune responses. All genes and time points were first normalized to the average cycling threshold value of expression of the housekeeping genes for 18s ribosomal RNA, Actb (β-actin), and Gusb (β-glucuronidase). Transcripts were grouped by their immune function and origin and their expression was evaluated at the time points matching the innate cell kinetics in blood. (A) Heat map of gene transcripts. Each row represents a mean –fold change relative to baseline at the indicated time point after TLR-L injection in each of the experimental groups. The 23 genes with a significant change from baseline at any given time point and experimental group are shown. Kinetics of expression of the ISGs Isg-15, Ifit-1, Mx-1, and Oas-1 (B); the selected chemokines: Cxcl-10 (IP-10), Cxcl-11 (I-TAC), Ccl-3 (MIP-1α), and Ccl-2 (MCP-1) (C); and complement genes: C3 and C3ar1 (D) are represented as the relative change of mRNA copies at the indicated time points after TLR-L injection compared with baseline. Dotted line marks the cutoff (y = 1) of the fold expression change. Data are means ± SEM. *P < .05; **P < .01; ***P < .001 by ANOVA.
Injection with CpG-ODN resulted in a robust ISG signature on day 1 that was maintained until day 3 (Figure 7B). This high, CpG-ODN–mediated increase in the expression of ISGs was consistent with the enhanced frequencies of pDCs in the LNs on days 1 and 3 (Figure 6A). Injection of CpG-ODN also triggered expression of chemokine genes on day 1, with the high transcription of Cxcl-10 and Cxcl-11 still evident on day 3 (Figure 7C). CpG-ODN also enhanced the expression of the complement genes that were correlated with high frequency of activated monocytes in the LNs on day 1 (Figure 5A), similarly to the animals injected with MPL.
In contrast to the robust effects of CpG-ODN, injection of MPL or R-848 resulted in a less striking signature in the LNs. Injection of MPL induced the expression of complement genes and adhesion molecules on day 3 (Figure 7A,D). Complement and adhesion gene expression was associated with the increased frequency of the monocytes (Figure 5A) and mDCs (Figure 6B) in the LNs on day 3. Injection of R-848 induced increased expression of ISGs and Cxcl-10 and Cxcl-11 only on day 1 (Figure 7A-C).
In summary, only CpG-ODN induced robust and sustained expression of genes encoding proteins involved in the antiviral and inflammatory responses in draining LNs. Injection of MPL or CpG-ODN also increased complement gene transcription in the LNs on days 1 (CpG-ODN only) and 3 (CpG-ODN and MPL), which was associated with the increased numbers of monocytes in draining LNs.
Discussion
Recent studies have determined the early immune events induced by MF59, alum, or CpG-ODN in vivo in mice.38–40 However, to our knowledge, there has been no systematic evaluation of the early innate immune responses to TLR-Ls in nonhuman primates. In the present study, we performed a detailed analysis of the local and systemic effects of MPL, R-848, and CpG-ODN in this context, and our results indicate that the adjuvants differ considerably in the local and systemic responses that they induce (summarized in Table 1).
All 3 adjuvants rapidly induced systemic changes in the cellular, transcriptional, and cytokine responses in the blood. Therefore, all TLR-Ls induced a rapid and robust expansion in the numbers of neutrophils in the blood (3-8 hours), with R848 inducing the most robust increase. Neutrophils can quickly mobilize from the BM to the blood in response to infections,24,25 and this is consistent with their increased numbers only hours after TLR-L injection (Figure 1B-C). Interestingly, we detected enhanced gene expression of IL-8 (Cxcl-8), a potent neutrophil chemoattractant, in the R848 group (Figure 4A). We also observed a “secondary” expansion of neutrophils in the animals injected with TLR9-L at day 14. This may reflect a sustained action of the PTO-stabilized CpG-ODN, which may persist at the site of injection and draining LNs and stimulate innate immune cells.
In addition to neutrophils, the 3 adjuvants differentially mobilized distinct blood monocyte subpopulations27,28,30,32 (Figure 2). The “intermediate” CD14+CD16+ population expands under inflammatory conditions,26,29 whereas the CD14dimCD16++ cells seem analogous to murine “patrolling” Gr-1− monocytes.32 We observed striking differences in the type of monocyte subsets expanded by the different ligands. MPL only expanded the CD14+CD16− monocytes, whereas both R-848 and CpG-ODN induced a profound increase in the frequencies of the “inflammatory” CD14+CD16+ monocytes (days 1-2) that was followed by a peak in numbers of the CD14dimCD16++ cells (days 2-3; Figure 2B-C). This distinct mobilization of monocytes may be caused by differential expression of various TLRs by distinct monocyte subsets (supplemental Figure 4). In humans, all subsets of monocytes have been reported to express TLR4, TLR7, and TLR8,32 and our data show that the CD14+CD16+ and CD14dimCD16++ subpopulations have high TLR-7 expression (supplemental Figure 4). Furthermore, the so-called “patrolling” CD14dimCD16++ is the monocyte subset known to efficiently sense nucleic acids and viruses through TLR7/8, and this subset can be stimulated by TLR7/8 ligands (but not by LPS) to produce TNF-α, IL-1β, and CCL-3.32 In contrast, both the CD14+CD16− and CD14+CD16+ subsets efficiently respond to TLR2 and TLR4, but not to TLR7/8, and can be stimulated by LPS.32 These data demonstrate that both TLR7/8-L and TLR-9L, but not TLR-4L, enhance the frequencies of CD14+CD16+ and CD14dimCD16++ monocytes. This is consistent with the fact that these TLR-Ls induce more type I IFNs than MPL (Figures 3, 4A-B). Indeed, type I IFNs mobilize inflammatory monocytes during viral infection in mice.41,42 In addition, there is recent evidence that mDCs stimulated in vitro with LPS secrete high amounts of IL-1043 ; however, we did not detect any transcriptional evidence of increased IL-10 production in the blood of animals treated with MPL.
These effects in the blood are similar to those observed in the LNs. MPL induced an expansion of only the CD14+CD16− subset, whereas both R-848 and CpG-ODN mobilized the CD14+CD16+ monocytes. However, unlike in the blood, the “patrolling” CD14dimCD16++ monocytes were not expanded in the LNs. The consequences of this differential induction of the distinct monocyte subsets on innate and adaptive responses and adjuvant toxicity clearly need to be investigated further.
A key observation in draining LNs is that different TLR adjuvants exert distinct effects on the numbers and activation status of mDCs and pDCs. Only MPL induces the expansion of mDCs, but appears not to enhance their expression of costimulatory molecules (Figure 6). Expansion of mDCs and monocytes in LNs stimulated by MPL was delayed compared with CpG-ODN and was detectable on day 3, but not earlier on day 1. In contrast, R848 and CpG-ODN did not induce the expansion of mDCs, but did induce the up-regulation of costimulatory molecules on these cells. Only CpG-ODN, and not the other TLR-Ls, induced the expansion of pDCs. However, CpG-ODN did not result in the up-regulation of costimulatory molecules on pDCs, although a robust type I IFN signature was induced in draining LNs, as evidenced by the transcriptomics data (Figure 7).
Finally, the TLR-Ls used in the present study were not formulated or mixed with any synthetic carrier, and therefore the innate immune responses induced by the TLR adjuvants are solely because of their sensing by TLRs, rather than by other mechanisms involving the formulation. We injected 100 μg of unformulated MPL, a dose that was reported previously to stimulate profound adjuvant effects in vivo.9,13,44 Although unformulated MPL is prone to form aggregates, which may decrease its bioavailability,45 we detected mobilization of neutrophils and monocytes in the periphery, followed by the expansion of the latter in draining LNs. Therefore, even an unformulated, soluble MPL was able to stimulate a potent systemic and local response, which is in agreement with previous reports in murine models.18,44 Furthermore, we used 2 mg of R-848 (resiquimod), a dose used previously in nonhuman primates.9,34,46,47 R-848 mediated rapid inflammatory responses that resolved within 1-2 days after immunization, likely because of the instability of the compound in vivo. This was consistent with elevated levels of the R-848 molecules in the serum, which were detectable only at 3 hours after injection (supplemental Figure 5). We did not detect a correspondingly robust innate response in draining LNs, which may reflect the fact that R-848 rapidly diffuses from the site of injection and may not be available for sensing by local APCs.48 Our data suggest that the formulation or conjugation of R848 with an Ag would be optimal for efficient induction of adaptive immune responses.9,46,49,50 Finally, we injected 2 mg of PTO-stabilized CpG-ODN type B (also referred to as K51 ), which has been reported to stimulate mostly B-cell activation.51 The PTO modification of the CpG-ODN adjuvant improves the in vivo stability of the TLR9-L in vivo.45 The sustained bioavailability of CpG-ODN may explain the significant increase in ISG and chemokine gene expression in the blood, which lasted up 6 days after injection, as well as the mobilization of activated monocytes and pDCs in draining LNs that was still detectable on day 3 after injection.
In summary, we present a detailed characterization of the innate responses to TLR-Ls in nonhuman primates in vivo (Table 1). Our findings demonstrate distinct patterns of in vivo stimulation as a result of TLR4-, TLR7/8-, or TLR9-triggered innate immunity using a class of emerging or already licensed adjuvants.
The online version of this article contains a data supplement.
The publication costs of this article were defrayed in part by page charge payment. Therefore, and solely to indicate this fact, this article is hereby marked “advertisement” in accordance with 18 USC section 1734.
Acknowledgments
The authors thank Stephanie Ehnert, Elizabeth Strobert, Jack Orkin, and all Yerkes National Primate Research Center personnel for their excellent care of the animals and for sample collections; Natalia Kozyr at Emory Center for AIDS Research at Yerkes National Primate Research Center for her assistance in performing the real-time PCR in PBMCs and LNs; Barbara Cervasi and Kiran Gill for outstanding help with monocyte sorting; John Connolly's core laboratory at the Baylor Institute (Dallas, TX) for Luminex analysis; and Sarah Pruett at the Biomarker Core Laboratory at Yerkes National Primate Research Center for mass spectrometry analysis.
This study was supported by grants from the National Institutes of Health (grants 5U19 AI057266-05 and 1P01AI096187-01) and the Bill and Melinda Gates Foundation (subcontract from the Fred Hutchinson Cancer Institute).
National Institutes of Health
Authorship
Contribution: M.K., H.I.N., and H.O. performed the experiments; M.K. and H.I.N. analyzed the results and produced the figures; and M.K. and B.P. designed the research and wrote the manuscript.
Conflict-of-interest disclosure: The authors declare no competing financial interests.
The current affiliation for H.O. is National Institutes of Health Tetramer Facility, Emory University, Atlanta, GA.
Correspondence: Bali Pulendran, Emory Vaccine Center, Emory University, 954 Gatewood Rd, Atlanta, GA 30329; e-mail: bpulend@emory.edu.

