Abstract
Friend leukemia virus integration 1 (FLI1), an Ets transcription factor family member, is linked to acute myelogenous leukemia (AML) by chromosomal events at the FLI1 locus, but the biologic impact of FLI1 expression on AML is unknown. FLI1 protein expression was measured in 511 newly diagnosed AML patients. Expression was similar in peripheral blood (PB) and BM and higher at diagnosis than at relapse (P = .02). Compared with normal CD34+ cells, expression in AML was above or below normal in 32% and 5% of patients, respectively. Levels were negatively correlated with an antecedent hematologic disorder (P = .002) but not with age or cytogenetics. Mutated NPM1 (P = .0007) or FLT3-ITD (P < .02) had higher expression. FLI1 levels were negatively correlated with 10 of 195 proteins associated with proliferation and stromal interaction, and positively correlated (R > 0.3) with 19 others. The FLI1 level was not predictive of remission attainment, but patients with low or high FLI1 expression had shorter remission duration (22.6 and 40.3 vs 51.1 weeks, respectively; P = .01) and overall survival (45.2 and 35.4 vs 59.4 weeks, respectively; P = .03). High FLI1 levels were adverse in univariate and multivariate analysis. FLI1 expression is frequently abnormal and prognostically adverse in AML. FLI1 and/or its response genes may be therapeutically targetable to interfere with AML cell biology.
Introduction
Friend leukemia virus integration 1 (FLI1), a member of the ETS transcription factor family, was first identified as a proto-oncogene by its presence near a common site for retroviral integration in Friend virus–induced erythroleukemias.1,2 FLI1 plays a critical role in normal development, hematopoiesis, and oncogenesis, functioning as both a transcriptional activator and repressor. In adults, FLI1 is highly expressed in hematopoietic tissues and vascular endothelial cells, with lower levels detected in lung, heart, and ovaries.2-6 Studies have shown that murine FLI1 is essential for embryonic development: the loss of FLI1 results in embryonic lethality due in part to absence of megakaryocytes and aberrant vasculogenesis.7-9 Loss of FLI1 negatively affects hematopoietic stem cell differentiation, consistent with its role in the regulation of important stem-cell–regulatory genes.7-9 FLI1 is also required for maintaining the proper number of neutrophils, monocytes, and natural killer cells10 and B-cell populations.11
Deregulated expression of ETS proteins is associated with aberrant development and malignant transformation.12,13 Specifically, FLI1 is aberrantly expressed in retrovirus-induced hematologic tumors in mice and is found to be rearranged in human Ewing sarcoma and related primitive neuroectodermal tumors characterized by a t(11;22)(q24;q12) translocation. Aberrant expression of FLI1 is strongly associated with progression in malignant melanoma.14 Limited attention has been directed toward elucidating the role of FLI1 in epithelial-derived cancers, and the available data regarding its role in epithelial cancer progression are conflicting. FLI1 mRNA levels are decreased in mouse mammary tumors compared with normal mouse tissue and cell lines.15 Furthermore, FLI1 mRNA and protein levels are decreased in the human breast cancer cell lines, and FLI1 mRNA levels were decreased in a small sample of human primary breast tumors.16 In contrast, it has been reported that the expression of FLI1 may contribute to the progression of human breast cancer by regulating the bcl-2 gene, inhibiting apoptosis in invasive breast cells.17 Whereas the majority of the data are consistent with loss of FLI1 in breast cancer, the precise pattern of expression may be cancer specific. For example, FLI1 may have an oncogenic function in colon cancer.18
Amplification of the FLI1 gene in acute myeloid leukemia (AML) was detected in 2 case reports,19,20 and FLI1 expression levels were up-regulated several fold in 2 acute promyelocytic leukemia (APL) patients compared with the 4 normal pooled BM samples.21 Expression of an alternative spliced form known as FLI1b was detected in 2 human B-cell leukemias.22 FLI1 mRNA expression was observed to be significantly higher in essential thrombocythemia patients with JAK2 (V617F) mutations.23 The FLI1 site is also usually encompassed in chromosomal events that involve the 11q23 loci in both AML and myelodysplasia.24 Chromosomal events therefore link FLI1 to leukemia, but the role of FLI1 in hematologic malignancies remains undefined.
The oncogenic effects of FLI1 overexpression in erythrocytes are thought to arise from the downstream effects of altered transcription of the genes that it regulates, which leads to altered cellular signaling events in EPO1 and RAS pathways. FLI1 is also known to activate or inactivate a wide variety of genes that may promote tumorigenesis, such as GADD153, Tenascin-C, MDM2, BCL-2, GATA-1, and RB (supplemental Figure 1, available on the Blood Web site; see the Supplemental Materials link at the top of the online article).5,25-30 SHIP-1 is directly negatively regulated by FLI1, and the resulting loss of inositol phosphatase activity was associated with accelerated leukemogenesis.31 The effects of altered FLI1 expression at the protein level have not been well studied.
In the present study, we measured the expression of FLI1, along with 195 other proteins, in 511 patients of AML using reverse-phase protein array (RPPA) technology. We report a correlation between FLI1 expression and clinical characteristics and overall survival in AML patients.
Methods
Patient population
Peripheral blood (PB) and BM specimens were collected from 511 patients with newly diagnosed AML and from 20 patients with newly diagnosed APL evaluated at The University of Texas M. D. Anderson Cancer Center (MDACC) between September 1999 and March 2007. Samples were acquired during routine diagnostic assessments in accordance with the regulations and protocols (Lab 01-473) approved by the investigational review board of MDACC. Informed consent was obtained in accordance with Declaration of Helsinki. Samples were analyzed under and a review board–approved laboratory protocol (Lab 05-0654). Samples were enriched for leukemic cells by performing Ficoll separation to yield a mononuclear fraction, followed by CD3/CD19 depletion to remove contaminating T and B cells if they were calculated to be > 5% based on the differential. The samples were normalized to a concentration of 1 × 10⁴ cells/μL, and a whole-cell lysate was prepared as described previously.32,33 A total of 387 BM and 283 PB samples were studied from the newly diagnosed AML patients, with 140 having both available. All but one relapse sample were from BM. A paired relapse sample was available for 48 of the AML and 1 of the APL patients. Outcomes analysis for this report is restricted to the newly diagnosed patients. The associated demographics are described in Table 1. Whereas this population is typical for the MDACC referral pattern, the median age of these patients (65.7 years) is older than the national average of 58 years, and this population has a high percentage of patients with unfavorable cytogenetics (49%) and a very high percentage with an antecedent hematologic disorder (40%).
Of the 511 AML patients, 415 were treated at MDACC and are evaluable for outcome. Among these, 277 received high-dose arabinofuranosyl cytidine (Ara-C) 191 with an anthracycline, 49 with fludarabine, 28 with clofarabine, 8 with other agents, and 1 with high-dose Ara-C alone. Another 35 received standard-dose Ara-C with clofarabine (n = 33) or with daunorubicin and etoposide (n = 2), and 8 received low-dose Ara-C–based regimens. Idarubicin and troxacitabine were used in 2 patients and VNP40101M was used for 25. Demethylating or histone-deacetylating agents were used alone or in combination in 45 patients. Targeted agents were used in 13 patients; of these, 6 received gemtuzumab ozogamicin in combination with IL-11, and 4 received phase 1 agents. One APL patient was treated with idarubicin plus Ara-C; all others were treated with all-trans retinoic acid–based regimens, 14 in combination with arsenic, 2 with gemtuzumab-ozogamicin, 2 with idarubicin, and 1 with liposomal all-trans retinoic acid. All but one achieved complete remission (CR) and 4 relapsed.
RPPA methodology
Proteomic profiling was performed on samples from patients with AML. The methodology and validation of the technique have been described previously.32-34 Briefly, patient samples were printed in 5 serial dilutions onto slides along with normalization and expression controls. Slides were probed with a strictly validated rabbit anti–human polyclonal primary Ab against total FLI1,7 a secondary Ab to amplify the signal, and finally a stable dye was precipitated.35 The stained slides were analyzed using Microvigene Version 2.9 software (Vigene Tech) to produce quantified data. Western blotting was performed using standard techniques for correlation with RPPA data on a limited number of cell lines and patient samples.
FLT3 and NPM1 mutational analysis
FLT3 and NPM1 mutational analysis were performed by RT-PCR amplification, followed by sequencing using standardized primers and methodology. For most patients, this was determined as part of routine care by the Clinical Laboratory Improvement Amendments (CLIA)–approved molecular hematology laboratory at MDACC. For older patients, this was determined by us (in the S.M.K. laboratory) using the same primers used by the clinical laboratory.
Statistical analysis
Supercurve algorithms were used to generate a single value from the 5 serial dilutions.36 Loading control37 and topographical normalization procedures accounted for protein concentration and background staining variations. Analysis using unbiased clustering and perturbation bootstrap clustering, and principle component analysis was then performed as described previously.34 Expression was compared with that observed in normal CD34+ samples, and the patients were divided into 3 cohorts based on whether expression was above, below, or within the range of the normal CD34+ samples based on the 95% confidence intervals.
Comparison of the protein levels between paired samples was done by performing the paired t test. Association between protein expression levels and categorical clinical variables were assessed in R using standard t tests, linear regression, or mixed-effects linear models. Association between continuous variable and protein levels were assessed using Pearson and Spearman correlation and linear regression. Bonferroni corrections were performed to account for multiple statistical parameters for calculating statistical significance. The Kaplan-Meier method was used to generate the survival curves. Univariate and multivariate Cox proportional hazard modeling was performed to investigate association with survival with protein levels as categorized variables using Statistica Version 10 software (StatSoft). This dataset contains patients treated before some more recent prognostic markers were discovered (eg, DNMT3A), and therefore the multivariate analysis did not contain all known AML prognostic markers.
Network analysis was performed to test for interactions between FLI1 and the other 195 proteins studied on this array. We performed pairwise protein network analysis to identify protein expression patterns by identifying protein pairs that were significantly different between leukemic patients and normal CD34+ cells using a standard t test. We then queried all available public databases, including BIND,38,39 KEGG,40 PubMed, and CCSD, to identify known protein-protein interactions (PPIs) between FLI1 and SMAD4, considering up to nearest neighbor interactions. A map of the PPIs was generated using Cytoscape Version 2.8.1 software.41
Results
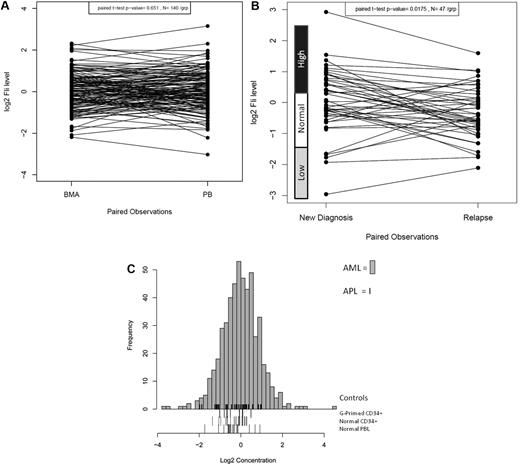
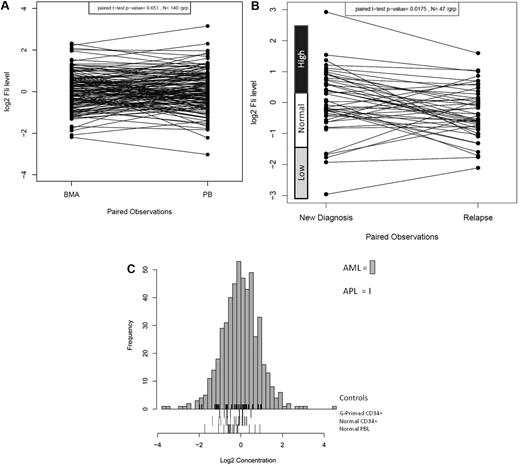
FLI1 protein expression was analyzed in 511 newly diagnosed AML and 21 newly diagnosed APL patients by RPPA. FLI1 expression in 140 same-day paired PB and BM samples was compared and found to be statistically similar (P = .65), demonstrating that the sample source did not affect the protein levels (Figure 1A). However, FLI1 levels were found to be significantly lower at the time of relapse compared with levels at diagnosis in the 47 paired samples (P = .0015; Figure 1B). Most patients maintained the same FLI1 level at diagnosis and relapse (25 of 47), but reversion to normal levels was frequently observed in those initially above normal (12 of 17) or below normal (3 of 5) at diagnosis. Patients with normal FLI1 at diagnosis changed at relapse less frequently, with 5 developing above-normal and 2 developing below-normal FLI1 levels at relapse. Compared with expression in normal CD34+ cells, FLI1 levels were above normal CD34+ cells in 31.8% and below normal in 4.8% of AML patients. Figure 1C shows the expression of FLI1 levels in the 511 newly diagnosed AML patients relative to normal CD34+, G-primed CD34+ cells, and normal PBLs. For validation, FLI1 expression was determined by Western blot and was found to be correlated with FLI1 levels as determined by RPPA for 6 cell lines (R2 = 0.906) and 5 patient samples (R2 = 0.986) that were selected based on their having low, middle, and high levels of FLI1 in RPPA (data not shown).
Distribution of expression of FLI1 in AML. (A) Distribution of expression of FLI1 based on BM versus PB. (B) Distribution of expression of FLI1 based on disease status: the expression between 47 paired diagnosis and relapse specimens is shown. The expression ranges of normal CD34+ cells are shown beside the y-axis. (C) Histogram of expression in all AML patients relative to normal CD34+ cells. FLI1 levels were above normal CD34+ cells in 31.8% of AML patients and below normal in 4.8%. Expression is shown in log 2 scale. The rug immediately above the x-axis shows the APL patients. Three different “normal controls” are shown as rugs below the x-axis, including G-CSF–primed CD34+ cells (top), normal CD34+ cells (middle), and PBLs (bottom).
Distribution of expression of FLI1 in AML. (A) Distribution of expression of FLI1 based on BM versus PB. (B) Distribution of expression of FLI1 based on disease status: the expression between 47 paired diagnosis and relapse specimens is shown. The expression ranges of normal CD34+ cells are shown beside the y-axis. (C) Histogram of expression in all AML patients relative to normal CD34+ cells. FLI1 levels were above normal CD34+ cells in 31.8% of AML patients and below normal in 4.8%. Expression is shown in log 2 scale. The rug immediately above the x-axis shows the APL patients. Three different “normal controls” are shown as rugs below the x-axis, including G-CSF–primed CD34+ cells (top), normal CD34+ cells (middle), and PBLs (bottom).
FLI1 expression and clinical characteristics
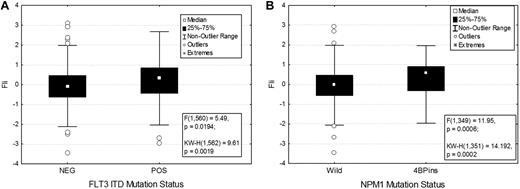
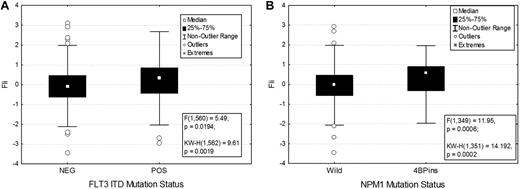
Association between FLI1 levels and various demographic and clinical features are shown in Table 1. There was no significant difference in FLI1 expression on the basis of age, sex, or performance status. FLI1 expression levels were not strongly correlated with French-American-British classification, although levels were higher in monocytic leukemia. FLI1 levels were not associated with individual cytogenetic abnormalities but were associated with some specific molecular mutations. FLI1 levels were found to be significantly higher in patients with an FLT3-ITD (P = .02; Figure 2A) or NPM1 mutation (P = .0007; Figure 2B), but did not vary based on RAS, P53, IDH1, or IDH2 mutation status. Levels were also higher in patients with 11q23 abnormalities (supplemental Figure 2).
FLI1 expression in patients with the FLT3-ITD and NPM1 mutations. FLI1 expression is higher in patients with FLT3-ITD (A) and NPM1 mutation (B). The box shows the 25%-75% range, with the central box showing the median value. The whiskers show the 95% boundaries. Outliers and extremes are shown. Statistics for both the F test and the Kruskal-Wallis test are shown.
FLI1 expression in patients with the FLT3-ITD and NPM1 mutations. FLI1 expression is higher in patients with FLT3-ITD (A) and NPM1 mutation (B). The box shows the 25%-75% range, with the central box showing the median value. The whiskers show the 95% boundaries. Outliers and extremes are shown. Statistics for both the F test and the Kruskal-Wallis test are shown.
Correlation with outcome and survival
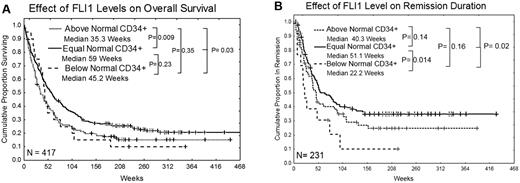
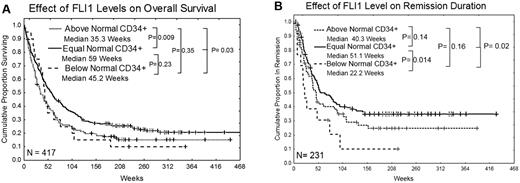
FLI1 levels were not associated with the attainment of CR, although rates were somewhat lower for those with high FLI1. However, the overall survival of patients with high levels of FLI1 was significantly inferior compared with those with normal levels of FLI1 (35 vs 59 weeks; P = .009; Figure 3A). Patients with below-normal levels of FLI1 also had inferior survival compared with those with normal levels of FLI1, but this did not reach statistical significance because of small numbers in this group. Nearly identical results were observed if the dataset is restricted to a homogeneously treated population of patients who received high-dose Ara-C–based regimens (supplemental Figure 2). Patients with low levels of FLI1 had significantly inferior remission duration (22 vs 51 weeks; P = .014) compared with those with normal levels of FLI1 (Figure 3B). The remission duration was also shorter in patients with high FLI1 (40 vs 51 weeks), but this difference was not statistically significant. Similar trends for overall survival and remission duration were seen in patients with only favorable cytogenetics or only unfavorable cytogenetics, although the smaller sample size limited the power of the analysis and these differences were not significant. Among patients with intermediate prognosis cytogenetics, those with high FLI1 still had inferior survival (median 49 vs 78 weeks; P = .05), but there was no significant difference in remission duration. High FLI1 was somewhat adverse for overall survival among patients with FLT3-ITD or D835 mutations (median 33 vs 42 weeks; P = .07) or without mutations (median 61 vs 90 weeks; P = .31). Similarly, FLI1 was somewhat adverse for overall survival among patients with NPM1 mutations (median 35 vs 66 weeks; P = .17) or without NPM1 mutation (median 44 vs 80 weeks; P = .08). Finally, FLI1 was also predictive of overall survival in patients with a RAS mutation (30 vs 78 weeks; P = .011) or with wild-type RAS (median 40.5 vs 59 weeks; P = .07), but small numbers again limited statistical power.
Kaplan Meier curves for overall survival and remission duration. (A) Overall survival. (B) Remission duration in weeks. Median survivals for each group are shown and the log-rank P value for each comparison is listed.
Kaplan Meier curves for overall survival and remission duration. (A) Overall survival. (B) Remission duration in weeks. Median survivals for each group are shown and the log-rank P value for each comparison is listed.
Univariate and multivariate analysis
High FLI1 levels were observed to be an independent predictor of survival in both univariate and multivariate analysis. A Cox proportional hazard model was performed evaluating for factors that were independent predictors of overall survival. Starting with 25 variables that were univariate predictors in the dataset, a stepwise analysis was conducted until only significant (P < .05) variables remained. This was followed by sequential add back of all previously removed variables one by one until a final model with only significant variables remained. The final model contained 5 variables: age, cytogenetics (favorable, intermediate, and unfavorable), FLT3 mutation, creatinine, and sex, as shown in Table 2. In a separate model for overall survival in patients with intermediate cytogenetics, FLI1 level was again a statistically significant independent predictor of outcome, along with age, performance status, creatinine, hemoglobin, FLT3-mutation, and NPM1 mutation status (Table 3).
Correlation with other proteins
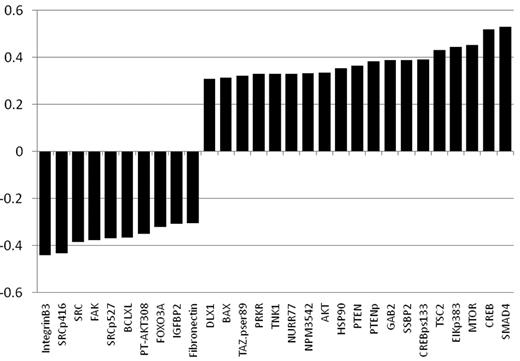
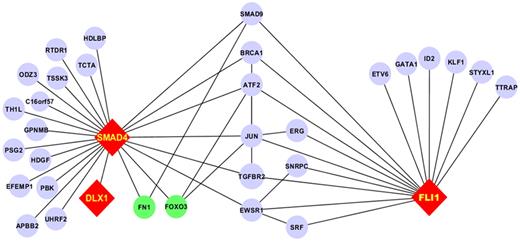
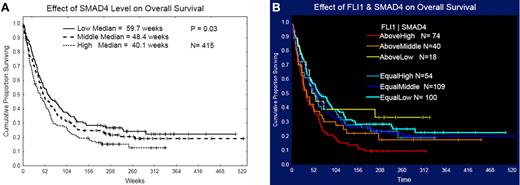
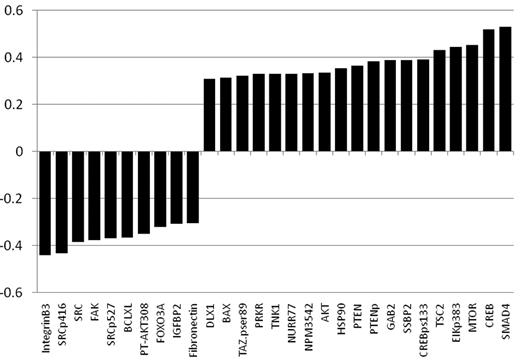
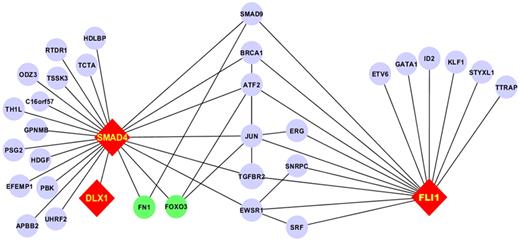
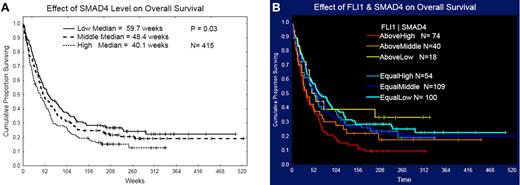
As part of a broader proteomic profiling study of AML, this same RPPA was also probed with antibodies against 195 other epitopes; of these, 29 proteins were found to be strongly correlated (R > 0.3) either positively (n = 19) or negatively (n = 10) with FLI1 levels (Figure 4 and supplemental Table 1). Several proteins that showed high correlation with FLI1 expression are either upstream or downstream of known ETS factors.12,42 The strongest correlation (Table 4) was with SMAD4, the common mediator in a family of SMAD proteins involved in TGFβ signaling. The relative expression of the FLI1-SMAD4 PPI was significantly different from normal CD34+ cells at a P = 1.63 × 10⁻⁷, and this relationship was observed for nearly all cytogenetic subsets of AML (Table 5). We hypothesized that SMAD4 levels might also be prognostic because they were correlated with FLI1, which was prognostic. As shown in Figure 5A, SMAD4 levels were prognostic in this same dataset. We further hypothesized that high levels of both FLI1 and SMAD4 would indicate functional activation of this axis and would be prognostic. When FLI1 levels are equal to normal, there is no correlation with SMAD4 expression levels (Table 4 middle line) and there is no prognostic impact of the possible combinations of FLI1 and SMAD4, as shown by the 3 overlapping blue survival curves in Figure 5B. In contrast, when FLI1 is above normal, there is strong correlation with SMAD 4 (Table 4 top line), with the majority of patients showing strong SMAD4 expression. Prognosis steadily worsens among the patients with above-normal FLI1 as SMAD4 expression increases (compare the yellow to orange to red curves in Figure 5B). A search of the Mimi website (http://mimi.ncibi.org/MimiWeb/interaction-query-page.jsp) revealed no known interactions between FLI1 and DLX, SMAD4, fibronectin, or FOXO3A and no known pathways connecting them. Existing public databases of PPIs were queried using BIND for interactions between FLI1 and SMAD4. As shown in Figure 6, FLI1 has known PPIs with 2 clusters of proteins; the first is unaffiliated with SMAD4, whereas the second has 6 proteins that are 1 or 2 “hops” away from SMAD4. Furthermore, 3 other proteins correlated with FLI1 are known to be regulated either positively (DLX1) or negatively (fibronectin and FOXO3A) by SMAD4.
List of proteins significantly correlated with FLI1 expression. Positive correlations are shown in red and negative correlations in green. All had a R > 0.3 and P < .00001. A list of proteins that were also significantly correlated but below R = 0.3 is presented in supplemental Table 1.
List of proteins significantly correlated with FLI1 expression. Positive correlations are shown in red and negative correlations in green. All had a R > 0.3 and P < .00001. A list of proteins that were also significantly correlated but below R = 0.3 is presented in supplemental Table 1.
PPI network for the FLI1-SMAD4 axis. Fli1 interacts with 2 subsets of proteins: 1 group lacks interaction with SMAD4 and the other has PPI with SMAD4 through 1 or 2 intermediaries. Proteins not studied on the RPPA are in blue, those with positive correlation are in red, and those with negative correlation are in green. Edges between components that did not interact with FLI1 and SMAD4 have been removed for clarity.
PPI network for the FLI1-SMAD4 axis. Fli1 interacts with 2 subsets of proteins: 1 group lacks interaction with SMAD4 and the other has PPI with SMAD4 through 1 or 2 intermediaries. Proteins not studied on the RPPA are in blue, those with positive correlation are in red, and those with negative correlation are in green. Edges between components that did not interact with FLI1 and SMAD4 have been removed for clarity.
Effect of FLI1 and SMAD4 on patient survival. The effect of SMAD 4 level, divided into thirds, on overall survival is shown in panel A. The effect of the combination of FLI1 and SMAD4 level on overall survival is shown in panel B. Cohorts are divided based on whether FLI1 levels were equal to or above normal, and then on whether the SMAD4 level was in the low, middle, or highest third. Patients with below-normal FLI1 were removed for clarity. Survival of those with high FLI1 and high SMAD4 had inferior survival (median 33 weeks) compared with those with normal FLI1 and any level of SMAD4 (median 59 weeks; P = .0035), but equally poor survival as those with high FLi1 and medium SMAD4 (median 35 weeks; P = .52).
Effect of FLI1 and SMAD4 on patient survival. The effect of SMAD 4 level, divided into thirds, on overall survival is shown in panel A. The effect of the combination of FLI1 and SMAD4 level on overall survival is shown in panel B. Cohorts are divided based on whether FLI1 levels were equal to or above normal, and then on whether the SMAD4 level was in the low, middle, or highest third. Patients with below-normal FLI1 were removed for clarity. Survival of those with high FLI1 and high SMAD4 had inferior survival (median 33 weeks) compared with those with normal FLI1 and any level of SMAD4 (median 59 weeks; P = .0035), but equally poor survival as those with high FLi1 and medium SMAD4 (median 35 weeks; P = .52).
FLI1 expression in APL
Our dataset also contained samples from 20 newly diagnosed APL patients, and there was a paired relapse sample for 1 patient. Of these, 17 had t(15:17) by conventional cytogenetics and the other 3 were confirmed by the PML onocgenic domains (POD) test or by PCR. FLI1 levels were high in 5 patients, of whom 4 achieved remission and 2 relapsed (after 40 and 73 weeks CR duration). FLI1 levels were within the normal CD34+ range for the other 15 patients: all achieved CR and 2 relapsed after 58 and 69 weeks. One patient with high FLI1 and 2 with normal FLI1 died. The paired diagnosis relapse sample had high FLI1 at diagnosis, but was lower at relapse, being in the normal range. With the caveat that these numbers are very small, it would appear that FLI1 levels can also be abnormal in APL and might be associated with a higher relapse rate (2 of 4 vs 2 of 15).
Discussion
FLI1 is an important nuclear transcription factor required during erythrocyte development, when it can act to promote cellular proliferation and block differentiation and apoptosis through the genes it regulates. Abnormalities in FLI1 expression would therefore be expected to have functions that could be leukemogenic, and indeed abnormalities in the FLI1 chromosomal locus occur in leukemia. We therefore used RPPA to examine FLI1 protein expression levels and their clinical implications in AML patients. Our results show that the FLI1 expression pattern was heterogeneous in AML, and levels were above those found in normal CD34+ cells in 1/3 of AML patients at diagnosis. The range of expression in normal CD34+ cells was very narrow, suggesting that the boundaries for defining above or below normal would be unlikely to change significantly if a larger number of normal CD34+ samples were studied. No difference was observed in expression levels between PB and BM. However, levels in paired samples were lower at relapse compared with at diagnosis. FLI1 expression was not correlated with French-American-British classification or cytogenetics, but higher levels were associated with FLT3-ITD and NPM1 mutations.
Results from our study show that patients with high FLI1 have a lower CR rate and shorter CR duration, resulting in a significantly shorter overall survival. Similarly, although patients with lower than normal levels of FLI1 had a higher CR rate, they also had significantly shorter CR durations that resulted in an inferior overall survival. For those with low FLI1, this did not reach statistical significance. This is likely because of the crossover that occurs between the 2 curves because of the better early survival associated with the higher CR rate and the lower number of patients in this category reducing statistical power, because the survival curve was very similar to that of patients with high FLI1 after 45 weeks. Multivariate analysis clearly illustrates high FLI1 as an independent predictor of disease outcome. The adverse effect of high and low FLI1 on outcome therefore appears to arise through different means. Those with high FLI1 had lower remission rates and shorter remission durations, resulting in shorter overall survival, whereas those with low FLI1 had a higher rate of remission attainment but significantly shorter remission duration, resulting in inferior survival. Higher FLI1 levels may promote early resistance via it is antiapoptotic effects and more rapid regrowth, leading to either primary resistance or later relapse through its pro-proliferative effects. In contrast, low FLI1 may result in decreased proliferation with higher percentages of cells being in a resting or G0 state and therefore less susceptible to cycle-specific agents such as cytosine arabinoside, resulting in more rapid regrowth after remission attainment. Similar effects were previously observed with high Waf1 expression, which also decreases proliferation.43
FLI1 acts at the top of the transcriptional network in regulating blood and endothelial development,44 and many potential targets have been identified from mRNA studies. However, confirmation that FLI1 protein levels are correlated with protein levels of these targets has not been shown previously. In the present study, 29 of the other 193 analyzed protein epitopes showed high correlation with FLI1 levels, with an R > 0.3 and P < .00001, and another 22 (16 high and 6 low) with an R > 0.25, suggesting an association between these proteins and FLI1. Several proteins that showed high correlation with FLI1 expression are either upstream or downstream of known ETS factors. We observed very high correlations between FLI1 and SMAD4, CREB (total and phospho-serine 133), GAB2, and AKT, which either interact with or are upstream of ETS factors. FAK and CREB are interactive partners with ETA factors and CREB has been shown to negatively regulate DNA binding by acetylation of FLI1 in fibroblasts.45 Functional ETS-binding sites have been shown to regulate transcription of BCLXL,46 BAX,47 integrin B3,48 fibronectin,49 FAK,50 and TSC2.42,51 Except for BCLXL, these were all markedly positively (TSC2 and BAX) or negatively (integrinβ3, fibronectin, and FAK) correlated with FLI1 expression in this study.
We demonstrate a previously unrecognized connection between FLI1 and SMAD4 and suggest that there is functional activation of the FLI1-SMAD4 axis in AML. Querying of known PPI databases demonstrated that there was no known direct connection or pathways linking FLI1 and SMAD4. However, it was possible to link FLI1 to JUN and JUN to SMAD4 and thereby establish connections between FLI1 and SMAD4 with 1 or 2 intermediaries. Furthermore, 3 other proteins shown to be correlated with FLI1 were found to be regulated by SMAD4. The observation that adverse prognosis is restricted to the population with high levels of both FLI1 and SMAD4 provides further evidence that activation of this axis occurs in AML and that use of this pathway is relevant to resistance to therapy. Additional experiments are required to verify the existence of this FLI1-SMAD4 axis functionality to confirm its activation in AML and its role in resistance. If validated, this would suggest that FLI1 directs the expression of this axis in AML. Therefore, therapeutic targeting of FLI1 in AML might have a broad impact on many pathways affecting AML cell biology.
Several other proteins that are known to be downstream or upstream of FLI1 showed correlation at the protein level. FLI1 is known to activate or inactivate genes involved in cell proliferation and differentiation, such as MDM2,30 BCL2,27 GATA-1,28 and RB.29 Results from our study also show a positive correlation between FLI1, BCL-2, and RB and a negative correlation with MDM2. We did not find any correlation between GATA1 and FLI1 protein expression. The FLI1 promoter includes several conserved binding sites for various transcription factors involved in its regulation such as GATA1, ETS, SP1, MYC, OCT-3, TBP, and AP1.5 We observed a limited positive correlation between MYC and FLI1 expression (data not shown), but the others were not among the epitopes studied. We also observed a limited positive correlation between FLI1 levels and protein kinase C δ, which has been shown to directly phosphorylate FLI1 in response to TGFβ.45 Our results also showed a positive correlation between FLI1 and the STAT3 protein, which is known to regulate the FLI1 promoter.52 Levels of cyclinD3 and FLI1 were also positively correlated in this dataset, which is consistent with data showing that FLI1 maintains high levels of cyclin D3 and cyclin D2 in erythroblasts, thereby promoting proliferation over differentiation.53
In summary, this study demonstrates that FLI1 expression is abnormally high in 1/3 of AML patients, and that its overexpression is an adverse prognostic factor. FLI1 protein expression is correlated with many expected targets of FLI1, suggesting that FLI1 plays an active role in defining AML cell biology. This identifies FLI1 and/or its response genes as new targets for therapeutic intervention in AML.
The online version of this article contains a data supplement.
The publication costs of this article were defrayed in part by page charge payment. Therefore, and solely to indicate this fact, this article is hereby marked “advertisement” in accordance with 18 USC section 1734.
Acknowledgments
This work was supported in part by a translational research grant from the Leukemia & Lymphoma Society (to S.M.K.) and a National Institutes of Health grant PO1CA78582 (to D.K.W.).
National Institutes of Health
Authorship
Contribution: S.M.K. designed the study, analyzed the data, and wrote the manuscript; Y.H.Q. performed the Ab validation and RPPA experiments and participated in the data analysis and manuscript preparation; N.Z. performed the statistical analysis and helped write the manuscript; N.S. assisted with the RPPA and helped write the manuscript; S.F. and A.F. provided clinical care of the patients and helped write the manuscript; H.Y. and A.A.Q. performed the systems biology analysis and helped write the manuscript; K.R.C. performed the statistical analysis and helped write the manuscript; and D.K.W. developed the Ab, helped to develop the project, assisted with the data analysis, and helped write the manuscript.
Conflict-of-interest disclosure: The authors declare no competing financial interests.
Correspondence: Dr Steven M. Kornblau, Department of Leukemia, Section of Molecular Hematology and Therapy, Unit 448, The University of Texas M. D. Anderson Cancer Center, 1515 Holcombe Blvd, Houston, TX 77030-4095; e-mail: skornblau@mdanderson.org.

