Abstract
Recent studies demonstrate a pivotal role for bone morphogenic protein-6 (BMP6) and matriptase-2, a protein encoded by the TMPRSS6 gene, in the induction and suppression of hepatic hepcidin expression, respectively. We examined their expression profiles in the liver and showed a predominant localization of BMP6 mRNA in nonparenchymal cells and exclusive expression of TMPRSS6 mRNA in hepatocytes. In rats fed an iron-deficient (ID) diet for 24 hours, the rapid decrease of transferrin saturation from 71% to 24% (control vs ID diet) was associated with a 100-fold decrease in hepcidin mRNA compared with the corresponding controls. These results indicated a close correlation of low transferrin saturation with decreased hepcidin mRNA. The lower phosphorylated Smad1/5/8 detected in the ID rat livers suggests that the suppressed hepcidin expression results from the inhibition of BMP signaling. Quantitative real-time reverse transcription polymerase chain reaction analysis revealed no significant change in either BMP6 or TMPRSS6 mRNA in the liver. However, an increase in matriptase-2 protein in the liver from ID rats was detected, suggesting that suppression of hepcidin expression in response to acute iron deprivation is mediated by an increase in matriptase-2 protein levels.
Introduction
Hepcidin is the key iron regulatory peptide hormone in the maintenance of iron homeostasis. It is secreted predominantly by hepatocytes.1,2 Under physiologic conditions, its expression is regulated positively by body iron content through the bone morphogenic protein (BMP)–mediated signaling cascade.3-5 In recent studies researchers have identified several proteins that can modulate BMP signaling and hepcidin expression directly or indirectly.
BMP2, 4, 5, 6, 7, and 9 are cytokines of the BMP subfamily that belong to the transforming growth factor-β (TGF-β) superfamily.6 Each of these BMP ligands induces BMP signaling through receptor-activated Smad1, Smad5, and Smad8 (Smad1/5/8) and markedly increases hepcidin expression in hepatocytes.7,8 BMP2, 4, 5, and 6 can also bind hemojuvelin (HJV), a BMP coreceptor, to enhance BMP signaling, resulting in an increase in hepcidin expression.4,7 HJV is a glycosylphosphatidyl-inositol–linked membrane protein that is expressed in skeletal muscle, heart, and hepatocytes, and it plays a pivotal role in the induction of hepcidin expression.9-11 Both homozygous or compound heterozygous mutations in the HJV gene, HFE2, in humans and disruption of both Hfe2 alleles in mice result in suppression of hepcidin expression and severe iron overload in the liver, pancreas, and heart.10,12,13 In addition to BMPs, TGF-β1 can also induce hepatic hepcidin expression.5 BMP6 mRNA, but no other BMP mRNA, is down-regulated by chronic iron depletion and up-regulated by iron loading.3 Knockdown of the BMP6 gene in mice causes suppression of hepatic hepcidin expression.3,14,15 These observations implicate BMP6 as a critical player in the iron-sensitive induction of hepcidin expression in vivo.
Matriptase-2 and the soluble form of HJV (sHJV) are negative regulators of hepatic hepcidin expression.16-19 Matriptase-2, encoded by the gene TMPRSS6, is a serine protease type II transmembrane protein expressed mainly in the liver.20 Its role in iron homeostasis is supported by studies in which authors show that either a lack of matriptase-2 catalytic domain in mask mice or disruption of both Tmprss6 alleles in mice results in increased hepatic hepcidin expression, as well as microcytic anemia.16,21,22 Importantly, in clinical studies researchers have linked homozygous or compound heterozygous mutations in TMPRSS6 to iron-refractory anemia.23,24 Further studies suggest that matriptase-2 inhibits hepcidin expression by proteolysis of HJV, thereby decreasing membrane HJV in hepatocytes.17 In addition to matriptase-2, HJV can also be cleaved by the proprotein convertase, furin, and be released as a soluble form.25,26 sHJV is detectable in serum and increases during acute iron deprivation in rats.18,27 sHJV suppresses the induction of hepcidin expression by BMP6 both in vitro and in vivo.15 However, the underlying mechanism by which BMP6 and matriptase-2 are coordinated in the regulation of hepatic hepcidin expression still remains to be determined.
In this study, we characterized the regulation of hepcidin expression in response to acute iron deprivation. We showed a predominant localization of BMP6 mRNA in liver nonparenchymal cells, which is in contrast with the exclusive expression of TMPRSS6 mRNA in hepatocytes. In rats, acute iron deprivation led to the rapid suppression of hepcidin expression, which was associated with a decrease in serum transferrin (Tf) saturation as well as an increase in matriptase-2 protein levels, whereas BMP6 mRNA levels remained unchanged.
Methods
Quantitative real-time RT-PCR
Quantitative real-time reverse transcription–polymerase chain reaction (qRT-PCR) was used to analyze the mRNA levels of BMP2, BMP4, BMP5, BMP6, BMP9, TMPRSS6, TfR1, hepatocyte growth factor activator inhibitor type 1 (HAI-1), hepatocyte growth factor activator inhibitor type 2 (HAI-2), glyceraldehyde 3-phosphate dehydrogenase (GAPDH), and β-actin in isolated rat liver hepatocytes, Kupffer cells (KCs), sinusoidal endothelial cells (SECs), and hepatic stellate cells (HSCs) as well as in whole liver from rats fed either a control or iron-deficient (ID) diet.27,28 The procedures for isolation of rat liver cells, total RNA isolation, and cDNA preparation were described previously28 and in supplemental Methods, available on the Blood Web site; see the Supplemental Materials link at the top of the online article. qRT-PCR analysis was performed by the use of rat-specific primers listed in Table 1. The results for each gene of interest are expressed as the amount of mRNA relative either to GAPDH for isolated liver cells, or to β-actin for whole rat liver, in each sample. Different rat liver cell populations have similar levels of GAPDH mRNA.28 Iron deficiency in rats increases GAPDH mRNA levels in the liver.29
In situ hybridization
In situ hybridization analyses of Tmprss6 and BMP6 mRNA in mouse liver tissues were performed as previously described.28
Generation of rats with acute iron deprivation and acute iron loading
Weanling male Sprague-Dawley rats were purchased from Harlan Sprague Dawley. The procedures for generation of rats with acute iron deprivation and acute iron loading were described previously27 and in supplemental Methods. All procedures for animal use met the requirements of the University of Wisconsin Research Animal Resource Center.
TMPRSS6 cDNA cloning and transfection
The coding sequences of both human and rat TMPRSS6 cDNA were amplified by PCR with the primers listed in Table 2. The generation of various TMPRSS6 cDNA constructs and the transfection procedures are described in supplemental Methods.
Immunodetection
Immunodetection of TfR1, phosphorylated Smad1/5/8 (pSmad), total Smad1/5/8 (Smad), β-actin, matriptase-2, HJV, HAI-1, and HAI-2 in rat liver and gastrocnemius muscle was performed as previously described.27,30 The generation of rabbit anti–matriptase-2 antibody was described in supplemental Methods. Liver tissues from Tmprss6−/− mice22 and sex- and age-matched wild-type counterparts were kindly provided by Dr Thomas Bartnikas and Dr Mark Fleming at Harvard University.
Results
BMP6 mRNA is expressed mainly in liver nonparenchymal cells whereas TMPRSS6 mRNA is predominantly localized in hepatocytes
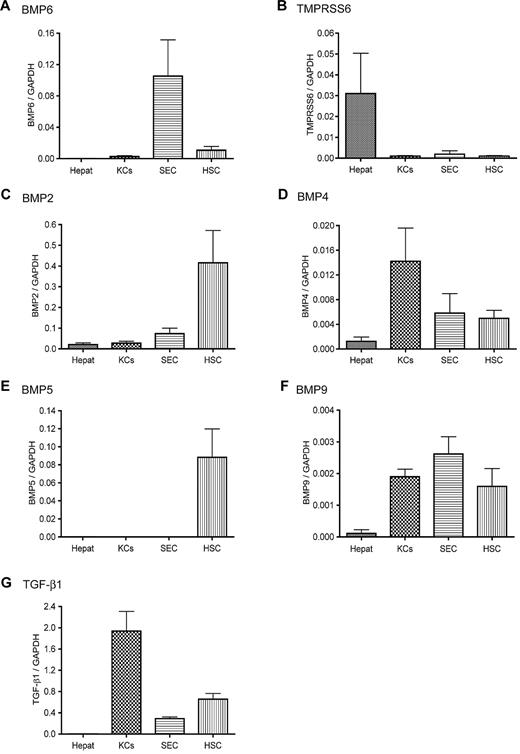
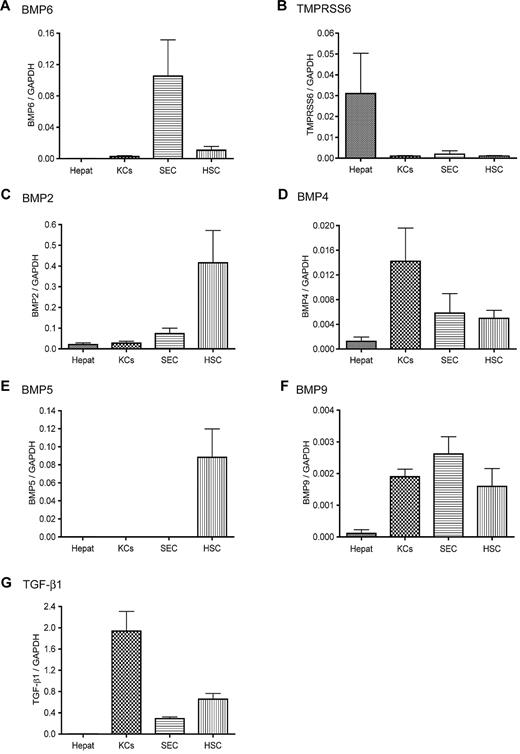
We wanted to explore the underlying mechanism for the rapid suppression of hepatic hepcidin expression in response to acute iron deprivation. Recent studies demonstrate that hepcidin expression is mediated through BMP signaling and that both BMP6 and matriptase-2 play important roles in the regulation of BMP signaling and hepcidin expression.3-5,14,15 The expression profiles of BMP6 and TMPRSS6 mRNA were examined in isolated rat liver cells by qRT-PCR. Hepcidin mRNA was detected only in hepatocytes. The degree of contamination of hepatocytes in other cell populations was evaluated by qRT-PCR with hepcidin, Tf receptor 2, HJV, and Tf as hepatocyte-specific indices. Results showed less than 1% contamination of hepatocytes in nonparenchymal cells (data not shown). Greater levels of BMP6 mRNA were detected in the nonparenchymal cells than in hepatocytes (Figure 1A). Among the nonparenchymal cell populations, SECs displayed the greatest BMP6 mRNA level, followed by HSCs and KCs. In contrast, TMPRSS6 mRNA was primarily detected in hepatocytes (Figure 1B). These results suggest that the expression of BMP6 and TMPRSS6 does not overlap substantially in the liver.
Expression profiles of hepcidin stimuli and suppressors in isolated rat liver cells. The mRNA levels of BMP6 (A), TMPRSS6 (B), BMP2 (C), BMP4 (D), BMP5 (E), BMP9 (F), and TGF-β1 (G) in isolated rat liver hepatocytes (Hepat, n = 5), KCs (n = 7), SECs (n = 4), and HSCs (n = 6) were analyzed by qRT-PCR. The sequences of the primers used for the analysis are listed in Table 1. Results are expressed as the amounts relative to GAPDH. We previously showed that different rat liver cell populations have similar levels of GAPDH mRNA.28 The mean values and the SD for each cell population are presented.
Expression profiles of hepcidin stimuli and suppressors in isolated rat liver cells. The mRNA levels of BMP6 (A), TMPRSS6 (B), BMP2 (C), BMP4 (D), BMP5 (E), BMP9 (F), and TGF-β1 (G) in isolated rat liver hepatocytes (Hepat, n = 5), KCs (n = 7), SECs (n = 4), and HSCs (n = 6) were analyzed by qRT-PCR. The sequences of the primers used for the analysis are listed in Table 1. Results are expressed as the amounts relative to GAPDH. We previously showed that different rat liver cell populations have similar levels of GAPDH mRNA.28 The mean values and the SD for each cell population are presented.
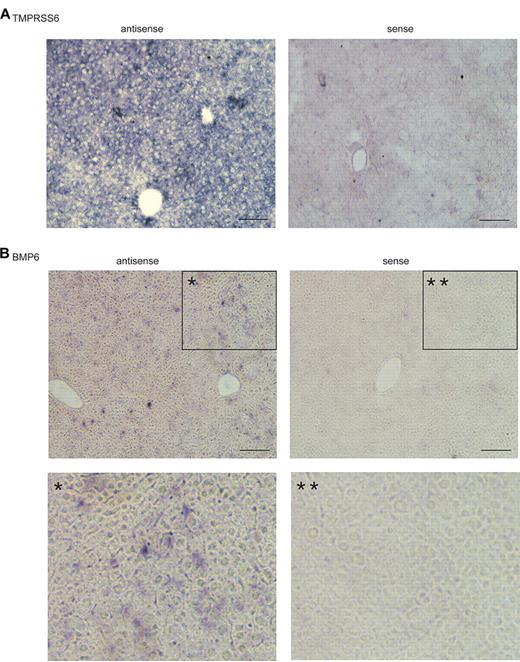
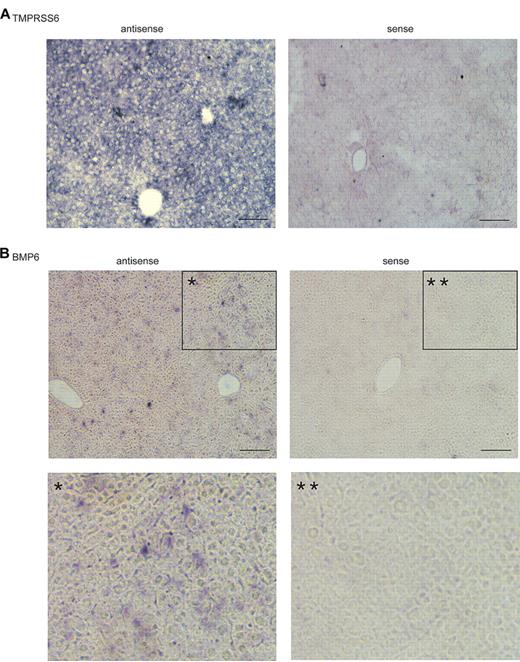
We also examined the profiles of BMP2, BMP4, BMP5, BMP9, and TGF-β1 mRNA. All of these cytokines are expressed in the liver and can induce hepcidin expression.4,5,31 Like BMP6, these cytokines were also primarily expressed in nonparenchymal cells with the lowest level in hepatocytes (Figure 1C-G). To verify the observations in isolated liver cells, we conducted in situ hybridization analysis for BMP6 and TMPRSS6 mRNA in mouse liver tissues. Sense probes were used as negative controls, whereas antisense probes were used to detect the localization of the mRNA of interest. A homogenous distribution of Tmprss6 mRNA was observed in hepatocytes with no evidence of a zonal distribution (Figure 2A). In contrast, BMP6 mRNA was observed mainly in the nonparenchymal cells (Figure 2B). Thus, the in situ hybridization results are consistent with the results observed in the isolated liver cells. Taken together, these results indicate that the stimuli for the induction of hepcidin expression in hepatocytes are predominantly detected in the nonparenchymal cells in the liver, whereas TMPRSS6, the suppressor of hepcidin expression,16,21 is mainly expressed in hepatocytes.
In situ hybridization analysis of Tmprss6 and BMP6 mRNA in mouse liver tissue. 10μM thick liver tissue sections from a 10-week-old 129/SvEvTac mouse were probed with digoxigenin-labeled antisense riboprobes specific for mouse Tmprss6 (A) or mouse BMP6 (B), respectively. Sense probes were used as negative controls. In panel B, images at the bottom (* and **) are the enlargement of the boxed portions (* and **) in the corresponding top panels. Digoxigenin-labeled antisense and sense riboprobes for mouse BMP6 and Tmprss6 were synthesized by in vitro transcription by the use of either MEGAscript SP6 kit or MEGAscript T7 kit (Ambion). The fragments of mouse BMP6 and Tmprss6 cDNA used for riboprobe synthesis were amplified from a mouse liver cDNA preparation by PCR by use of the Expand High-Fidelity PCR system (Roche Applied Science), followed by cloning into pGEM-T vector (Promega). The primers used for amplifications are listed in Table 2. The amplicons were confirmed by DNA sequencing. Images were taken under × 100 original magnification. In situ hybridization analyses for both Tmprss6 and BMP6 mRNA were performed at least 3 times with 2 different sets of probe preparations and showed consistent results. Scale bar, 50 μm.
In situ hybridization analysis of Tmprss6 and BMP6 mRNA in mouse liver tissue. 10μM thick liver tissue sections from a 10-week-old 129/SvEvTac mouse were probed with digoxigenin-labeled antisense riboprobes specific for mouse Tmprss6 (A) or mouse BMP6 (B), respectively. Sense probes were used as negative controls. In panel B, images at the bottom (* and **) are the enlargement of the boxed portions (* and **) in the corresponding top panels. Digoxigenin-labeled antisense and sense riboprobes for mouse BMP6 and Tmprss6 were synthesized by in vitro transcription by the use of either MEGAscript SP6 kit or MEGAscript T7 kit (Ambion). The fragments of mouse BMP6 and Tmprss6 cDNA used for riboprobe synthesis were amplified from a mouse liver cDNA preparation by PCR by use of the Expand High-Fidelity PCR system (Roche Applied Science), followed by cloning into pGEM-T vector (Promega). The primers used for amplifications are listed in Table 2. The amplicons were confirmed by DNA sequencing. Images were taken under × 100 original magnification. In situ hybridization analyses for both Tmprss6 and BMP6 mRNA were performed at least 3 times with 2 different sets of probe preparations and showed consistent results. Scale bar, 50 μm.
Rapid suppression of hepatic hepcidin mRNA in response to acute iron deprivation is closely associated with the decrease of serum Tf saturation
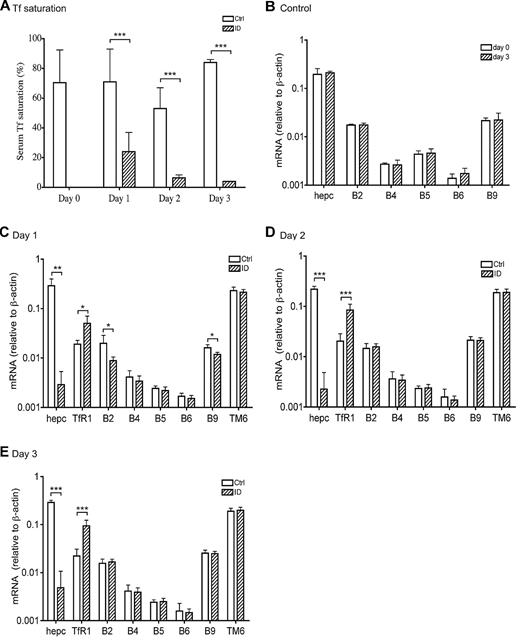
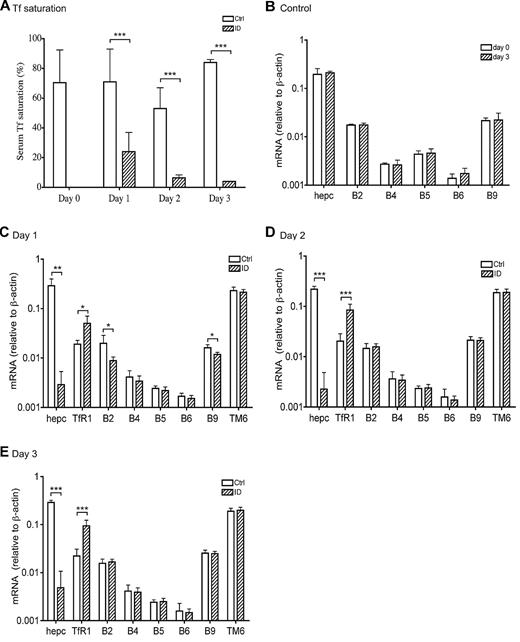
Weanling rats were made iroin-deficient (ID) to test whether BMP signaling is involved in the response to acute iron deficiency by feeding them an ID diet for 1, 2, or 3 days.27 Weanling rats were used because they have low body iron stores and are rapidly growing and therefore are acutely sensitive to dietary ID. The levels of Tf saturation in all control groups are comparable with that in day 0 group (70.4% ± 9.8%), which demonstrate that the rats were iron replete at the initiation of the dietary experiments (Figure 3A). A rapid decrease in Tf saturation was detected in animals fed an ID diet for 1 day (71% in control group vs 24% in ID group). A further decrease was detected in animals fed an ID diet for 2 days (53% in control group vs 6% in ID group) and for 3 days (84% in control group vs 4% in ID group; Figure 3A). Liver nonheme iron levels did not change significantly in all 3 groups in comparison with the corresponding controls, and the animals were not anemic during this period of time.27
Suppression of hepcidin mRNA in response to acute iron deprivation does not result from the transcriptional regulation of BMP6 and TMPRSS6 gene expression. (A) Serum Tf saturation in rats at day 0 and in rats fed either a control diet (white bar) or an ID diet (striped bar) for 1, 2, and 3 days. (B) qRT-PCR analysis of hepcidin (hepc), BMP2 (B2), BMP4 (B4), BMP5 (B5), BMP6 (B6), and BMP9 (B9) mRNA in the liver tissues from animals fed a control diet at day 0 (white bar) and 3 days (striped bar). (C-E) qRT-PCR analysis of hepcidin (hepc), TfR1, BMP2 (B2), BMP4 (B4), BMP5 (B5), BMP6 (B6), BMP9 (B9), and TMPRSS6 (TM6) mRNA in the liver tissues from rats fed either a control diet (□) or an ID diet (▨) for 1 day (C), 2 days (D), and 3 days (E). Results are expressed as the amounts relative to β-actin rather than GAPDH. Previous studies indicate that iron deficiency in rats increases GAPDH mRNA levels in the liver.29 There are 5 animals per group for 0 day, 1 day, and 2 days, and 4 animals per group for 3 days. Tissues used in panel B were collected from a separate experiment. The mean values and the SD for each group are presented. The paired 2-tailed Student t test was used to evaluate the statistical significance for serum Tf saturation between the ID and corresponding control groups (A), as well as for the qRT-PCR results between day 0 and 3 day control groups (B) or between the ID and the corresponding control groups (C-E) for each gene of interest. * P < .05; **P < .01; ***P < .001.
Suppression of hepcidin mRNA in response to acute iron deprivation does not result from the transcriptional regulation of BMP6 and TMPRSS6 gene expression. (A) Serum Tf saturation in rats at day 0 and in rats fed either a control diet (white bar) or an ID diet (striped bar) for 1, 2, and 3 days. (B) qRT-PCR analysis of hepcidin (hepc), BMP2 (B2), BMP4 (B4), BMP5 (B5), BMP6 (B6), and BMP9 (B9) mRNA in the liver tissues from animals fed a control diet at day 0 (white bar) and 3 days (striped bar). (C-E) qRT-PCR analysis of hepcidin (hepc), TfR1, BMP2 (B2), BMP4 (B4), BMP5 (B5), BMP6 (B6), BMP9 (B9), and TMPRSS6 (TM6) mRNA in the liver tissues from rats fed either a control diet (□) or an ID diet (▨) for 1 day (C), 2 days (D), and 3 days (E). Results are expressed as the amounts relative to β-actin rather than GAPDH. Previous studies indicate that iron deficiency in rats increases GAPDH mRNA levels in the liver.29 There are 5 animals per group for 0 day, 1 day, and 2 days, and 4 animals per group for 3 days. Tissues used in panel B were collected from a separate experiment. The mean values and the SD for each group are presented. The paired 2-tailed Student t test was used to evaluate the statistical significance for serum Tf saturation between the ID and corresponding control groups (A), as well as for the qRT-PCR results between day 0 and 3 day control groups (B) or between the ID and the corresponding control groups (C-E) for each gene of interest. * P < .05; **P < .01; ***P < .001.
We first examined the response of hepcidin expression to acute iron deprivation. Although the levels of hepcidin mRNA between control groups on day 0 versus day 3 were similar (Figure 3B), ∼100-fold decrease was detected in all the ID groups compared with the corresponding controls (Figure 3C-E; P < .01 for day 1 and P < .001 for day 2 and 3). These results indicate a close association between the rapid suppression of hepcidin expression and the decrease in Tf saturation. In addition, these data also suggest the existence of a mechanism by which the liver senses a decrease in Tf saturation and rapidly suppresses hepcidin expression. Interestingly, we did not detect any further decrease in hepcidin mRNA in animals fed an ID diet for 2 or 3 days (Figure 3D-E) despite lower Tf saturations.27 Altogether, these data suggest that weanling rats have a low Tf saturation threshold to maintain iron homeostasis. Once Tf saturation decreases below this threshold, hepcidin expression would be suppressed to increase the iron absorption from intestine as well as the mobilization of stored iron in the liver. On the basis of the results obtained in this study, we estimate that this low Tf saturation threshold would be greater than 24% (ID group for 1 day) but lower than 53% (control group for 2 days).
Acute iron deprivation suppresses hepcidin expression by decreasing BMP/SMAD signaling
Recent studies show that the induction of hepcidin expression in response to chronic iron loading or the suppression of hepcidin expression in response to chronic iron deprivation in mice is mediated through BMP signaling.3 We wanted to test whether the rapid suppression of hepcidin expression in response to acute iron deprivation is regulated via the same pathway. BMP signaling is initiated upon the binding of BMP ligands to BMP receptor complexes on the cell surface, which subsequently triggers the phosphorylation of Smad1/5/8 in the cytoplasm. The phosphorylated Smads (pSmad) form heteromeric complexes with Smad4 and then translocate into the nucleus to induce the transcription of target genes.5,6 We used the level of pSmad, normalized to that of total Smad1/5/8 (Smad), as a direct indicator of BMP signaling to examine the change of pSmad in the rat liver extracts by Western blot. Actin was used as a loading control.
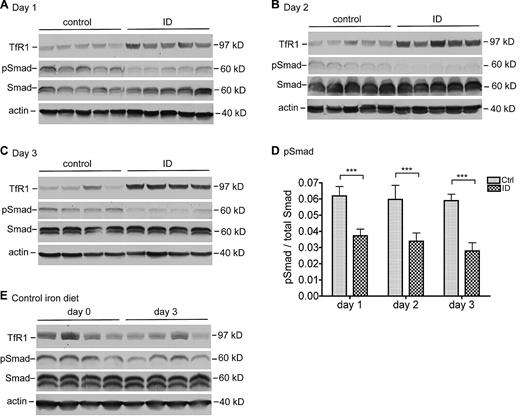
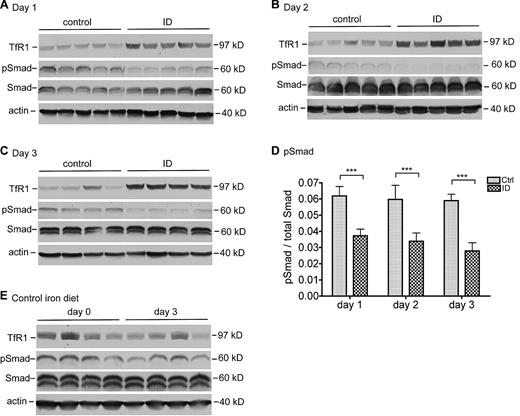
A significant decrease in pSmad was detected in rats fed an ID diet for 1 day in comparison with the corresponding control rats (Figure 4A). These results show a close association of the pSmad levels with the levels of hepcidin mRNA. A further examination of pSmad in animals fed an ID diet for 2 and 3 days revealed a similar profile (Figure 4B-C). Quantitative immunoblot analysis showed that the decrease was statistically significant in all 3 iron-deficient groups (Figure 4D). There was no significant change in control animals (Figure 4E). In conjunction with the findings showing that BMP signaling plays an essential role in the induction of hepcidin expression,4,5 these observations suggest that the suppression of hepcidin expression in response to acute iron deprivation results at least in part from the inhibition of BMP signaling.
Suppression of hepcidin expression by acute iron deprivation is mediated through decreasing the BMP/SMAD signaling. Rat liver extracts were prepared with the use of NET-Triton supplemented with 1× protease inhibitor cocktail, 1mM sodium fluoride, and 1mM sodium orthovanadate. Extract proteins (250 μg) from the animals at 1 day (A), 2 days (B), and 3 days (C) were separated by the use of 11% sodium dodecyl sulfate polyacrylamide gel electrophoresis (SDS-PAGE) under reducing conditions, followed by transfer onto nitrocellulose membrane. Membranes were probed with mouse anti-TfR1, rabbit anti-phosphorylated Smad1/5/8 (pSmad), rabbit anti-Smad1/5/8 (Smad), and mouse anti–β-actin (actin), followed by immunodetection with corresponding horseradish peroxidase (HRP)–conjugated secondary antibodies. The chemiluminescent bands were exposed to X-ray film. (D) Quantitative immunoblot analysis of pSmad in the liver. The analysis was performed essentially in the same manner as described previously except that fluorescently labeled goat anti–rabbit secondary antibody was used. The intensity of each band was recorded as arbitrary units. The amounts of pSmad are expressed relative to total Smad in each sample. The mean values and the SD for each group are presented. The 2-tailed Student t test was used to evaluate the statistical significance of the results between rats fed a control (Ctrl) or an iron-deficient (ID) diet. ***P < .001. (E) Western blot analysis of TfR1, pSmad, Smad, and β-actin in rat liver tissues extracts at day 0 and day 3 fed a control diet. Tissues used for these analyses were collected from a separate experiment. All the Western blot analyses were repeated twice and showed consistent results.
Suppression of hepcidin expression by acute iron deprivation is mediated through decreasing the BMP/SMAD signaling. Rat liver extracts were prepared with the use of NET-Triton supplemented with 1× protease inhibitor cocktail, 1mM sodium fluoride, and 1mM sodium orthovanadate. Extract proteins (250 μg) from the animals at 1 day (A), 2 days (B), and 3 days (C) were separated by the use of 11% sodium dodecyl sulfate polyacrylamide gel electrophoresis (SDS-PAGE) under reducing conditions, followed by transfer onto nitrocellulose membrane. Membranes were probed with mouse anti-TfR1, rabbit anti-phosphorylated Smad1/5/8 (pSmad), rabbit anti-Smad1/5/8 (Smad), and mouse anti–β-actin (actin), followed by immunodetection with corresponding horseradish peroxidase (HRP)–conjugated secondary antibodies. The chemiluminescent bands were exposed to X-ray film. (D) Quantitative immunoblot analysis of pSmad in the liver. The analysis was performed essentially in the same manner as described previously except that fluorescently labeled goat anti–rabbit secondary antibody was used. The intensity of each band was recorded as arbitrary units. The amounts of pSmad are expressed relative to total Smad in each sample. The mean values and the SD for each group are presented. The 2-tailed Student t test was used to evaluate the statistical significance of the results between rats fed a control (Ctrl) or an iron-deficient (ID) diet. ***P < .001. (E) Western blot analysis of TfR1, pSmad, Smad, and β-actin in rat liver tissues extracts at day 0 and day 3 fed a control diet. Tissues used for these analyses were collected from a separate experiment. All the Western blot analyses were repeated twice and showed consistent results.
We also detected the levels of TfR1 protein as an indicator for the labile iron pools within the liver. TfR1 expression is regulated posttranscriptionally by iron-regulatory proteins. When cytosolic iron pool is low, iron regulatory proteins bind to and stabilize TfR1 mRNA, resulting in increased TfR1 levels and increased cellular uptake of iron from Tf.32 The mild elevation of TfR1 in the ID group at day 1 suggests that there is a decrease in labile iron pool in the liver cells (Figure 4A). The gradual increase in TfR1 levels in the ID groups at day 2 (Figure 4B) and day 3 (Figure 4C) indicate a further decrease.
Suppression of hepcidin mRNA in response to acute iron deprivation does not result from the regulation of BMP6 and TMPRSS6 mRNA expression
Recent studies demonstrate a pivotal role for BMP6 in the induction of hepcidin expression, and matriptase-2 in the suppression of hepcidin expression.3,16,21 BMP6 mRNA levels are positively regulated by chronic iron loading and negatively regulated by chronic iron deprivation in mice.3 Changes in TMPRSS6 mRNA expression have not been reported in iron deprivation. The rapid suppression of hepcidin expression in the ID animals could result from either the suppression of BMP6 mRNA or the increase of TMPRSS6 mRNA or both. No significant change in either BMP6 or TMPRSS6 mRNA was detected in the liver from all 3 ID groups in comparison with their corresponding controls (Figure 3C-E). As a positive control, TfR1 mRNA was significantly elevated in all the ID groups (Figure 3C-E), which is consistent with the increased TfR1 protein in these animals (Figure 4A-C). These results suggest that the rapid suppression of hepcidin expression in response to acute iron deprivation in weanling rats does not result from the altered BMP6 and TMPRSS6 mRNA levels.
Because BMP2, BMP4, BMP5, BMP9, and TGF-β1 mRNA were also detected in the liver,7,31 we next examined their mRNA levels by qRT-PCR. We detected small decreases in BMP2 and BMP9 mRNA in the ID group at day 1 (Figure 3C) but not later (Figure 3D-E). Because at days 2 and 3 the levels of BMP2 and BMP9 mRNA in control and ID groups are similar and BMP9 does not bind to HJV,7,33 the changes are not likely to be physiologically significant.
Acute iron deprivation increases matriptase-2 protein levels in the liver
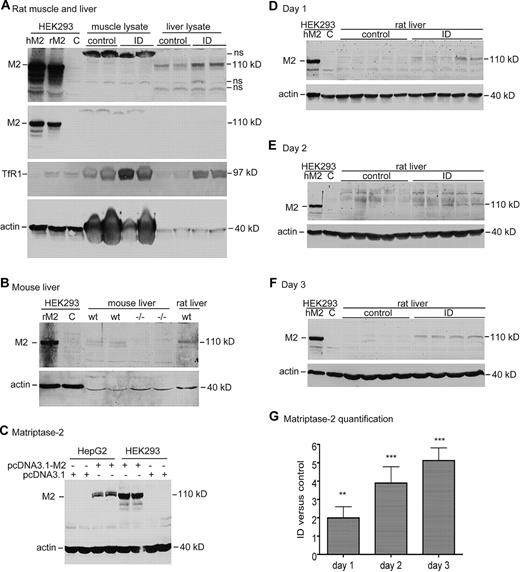
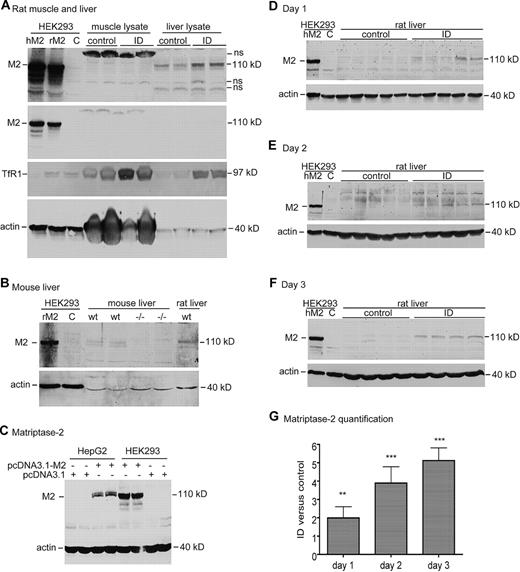
A decrease in hepcidin expression could be attributable to an increase in matriptase-2. Matriptase-2 is a suppressor of hepcidin expression,16,21,22 presumably through down-regulation of membrane-bound HJV in hepatocytes.17,22 TMPRSS6 mRNA is highly expressed in the liver,20,34,35 particularly in hepatocytes (Figures 1B,2A). Because TMPRSS6 mRNA expression is not regulated by acute iron deprivation (Figure 3C-E), matriptase-2 protein levels were measured with an antibody that was generated to the stem portion of human matriptase-2 protein. This antibody was able to immunodetect both human and rat matriptase-2 in HEK293 cells transiently transfected with either human or rat TMPRSS6 cDNA (Figure 5A). It could detect a band that migrated at a size similar to human or rat matriptase-2–positive controls, only in rat liver, not in rat skeletal muscle (Figure 5A; supplemental Figure 1). Importantly, the antibody detected a doublet in the liver membrane preparations from wild-type mice but not from Tmprss6−/− mice (Figure 5B). These results indicate the specificity of this anti–matriptase-2 antibody. It is interesting to note that matriptase-2 in HepG2 cells migrated as a greater molecular weight species than that in HEK293 cells (Figure 5C), suggesting additional posttranslational processing in hepatocytes. This observation may explain why the matriptase-2 bands detected in rat liver extracts also migrate as a higher molecular weight species than the control matriptase-2 from HEK293 cells (Figure 5D-F).
Western blot analysis of matriptase-2 protein in rat liver tissues. (A) Western blot analysis of matriptase-2 (M2), TfR1, and β-actin in rat muscle and whole liver tissues. Gastrocnemius muscle and liver extract proteins (250 μg) from rats fed either a control diet (control) or an ID diet for 3 days were separated by use of 11% SDS-PAGE under reducing conditions, followed by transfer onto nitrocellulose membrane. Membranes were probed with rabbit anti–matriptase-2 (M2), mouse anti-TfR1 (TfR1), and mouse anti–β-actin, followed by immunodetection with corresponding HRP-conjugated secondary antibodies. The blot was exposed to X-ray film. Cell lysates (100 μg protein per lane) from HEK293 cells transiently transfected with either empty vector (C), human TMPRSS6 cDNA (hM2), or rat TMPRSS6 cDNA (rM2) were included as the negative and positive controls, respectively. Two images for matriptase-2 (M2) with different exposure time (top and middle panels) were presented to show the M2 bands in transfected cells. Note that muscle lysates have high levels of β-actin. (B) Western blot analysis of matriptase-2 (M2) and β-actin in mouse liver tissues. Liver membrane extract proteins (250 μg) from 2 8-week-old Tmprss6−/− mice (−/−) and 2 age- and sex-matched wild-type counterparts (wt) were separated with 11% SDS-PAGE under reducing conditions, followed by transfer onto nitrocellulose membrane. Membranes were probed with rabbit anti–matriptase-2 (M2) and mouse anti–β-actin, followed by immunodetection with corresponding HRP-conjugated secondary antibodies. The blot was exposed to X-ray film. Cell lysates (100 μg protein per lane) from HEK293 cells transiently transfected with either empty vector (C) or rat TMPRSS6 cDNA (rM2) were included as the negative and positive controls, respectively. Experiments were repeated twice with consistent results. (C) Western blot analysis of matriptase-2 (M2) and β-actin in HepG2 and HEK293 cells. HepG2 and HEK293 cells in 12-well pates were transiently transfected with either pcDNA3.1-human TMPRSS6 (pcDNA3.1-M2) or pcDNA3.1 empty vector with Lipofectamine 2000. At approximately 48 hours after transfection, cell lysates were subjected to 11% SDS-PAGE, followed by immunodetection with rabbit anti–matriptase-2 (M2), mouse anti–β-actin, and the corresponding HRP-conjugated secondary antibodies. The blot was exposed to X-ray film. Experiments were repeated 4 times with consistent results. (D-F) Western blot analysis of matriptase-2 (M2) and β-actin (actin) in rat liver tissue extract proteins (250 μg) from the animals at 1 day (D), 2 days (E), and 3 days (F). Cell lysates (100 μg protein per lane) from HEK293 cells transiently transfected with either empty vector (C) or human TMPRSS6 cDNA (hM2) were included as the negative and positive controls, respectively. Experiments were performed as described previously in panel A. For each set of analyses, both matriptase-2 (M2) and β-actin (actin) images were derived from the same gel. (G) Quantitative immunoblot analysis of matriptase-2 in panels D through F. The quantification of matriptase-2 bands in panels D through F was performed in essentially the same manner as described previously except that fluorescently labeled goat secondary antibody was used. The intensity of each band was recorded as arbitrary units. We first normalized the intensity of the matriptase-2 band by using β-actin as a loading control. The relative amounts of matriptase-2 in the ID group versus in the corresponding control group are presented. The differences between the control and ID groups were evaluated with the 2-tailed Student t test. All the Western blot analyses were repeated at least twice and showed consistent results. hM2, human matriptase-2; rM2, rat matriptase-2; **P < .01; ***P < .001.
Western blot analysis of matriptase-2 protein in rat liver tissues. (A) Western blot analysis of matriptase-2 (M2), TfR1, and β-actin in rat muscle and whole liver tissues. Gastrocnemius muscle and liver extract proteins (250 μg) from rats fed either a control diet (control) or an ID diet for 3 days were separated by use of 11% SDS-PAGE under reducing conditions, followed by transfer onto nitrocellulose membrane. Membranes were probed with rabbit anti–matriptase-2 (M2), mouse anti-TfR1 (TfR1), and mouse anti–β-actin, followed by immunodetection with corresponding HRP-conjugated secondary antibodies. The blot was exposed to X-ray film. Cell lysates (100 μg protein per lane) from HEK293 cells transiently transfected with either empty vector (C), human TMPRSS6 cDNA (hM2), or rat TMPRSS6 cDNA (rM2) were included as the negative and positive controls, respectively. Two images for matriptase-2 (M2) with different exposure time (top and middle panels) were presented to show the M2 bands in transfected cells. Note that muscle lysates have high levels of β-actin. (B) Western blot analysis of matriptase-2 (M2) and β-actin in mouse liver tissues. Liver membrane extract proteins (250 μg) from 2 8-week-old Tmprss6−/− mice (−/−) and 2 age- and sex-matched wild-type counterparts (wt) were separated with 11% SDS-PAGE under reducing conditions, followed by transfer onto nitrocellulose membrane. Membranes were probed with rabbit anti–matriptase-2 (M2) and mouse anti–β-actin, followed by immunodetection with corresponding HRP-conjugated secondary antibodies. The blot was exposed to X-ray film. Cell lysates (100 μg protein per lane) from HEK293 cells transiently transfected with either empty vector (C) or rat TMPRSS6 cDNA (rM2) were included as the negative and positive controls, respectively. Experiments were repeated twice with consistent results. (C) Western blot analysis of matriptase-2 (M2) and β-actin in HepG2 and HEK293 cells. HepG2 and HEK293 cells in 12-well pates were transiently transfected with either pcDNA3.1-human TMPRSS6 (pcDNA3.1-M2) or pcDNA3.1 empty vector with Lipofectamine 2000. At approximately 48 hours after transfection, cell lysates were subjected to 11% SDS-PAGE, followed by immunodetection with rabbit anti–matriptase-2 (M2), mouse anti–β-actin, and the corresponding HRP-conjugated secondary antibodies. The blot was exposed to X-ray film. Experiments were repeated 4 times with consistent results. (D-F) Western blot analysis of matriptase-2 (M2) and β-actin (actin) in rat liver tissue extract proteins (250 μg) from the animals at 1 day (D), 2 days (E), and 3 days (F). Cell lysates (100 μg protein per lane) from HEK293 cells transiently transfected with either empty vector (C) or human TMPRSS6 cDNA (hM2) were included as the negative and positive controls, respectively. Experiments were performed as described previously in panel A. For each set of analyses, both matriptase-2 (M2) and β-actin (actin) images were derived from the same gel. (G) Quantitative immunoblot analysis of matriptase-2 in panels D through F. The quantification of matriptase-2 bands in panels D through F was performed in essentially the same manner as described previously except that fluorescently labeled goat secondary antibody was used. The intensity of each band was recorded as arbitrary units. We first normalized the intensity of the matriptase-2 band by using β-actin as a loading control. The relative amounts of matriptase-2 in the ID group versus in the corresponding control group are presented. The differences between the control and ID groups were evaluated with the 2-tailed Student t test. All the Western blot analyses were repeated at least twice and showed consistent results. hM2, human matriptase-2; rM2, rat matriptase-2; **P < .01; ***P < .001.
The levels of liver matriptase-2 in rats fed an ID diet were detected by Western blot. HEK293 cell lysates transiently transfected with human TMPRSS6 cDNA were included as a positive control. An increase in matriptase-2 in the ID group at 1 day was evident compared with the corresponding control group (Figure 5D). The increase became more apparent in the ID groups at 2 and 3 days (Figure 5E-F). No matriptase-2 band was detectable in gastrocnemius muscle in rats fed either a control or an ID diet for 3 days (Figure 5A) in keeping with its lack of expression in this tissue. Quantitative immunoblot analysis showed approximately 2-, 4-, and 5-fold increase in matriptase-2 protein at ID day 1, 2, and 3 groups, respectively (Figure 5G). Together, these results indicate that the rapid suppression of hepcidin expression in response to acute iron deprivation is associated with an increase of matriptase-2 protein in the liver.
HAI-1 and HAI-2 are cognate inhibitors of matriptase,36-38 a close homologue of matriptase-2.20 They could also inhibit matriptase-2, thereby indirectly modulating hepcidin expression. The mRNA levels of HAI-1 and HAI-2 and the protein levels of HAI-1 in the livers from day 1 and day 2 rats were analyzed. No significant changes in mRNA and protein were detected (supplemental Figure 2A-C). HAI-2 protein levels were below the limit of detection when a commercial antibody was used (data not shown). These results imply that HAI-1 and HAI-2 mRNA are not likely involved in the suppression of hepcidin expression in response to acute iron deprivation.
Matriptase-2 degrades rapidly
We wanted to explore the underlying mechanism by which matriptase-2 is negatively regulated by iron in HepG2 cells. In this hepatoma cell line, Tf receptor 2, another important regulator in iron homeostasis, is stabilized by holo-Tf,30 and the release of transfected HJV is suppressed by holo-Tf.27 HepG2 cells stably transfected with pcDNA3.1-TMPRSS6 (HepG2-M2) were used as a model. The half-life of matriptase-2 was first assessed by incubating HepG2-M2 cells in the presence of 100 μg/mL cycloheximide to inhibit the nascent protein biosynthesis. A rapid decrease in matriptase-2 was detected during the course of incubation (Figure 6A top) with a half-life of ∼2.5 hours (Figure 6A bottom). We next examined the effects of iron on matriptase-2 degradation. No evident change was found when HepG2-M2 cells were incubated in the presence of apo-Tf, holo-Tf, ferric ammonium citrate, or desferoxamine for 18 hours (data not shown). These results suggest a lack of regulation of matriptase-2 degradation by iron.
Characterization of matriptase-2–mediated HJV cleavage. (A) Half-life of matriptase-2 protein. HepG2 cells stably expressing matriptase-2 (HepG2-M2) were incubated with 100 μg/mL cycloheximide (CHX) for the indicated time intervals. Cell lysates (L) were then prepared and analyzed by immunoblotting by the use of anti–matriptase-2 (MT2) or anti–β-actin (actin) antibodies. HepG2 cells stably transfected with a pcDNA3.1 empty vector (C) were included as a negative control for matriptase-2 (top). The intensities of the bands were quantified with fluorescent secondary antibodies and the Odyssey Infrared Imaging system. The relative fractions of matriptase-2 remaining in cell extracts at each time point were calculated. The graph was generated from 4 separate experiments with duplicates for each time point (bottom). Error bars represent the SD. The estimated half-life of matriptase-2 was approximately 2.5 hours. (B) Matriptase-2 cleaves cellular HJV in HEK293 cells. HEK293 cells stably expressing HJV (HEK293-HJV) in 12-well plates were transiently transfected with an increasing amount of either pcDNA3.1-TMPRSS6 (M2) or a pcDNA3.1-TMPRSS6 construct with a C-terminal myc tag (M2 myc) at 0, 0.13, 0.33, 0.66, 1.33, or 2.0 μg DNA with Lipofectamine 2000. In the mean time, a decreasing amount of pcDNA3.1 empty vector (2.0, 1.87, 1.67, 1.34, 0.67, or 0 μg DNA) was also simultaneously introduced to allow an equal transfection. Approximately 24 hours after transfection, culture medium was replaced with fresh complete medium (Dulbecco modified Eagle medium [DMEM]/10% fetal calf serum [FCS]). At approximately 56 hours after transfection, CM was collected, and cell lysate was prepared. The total lysate and 10% of CM were subjected to SDS-PAGE, followed by immunodetection of myc, matriptase-2 (M2), HJV, and β-actin (actin) in the lysate (L) and HJV in CM. Chemiluminescence was used to visualize the bands. HEK293 cells stably transfected with pcDNA3.1 (C) were included as a negative control for HJV. Experiments were repeated 4 times with consistent results. (C) Coculture of HepG2-M2 cells with HEK293-HJV (HEK-HJV) cells. HepG2 cells (HepG2-C) alone, HepG2-M2 cells alone, HEK293-HJV cells alone, HepG2-C + HEK293-HJV cells, and HepG2-M2 + HEK293-HJV cells were seeded in 12-wells plates at 2.0 × 10⁵ cells per cell type in 1.5 mL of DMEM/10% FCS. Approximately 24 hours after plating, culture medium was replaced with 1.5 mL of fresh DMEM/10% FCS. After another 24 hours of incubation, CM was collected and cell lysate was prepared. Total lysate and 10% of CM were subjected to SDS-PAGE. Matriptase-2 (M2), HJV, and β-actin (actin) in the whole lysate (L) and HJV in 10% of CM were immunodetected as described previously. HEK293-HJV cells transiently transfected with pcDNA3.1-TMPRSS6 (pcDNA3-M2) were included as a control (lanes 11 and 12). Experiments were repeated 6 times with consistent results. (D) Matriptase-2 knockdown. SMARTpool siRNA specific for human TMPRSS6 (Dharmacon) was used to knock down the matriptase-2 in HepG2-M2 cells (lanes 9 and 10). Scrambled siRNA served as a negative control (lanes 7 and 8). RNAiMAX reagent (Invitrogen) was used for the transfection. siRNA transfection was conducted in 12-well plates in complete medium. Approximately 24 hours after siRNA transfection, HJV was introduced by the use of FuGene HD transfection reagent (Roche). Approximately 72 hours after siRNA transfection, CM was collected and cell lysate was prepared. The total lysate and 10% of CM were subjected to SDS-PAGE. Matriptase-2 (M2), HJV, and β-actin (actin) in the lysate (L) and HJV in CM were immunodetected as described previously. HepG2 cells (HepG2-Ctrl) transiently transfected with pcDNA3-HJV were included as a control (lanes 3 and 4). Experiments were repeated 4 times with consistent results.
Characterization of matriptase-2–mediated HJV cleavage. (A) Half-life of matriptase-2 protein. HepG2 cells stably expressing matriptase-2 (HepG2-M2) were incubated with 100 μg/mL cycloheximide (CHX) for the indicated time intervals. Cell lysates (L) were then prepared and analyzed by immunoblotting by the use of anti–matriptase-2 (MT2) or anti–β-actin (actin) antibodies. HepG2 cells stably transfected with a pcDNA3.1 empty vector (C) were included as a negative control for matriptase-2 (top). The intensities of the bands were quantified with fluorescent secondary antibodies and the Odyssey Infrared Imaging system. The relative fractions of matriptase-2 remaining in cell extracts at each time point were calculated. The graph was generated from 4 separate experiments with duplicates for each time point (bottom). Error bars represent the SD. The estimated half-life of matriptase-2 was approximately 2.5 hours. (B) Matriptase-2 cleaves cellular HJV in HEK293 cells. HEK293 cells stably expressing HJV (HEK293-HJV) in 12-well plates were transiently transfected with an increasing amount of either pcDNA3.1-TMPRSS6 (M2) or a pcDNA3.1-TMPRSS6 construct with a C-terminal myc tag (M2 myc) at 0, 0.13, 0.33, 0.66, 1.33, or 2.0 μg DNA with Lipofectamine 2000. In the mean time, a decreasing amount of pcDNA3.1 empty vector (2.0, 1.87, 1.67, 1.34, 0.67, or 0 μg DNA) was also simultaneously introduced to allow an equal transfection. Approximately 24 hours after transfection, culture medium was replaced with fresh complete medium (Dulbecco modified Eagle medium [DMEM]/10% fetal calf serum [FCS]). At approximately 56 hours after transfection, CM was collected, and cell lysate was prepared. The total lysate and 10% of CM were subjected to SDS-PAGE, followed by immunodetection of myc, matriptase-2 (M2), HJV, and β-actin (actin) in the lysate (L) and HJV in CM. Chemiluminescence was used to visualize the bands. HEK293 cells stably transfected with pcDNA3.1 (C) were included as a negative control for HJV. Experiments were repeated 4 times with consistent results. (C) Coculture of HepG2-M2 cells with HEK293-HJV (HEK-HJV) cells. HepG2 cells (HepG2-C) alone, HepG2-M2 cells alone, HEK293-HJV cells alone, HepG2-C + HEK293-HJV cells, and HepG2-M2 + HEK293-HJV cells were seeded in 12-wells plates at 2.0 × 10⁵ cells per cell type in 1.5 mL of DMEM/10% FCS. Approximately 24 hours after plating, culture medium was replaced with 1.5 mL of fresh DMEM/10% FCS. After another 24 hours of incubation, CM was collected and cell lysate was prepared. Total lysate and 10% of CM were subjected to SDS-PAGE. Matriptase-2 (M2), HJV, and β-actin (actin) in the whole lysate (L) and HJV in 10% of CM were immunodetected as described previously. HEK293-HJV cells transiently transfected with pcDNA3.1-TMPRSS6 (pcDNA3-M2) were included as a control (lanes 11 and 12). Experiments were repeated 6 times with consistent results. (D) Matriptase-2 knockdown. SMARTpool siRNA specific for human TMPRSS6 (Dharmacon) was used to knock down the matriptase-2 in HepG2-M2 cells (lanes 9 and 10). Scrambled siRNA served as a negative control (lanes 7 and 8). RNAiMAX reagent (Invitrogen) was used for the transfection. siRNA transfection was conducted in 12-well plates in complete medium. Approximately 24 hours after siRNA transfection, HJV was introduced by the use of FuGene HD transfection reagent (Roche). Approximately 72 hours after siRNA transfection, CM was collected and cell lysate was prepared. The total lysate and 10% of CM were subjected to SDS-PAGE. Matriptase-2 (M2), HJV, and β-actin (actin) in the lysate (L) and HJV in CM were immunodetected as described previously. HepG2 cells (HepG2-Ctrl) transiently transfected with pcDNA3-HJV were included as a control (lanes 3 and 4). Experiments were repeated 4 times with consistent results.
Matriptase-2 cleaves HJV independently of the proteolytic cleavage of its catalytic domain
An increase in liver matriptase-2 by acute iron deprivation could be attributable to the lack of matriptase-2 shedding from hepatocytes. Full-length matriptase-2 was reported to be an inactive zymogen,20 and its activation is predicted to involve the cleavage and release of the catalytic domain at the C-terminus. The activated catalytic domain is presumed to be either associated with the matriptase-2 stem region via disulfide bonds or shed as a soluble form.20 We introduced matriptase-2 with or without a C-terminal myc tag into HEK293 cells stably expressing HJV (HEK293-HJV). Expression of either form of matriptase-2 resulted in the release into the conditioned medium (CM) of sHJV, which migrates at approximately 36 kDa (Figure 6B bottom). This finding is consistent with a previous report.17 The 40-kDa sHJV detected in the CM (Figure 6B bottom) is the cleavage product of proprotein furin convertase. No cleaved matriptase-2 catalytic domain, which is expected to migrate at 30 kDa, could be detected in the cell extracts using an anti-myc antibody (Figure 6B, top). These results indicate that the cleaved matriptase-2 catalytic domain is not associated with the cells.
Matriptase-2 catalytic domain is detectable in the CM of transfected cells by Western blot (data not shown).17,39 We functionally tested whether a shed matriptase-2 catalytic domain could be responsible for the cleavage of membrane HJV by coculturing HEK293-HJV cells with HepG2-M2 cells. No matriptase-2 cleaved sHJV product was detected in the CM (Figure 6C lanes 5/6 vs 9/10), which is in contrast to the transfection of matriptase-2 into HEK293-HJV cells (Figure 6C lanes 5/6 vs 11/12). The matriptase-2 in HepG2-M2 cells was able to cleave HJV (Figure 6D lanes 7/8 vs 3/4), and siRNA knockdown of matriptase-2 abolished the cleavage (Figure 6D lanes 9/10 vs 7/8). It is unclear why coculture decreases cellular HJV but not the shed in HEK293-HJV cells (Figure 6C lanes 9/10 vs 5/6). These results suggest that the shed matriptase-2 catalytic domain does not cleave HJV.
Acute iron loading induces hepcidin expression but does not alter BMP6 mRNA expression
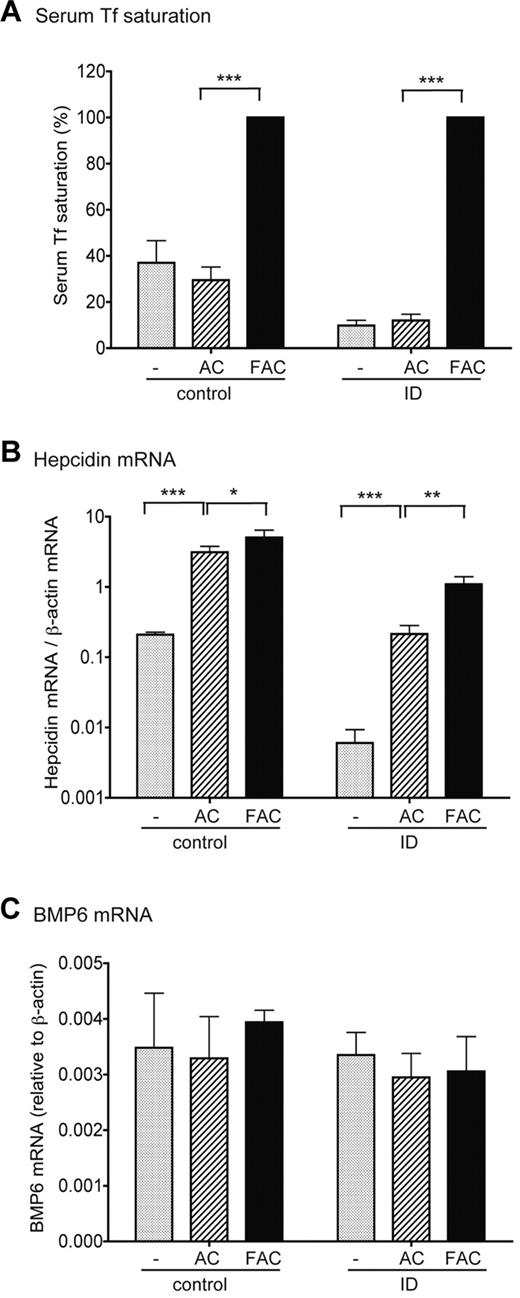
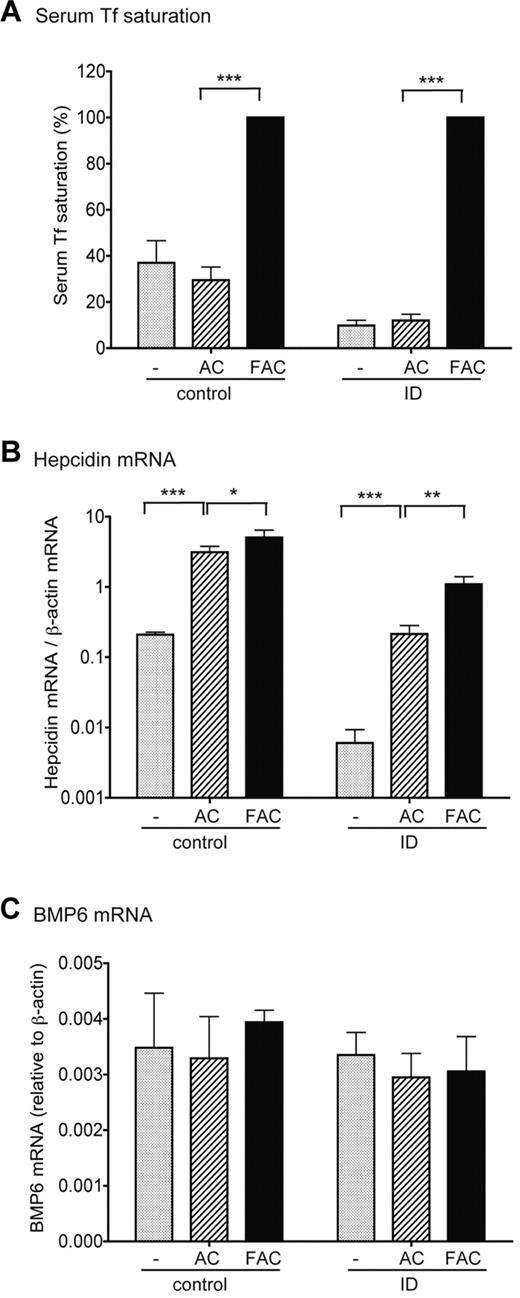
We also examined the induction of hepcidin expression in response to acute iron loading with the changes in BMP6 and TMPRSS6 mRNA expression in the liver. Weanling rats fed either a control diet or an ID diet for 3 days were injected intraperitoneally with either ferric ammonium citrate (FAC) as the iron source at 2.5 mg iron/100 g body weight, or the same amount of ammonium citrate (AC) as a control. Three hours after injection of FAC, Tf saturation reached approximately 100% in both the control and ID groups (Figure 7A). As expected, increases in Tf saturation in both control/FAC and ID/FAC groups resulted in a rapid and significant increase in hepcidin mRNA by approximately 1.9- and 5.1-fold, compared with the corresponding AC groups, respectively (Figure 7B). In contrast, no significant changes either in BMP6 and TMPRSS6 mRNA or in matriptase-2 protein levels were detected in either group (Figure 7C; supplemental Figure 3). These results imply that the induction of hepcidin expression in response to acute iron loading is not mediated through the increased transcription of BMP6 gene or a decrease in matriptase-2 expression. Both AC and FAC elevated the basal levels of hepcidin mRNA through an undefined mechanism (Figure 7B).
Induction of hepcidin expression in response to acute iron loading does not result from the increase of BMP6 mRNA expression. Weanling male rats were first fed a control diet (50 mg Fe/kg diet, group control) or were pair-fed an ID diet (< 2 mg Fe/kg diet, group ID) for 3 days. Animals in each category were then divided into 3 groups. One group (−) was euthanized immediately, whereas the other 2 groups were injected intraperitoneally with either FAC in phosphate-buffered saline at approximately 2.5 mg iron per 100 g of body weight or pair-injected with an equal amount of AC. The last 2 groups of animals were euthanized for analysis after 3 hours. (A) Serum Tf saturation in control and ID animals before injection (−) or after injection with AC or FAC. (B) qRT-PCR analysis of hepatic hepcidin mRNA in control and ID animals before injection (−) or after injection with AC or FAC. Liver tissues were collected from the same animals as described previously in panel A. Results are expressed as the amounts relative to β-actin. (C) qRT-PCR analysis of hepatic BMP6 mRNA in control and ID animals before injection (−) or after injection with AC or FAC. Liver tissues were collected from the same animals as described previously in panel A. Results are expressed as the amounts relative to β-actin. There are 4 animals per group. For all results shown previously, the mean values and the SD for each group are presented. The one-way analysis of variance and Tukey post test were used to compare the difference between groups. *P < .05; **P < .001; ***P < .001.
Induction of hepcidin expression in response to acute iron loading does not result from the increase of BMP6 mRNA expression. Weanling male rats were first fed a control diet (50 mg Fe/kg diet, group control) or were pair-fed an ID diet (< 2 mg Fe/kg diet, group ID) for 3 days. Animals in each category were then divided into 3 groups. One group (−) was euthanized immediately, whereas the other 2 groups were injected intraperitoneally with either FAC in phosphate-buffered saline at approximately 2.5 mg iron per 100 g of body weight or pair-injected with an equal amount of AC. The last 2 groups of animals were euthanized for analysis after 3 hours. (A) Serum Tf saturation in control and ID animals before injection (−) or after injection with AC or FAC. (B) qRT-PCR analysis of hepatic hepcidin mRNA in control and ID animals before injection (−) or after injection with AC or FAC. Liver tissues were collected from the same animals as described previously in panel A. Results are expressed as the amounts relative to β-actin. (C) qRT-PCR analysis of hepatic BMP6 mRNA in control and ID animals before injection (−) or after injection with AC or FAC. Liver tissues were collected from the same animals as described previously in panel A. Results are expressed as the amounts relative to β-actin. There are 4 animals per group. For all results shown previously, the mean values and the SD for each group are presented. The one-way analysis of variance and Tukey post test were used to compare the difference between groups. *P < .05; **P < .001; ***P < .001.
Discussion
We characterized the association between BMP6 and matriptase-2 expression in the suppression of hepcidin expression in response to acute iron deprivation. BMP6 mRNA was detected predominantly in liver nonparenchymal cells, whereas TMPRSS6 mRNA was localized mainly in hepatocytes. In response to acute iron deprivation, we detected a close correlation of the marked suppression of hepcidin mRNA expression with the rapid decrease in serum Tf saturation and the increase in matriptase-2 protein in the liver. No iron-dependent changes in BMP6 and TMPRSS6 mRNA levels were detected.
Both BMP6 and matriptase-2 are highly expressed in the liver.31,34,35 They are key opposing regulators of hepcidin expression.14-16,21 Here we showed a predominant localization of BMP6 mRNA in the liver nonparenchymal cells, especially in SEC, and an exclusive expression of TMPRSS6 mRNA in hepatocytes. SECs constitute the largest population of nonparenchymal cells in the liver.40 The expression profile of BMP6 mRNA is consistent with a previous study.31 In that study, researchers analyzed the expression levels of BMP6 mRNA in HSC, KC, and hepatocytes by Northern blot and only detected BMP6 mRNA in HSC and KC. They did not isolate the distinct population of SEC. In addition, our results also indicated a predominant localization of BMP2/4/5/9 and TGF-β1 mRNA in liver nonparenchymal cells. Although all of these cytokines are inducers of hepcidin expression,5,7 only BMP6 mRNA appears to be regulated in mouse models by chronic iron loading or depletion.3 Because hepcidin is predominantly expressed in hepatocytes that are in a close contact with the nonparenchymal cells, especially SEC and HSC,28,40-42 these observations suggest the existence of crosstalk between nonparenchymal cells and hepatocytes in the regulation of hepcidin expression, in which the former acts as a source for BMP ligands. This assumption remains to be determined in animal models with chronic iron loading or deprivation.
The localization of TMPRSS6 mRNA in hepatocytes has an important implication, with respect to the role of matriptase-2 in the suppression of hepcidin expression. Matriptase-2, a serine protease,35 binds membrane HJV and degrades it by cleaving HJV into fragments.17 Therefore, HJV is a potential substrate for matriptase-2. Similar to TMPRSS6, liver HJV is primarily expressed in hepatocytes.11,13,43 Membrane HJV is essential for hepatic hepcidin expression.4 The colocalization of matriptase-2 and HJV in hepatocytes suggests that matriptase-2 is in the right location to suppress hepcidin expression through its interaction with membrane HJV. This assumption is supported by 2 recent studies, showing that lack of Hjv expression abolishes the anemic phenotype either in Tmprss6-null mice or in mice with a nonfunctional Tmprss6.21,22,44
In the rat model of acute iron deprivation, we detected a close association between the inhibition of hepcidin mRNA and the decrease in Tf saturation. This association is especially striking in the ID day 1 group. We also observed a similar decrease in hepcidin mRNA for the ID day 2 and day 3 groups even with a lower Tf saturation. These data indicate the existence of acutely responsive machinery for low Tf saturation in the liver. We hypothesize that once the Tf saturation decreases below a certain threshold, the expression of hepcidin is rapidly down-regulated. Lin et al33 studied the correlation of acute iron loading with the urinary hepcidin excretion in human subjects and showed a proportional increase of urinary hepcidin to peak Tf-saturation. Taken together, these observations indicate that Tf saturation is the key regulatory factor for hepcidin expression.
We detected reduced BMP signaling in the liver tissues of the animals with acute iron deprivation, providing further independent evidence for the critical role of BMP signaling in the regulation of hepcidin expression. Previous authors have demonstrated that BMP6 mRNA expression is regulated by chronic iron loading or deprivation and that BMP6 mRNA levels are closely correlated with the levels of hepcidin expression in mice.3 Initially we predicted that the rapid suppression of hepcidin expression in response to acute iron deprivation results from either the rapid decrease of BMP6 mRNA or marked increase of TMPRSS6 mRNA or both. We did not find any significant change in either BMP6 or TMPRSS6 mRNA levels in the ID groups. The lack of change in TMPRSS6 mRNA levels is consistent with the observation that the repeated bleeding of mice markedly decreases hepcidin expression but has no significant effect on TMPRSS6 mRNA levels in the liver.45 These observations suggest that the suppression of hepcidin expression in response to acute iron deprivation does not result from the regulation of BMP6 and TMPRSS6 mRNA expression.
sHJV is another potential candidate. Its release is negatively regulated by iron both in transfected cell lines18,26,27 and in vivo.27 Recent studies indicate that sHJV preferentially binds BMP6 and is able to suppress BMP6-induced hepcidin expression.15 Nonetheless, no significant change in sHJV was detected in ID day 1 group compared with the corresponding controls.27 Thus sHJV could not be the central player in the rapid suppression of hepcidin expression.
In the present study, we detected an increase in matriptase-2 in the livers of animals with acute iron deprivation. Matriptase-2 plays a pivotal role in the suppression of hepcidin expression. Disruption of the function of matriptase-2 in both human and mice markedly elevates hepatic hepcidin expression and results in a severe iron deficiency anemia.16,21,23,24 We explored the underlying mechanism using HepG2 cells as a model. HepG2 cells endogenously express TMPRSS6 mRNA by qRT-PCR, but the protein is marginally detectable by Western blot (data not shown). Transfected matriptase-2 undergoes a rapid degradation, which is consistent with the rapid increase in matriptase-2 protein in rat livers with acute iron deprivation. Interestingly, no significant change in matriptase-2 protein, which is under the control of a CMV promoter and lacks the endogenous 5′- and 3′-untranslated sequences, was detected when cells were treated with iron. In conjunction with the lack of regulation of TMPRSS6 mRNA expression by ID in rat liver, these observations lead to the hypothesis that matriptase-2 expression might be translationally regulated by iron.
Previous studies predict that matriptase-2 acquires its enzymatic activity only after a proteolytic cleavage between its catalytic domain and the stem region in its extracellular domain.17,20 Using a synthetic peptide as a substrate, Stirnberg et al39 found that membrane matriptase-2 is an inactive single-chain zymogen, whereas the shed catalytic domain is the active form. Silvestri et al17 reported that only the cell-associated matriptase-2, rather than the shed catalytic domain, is able to cleave HJV. Here we showed that the proteolytic cleavage of matriptase-2 catalytic domain is not required for its acquisition of an enzymatic activity on HJV, which is in favor of the observations by Silvestri et al.17 This finding has an important physiologic implication. HJV binds to the stem region in the extracellular portion of matriptase-2.17 Full-length enzymatically active matriptase-2 would allow a specific target to its physiologic substrate.
In transfected cells, matriptase-2 is predominantly expressed on plasma membrane,16,17,35 whereas most of HJV is intracellularly localized.46 In this study, we did not detect any dramatic decrease in cellular HJV when matriptase-2 is expressed. This might be attributable to the prediction that matriptase-2 only cleaves its substrate on cell surface. In addition, we detected one major sHJV product by matriptase-2 cleavage, rather than a ladder of HJV fragments as previously reported.17 This might be attributable to the differences between cell lines or the amounts of matriptase-2 expressed. This issue remains to be resolved in the future studies.
Studies in animals indicate a Tmprss6-haploinsufficiency in vivo because mice with only one Tmprss6 allele have the increased susceptibility to iron deficiency when large amount of iron is required during growth.22,47 In conjunction with the observations that HAI-1 and HAI-2 mRNA expression do not change in response to acute iron deprivation and that full-length matriptase-2 is an enzymatically active form to HJV in HepG2 cells, we predict that the increased matriptase-2 protein in ID rat liver is proportional to the increase in its enzymatic activity to HJV. We did not detect any evident change in HJV in either the whole-liver extracts or in the total liver membrane preparation (data not shown). This might be because only a very small fraction of HJV was detected on the plasma membrane.46
We also tried to determine whether BMP6 protein was regulated by iron deprivation. Although purified BMP6 was readily detectable by immunoblot, the levels of BMP6 in all rat liver tissues were less than the limit of detection (data not shown). Therefore, the potential regulation of BMP6 by iron at the protein level still remains elusive.
In summary, our results indicated that BMP6 mRNA is primarily expressed in the liver nonparenchymal cells and that TMPRSS6 mRNA is mainly expressed in hepatocytes. In the case of acute iron deprivation, we demonstrated close associations between the rapid suppression of hepatic hepcidin mRNA, the rapid decrease of serum Tf saturation, and the increase of matriptase-2 protein levels in the liver.
The online version of this article contains a data supplement.
The publication costs of this article were defrayed in part by page charge payment. Therefore, and solely to indicate this fact, this article is hereby marked “advertisement” in accordance with 18 USC section 1734.
Acknowledgments
We thank Dr Thomas Bartnikas and Dr Mark Fleming at Harvard University for Tmprss6−/− mice liver tissues and Julia Maxson, Maja Chloupkova, and Junwei Gao for critical reading of this manuscript and helpful comments.
This work was supported by NIH DK080765 (A.-S.Z.), NIH DK066600 (R.S.E.), NIH P50AA11199 (H.T.), NIH R24AA12885 (H.T.), and NIH DK72166 (C.A.E.).
National Institutes of Health
Authorship
Contribution: A.-S.Z. designed the research, performed experiments, and wrote the paper. S.A.A. and R.S.E. designed the research and performed experiments; J.W., F.Y., K.D., R.A., C.P.N., and H.T. performed experiments; and C.A.E. designed the research and edited the paper.
Conflict-of-interest disclosure: The authors declare no competing financial interests.
Correspondence: An-Sheng Zhang, Department of Cell and Developmental Biology L215, OHSU, 3181 SW Sam Jackson Park Rd, Portland, OR 97239; e-mail: zhanga@ohsu.edu.

![Figure 6. Characterization of matriptase-2–mediated HJV cleavage. (A) Half-life of matriptase-2 protein. HepG2 cells stably expressing matriptase-2 (HepG2-M2) were incubated with 100 μg/mL cycloheximide (CHX) for the indicated time intervals. Cell lysates (L) were then prepared and analyzed by immunoblotting by the use of anti–matriptase-2 (MT2) or anti–β-actin (actin) antibodies. HepG2 cells stably transfected with a pcDNA3.1 empty vector (C) were included as a negative control for matriptase-2 (top). The intensities of the bands were quantified with fluorescent secondary antibodies and the Odyssey Infrared Imaging system. The relative fractions of matriptase-2 remaining in cell extracts at each time point were calculated. The graph was generated from 4 separate experiments with duplicates for each time point (bottom). Error bars represent the SD. The estimated half-life of matriptase-2 was approximately 2.5 hours. (B) Matriptase-2 cleaves cellular HJV in HEK293 cells. HEK293 cells stably expressing HJV (HEK293-HJV) in 12-well plates were transiently transfected with an increasing amount of either pcDNA3.1-TMPRSS6 (M2) or a pcDNA3.1-TMPRSS6 construct with a C-terminal myc tag (M2 myc) at 0, 0.13, 0.33, 0.66, 1.33, or 2.0 μg DNA with Lipofectamine 2000. In the mean time, a decreasing amount of pcDNA3.1 empty vector (2.0, 1.87, 1.67, 1.34, 0.67, or 0 μg DNA) was also simultaneously introduced to allow an equal transfection. Approximately 24 hours after transfection, culture medium was replaced with fresh complete medium (Dulbecco modified Eagle medium [DMEM]/10% fetal calf serum [FCS]). At approximately 56 hours after transfection, CM was collected, and cell lysate was prepared. The total lysate and 10% of CM were subjected to SDS-PAGE, followed by immunodetection of myc, matriptase-2 (M2), HJV, and β-actin (actin) in the lysate (L) and HJV in CM. Chemiluminescence was used to visualize the bands. HEK293 cells stably transfected with pcDNA3.1 (C) were included as a negative control for HJV. Experiments were repeated 4 times with consistent results. (C) Coculture of HepG2-M2 cells with HEK293-HJV (HEK-HJV) cells. HepG2 cells (HepG2-C) alone, HepG2-M2 cells alone, HEK293-HJV cells alone, HepG2-C + HEK293-HJV cells, and HepG2-M2 + HEK293-HJV cells were seeded in 12-wells plates at 2.0 × 10⁵ cells per cell type in 1.5 mL of DMEM/10% FCS. Approximately 24 hours after plating, culture medium was replaced with 1.5 mL of fresh DMEM/10% FCS. After another 24 hours of incubation, CM was collected and cell lysate was prepared. Total lysate and 10% of CM were subjected to SDS-PAGE. Matriptase-2 (M2), HJV, and β-actin (actin) in the whole lysate (L) and HJV in 10% of CM were immunodetected as described previously. HEK293-HJV cells transiently transfected with pcDNA3.1-TMPRSS6 (pcDNA3-M2) were included as a control (lanes 11 and 12). Experiments were repeated 6 times with consistent results. (D) Matriptase-2 knockdown. SMARTpool siRNA specific for human TMPRSS6 (Dharmacon) was used to knock down the matriptase-2 in HepG2-M2 cells (lanes 9 and 10). Scrambled siRNA served as a negative control (lanes 7 and 8). RNAiMAX reagent (Invitrogen) was used for the transfection. siRNA transfection was conducted in 12-well plates in complete medium. Approximately 24 hours after siRNA transfection, HJV was introduced by the use of FuGene HD transfection reagent (Roche). Approximately 72 hours after siRNA transfection, CM was collected and cell lysate was prepared. The total lysate and 10% of CM were subjected to SDS-PAGE. Matriptase-2 (M2), HJV, and β-actin (actin) in the lysate (L) and HJV in CM were immunodetected as described previously. HepG2 cells (HepG2-Ctrl) transiently transfected with pcDNA3-HJV were included as a control (lanes 3 and 4). Experiments were repeated 4 times with consistent results.](https://ash.silverchair-cdn.com/ash/content_public/journal/blood/117/5/10.1182_blood-2010-06-287292/4/m_zh89991065820006.jpeg?Expires=1769209994&Signature=y0pOtYjjsbPf8WwAi0nuBC0Xbz8AezdrZ1cBUGyIDNA7T06nK--lrrAs2bEuCaSP8fNKU6H21s2Pzr21Sj2waiS8upLvA0HI~ioVF32EI79ge-akNEjt0ZdLvzEk8hk5ljiPDg3mnypY9w4IbUrbyMTBAf6gKZcja4aU7GlZGG5Ngon3zo4IkqHpLmy2JjvXYd3HktbniWbU3A1uMGv7SXpmH9S9rUfdc4mvrou~Evl5lS83YqgOxGLorsTvsPGY9HiRnB2hrRuZpgOQ4bWzLmCbPvhJ8nryd8Xxu4neJWuRIiX9PJPpLMez3RxOvIYBAnwhgpiBQFBckosUI9ZAKg__&Key-Pair-Id=APKAIE5G5CRDK6RD3PGA)

![Figure 6. Characterization of matriptase-2–mediated HJV cleavage. (A) Half-life of matriptase-2 protein. HepG2 cells stably expressing matriptase-2 (HepG2-M2) were incubated with 100 μg/mL cycloheximide (CHX) for the indicated time intervals. Cell lysates (L) were then prepared and analyzed by immunoblotting by the use of anti–matriptase-2 (MT2) or anti–β-actin (actin) antibodies. HepG2 cells stably transfected with a pcDNA3.1 empty vector (C) were included as a negative control for matriptase-2 (top). The intensities of the bands were quantified with fluorescent secondary antibodies and the Odyssey Infrared Imaging system. The relative fractions of matriptase-2 remaining in cell extracts at each time point were calculated. The graph was generated from 4 separate experiments with duplicates for each time point (bottom). Error bars represent the SD. The estimated half-life of matriptase-2 was approximately 2.5 hours. (B) Matriptase-2 cleaves cellular HJV in HEK293 cells. HEK293 cells stably expressing HJV (HEK293-HJV) in 12-well plates were transiently transfected with an increasing amount of either pcDNA3.1-TMPRSS6 (M2) or a pcDNA3.1-TMPRSS6 construct with a C-terminal myc tag (M2 myc) at 0, 0.13, 0.33, 0.66, 1.33, or 2.0 μg DNA with Lipofectamine 2000. In the mean time, a decreasing amount of pcDNA3.1 empty vector (2.0, 1.87, 1.67, 1.34, 0.67, or 0 μg DNA) was also simultaneously introduced to allow an equal transfection. Approximately 24 hours after transfection, culture medium was replaced with fresh complete medium (Dulbecco modified Eagle medium [DMEM]/10% fetal calf serum [FCS]). At approximately 56 hours after transfection, CM was collected, and cell lysate was prepared. The total lysate and 10% of CM were subjected to SDS-PAGE, followed by immunodetection of myc, matriptase-2 (M2), HJV, and β-actin (actin) in the lysate (L) and HJV in CM. Chemiluminescence was used to visualize the bands. HEK293 cells stably transfected with pcDNA3.1 (C) were included as a negative control for HJV. Experiments were repeated 4 times with consistent results. (C) Coculture of HepG2-M2 cells with HEK293-HJV (HEK-HJV) cells. HepG2 cells (HepG2-C) alone, HepG2-M2 cells alone, HEK293-HJV cells alone, HepG2-C + HEK293-HJV cells, and HepG2-M2 + HEK293-HJV cells were seeded in 12-wells plates at 2.0 × 10⁵ cells per cell type in 1.5 mL of DMEM/10% FCS. Approximately 24 hours after plating, culture medium was replaced with 1.5 mL of fresh DMEM/10% FCS. After another 24 hours of incubation, CM was collected and cell lysate was prepared. Total lysate and 10% of CM were subjected to SDS-PAGE. Matriptase-2 (M2), HJV, and β-actin (actin) in the whole lysate (L) and HJV in 10% of CM were immunodetected as described previously. HEK293-HJV cells transiently transfected with pcDNA3.1-TMPRSS6 (pcDNA3-M2) were included as a control (lanes 11 and 12). Experiments were repeated 6 times with consistent results. (D) Matriptase-2 knockdown. SMARTpool siRNA specific for human TMPRSS6 (Dharmacon) was used to knock down the matriptase-2 in HepG2-M2 cells (lanes 9 and 10). Scrambled siRNA served as a negative control (lanes 7 and 8). RNAiMAX reagent (Invitrogen) was used for the transfection. siRNA transfection was conducted in 12-well plates in complete medium. Approximately 24 hours after siRNA transfection, HJV was introduced by the use of FuGene HD transfection reagent (Roche). Approximately 72 hours after siRNA transfection, CM was collected and cell lysate was prepared. The total lysate and 10% of CM were subjected to SDS-PAGE. Matriptase-2 (M2), HJV, and β-actin (actin) in the lysate (L) and HJV in CM were immunodetected as described previously. HepG2 cells (HepG2-Ctrl) transiently transfected with pcDNA3-HJV were included as a control (lanes 3 and 4). Experiments were repeated 4 times with consistent results.](https://ash.silverchair-cdn.com/ash/content_public/journal/blood/117/5/10.1182_blood-2010-06-287292/4/m_zh89991065820006.jpeg?Expires=1769265973&Signature=ZfsjyXQYcPIY6AUoPq-D2hK8KHI4kGZaBN~lxN~uEDUrrAGM62QbwODRDJ-pkwtFs-TfZlFNTuPg~sYo3KlDNS6xvPZkWu1JqnOs3-M1jN1WS5fWzkbz8UyQUw2tX4TFJKA4P0sMOgP7lM~PJf812Q7E1Db0YyEhIJ5zaKt5yjiTxbMbUIRNF6UBf8uA6iq4jp2ZsKrqOsHIarI0h7AUQd6rTXaRh~dkEzfvSjPWXRTFfHkSpOVU8yRweP9Y3s1G2Z6fy936C8QGXLGmoxKJ0X3cof8W6LGD7E99tmYsEPzeKj2xznu5UnBckewicCHQ6nLm39hLy9DI70QLRnA3lg__&Key-Pair-Id=APKAIE5G5CRDK6RD3PGA)
