Abstract
Many mammalian transcripts contain target sites for multiple miRNAs, although it is not clear to what extent miRNAs may coordinately regulate single genes. We have mapped the interactions between down-regulated miRNAs and overexpressed target protein-coding genes in murine and human lymphomas. Myc, one of the hallmark oncogenes in these lymphomas, stands out as the up-regulated gene with the highest number of genetic interactions with down-regulated miRNAs in mouse lymphomas. The regulation of Myc by several of these miRNAs is confirmed by cellular and reporter assays. The same approach identifies MYC and multiple Myc targets as a preferential target of down-regulated miRNAs in human Burkitt lymphoma, a pathology characterized by translocated MYC oncogenes. These results indicate that several miRNAs must be coordinately down-regulated to enhance critical oncogenes, such as Myc. Some of these Myc-targeting miRNAs are repressed by Myc, suggesting that these tumors are a consequence of the unbalanced activity of Myc versus miRNAs.
Introduction
Tumor development is accompanied by a variety of genetic and epigenetic alterations in protein-coding genes and small, noncoding RNA genes. miRNAs are a diverse family of small RNAs that regulate the stability and translational efficiency of partially complementary target mRNAs.1,2 By regulating specific oncogenes or tumor-suppressor molecules, these small RNAs may have profound effects in tumor development.3 A few target genes have been validated for some miRNAs indicating that each individual miRNA can target a few, or possibly, multiple genes and participate in diverse physiologic or pathologic functions. Thus, the miR-15a–miR-16–1 cluster controls prostate cancer by targeting proliferation, survival, and invasion regulators.4 Let-7 miRNAs act as tumor suppressors by modulating major oncogenes, such as Ras or Myc, among many other targets.5 On the other hand, each human gene can be modulated putatively by several miRNAs. However, the relevance of this multiplicity in tumorigenesis is not clear.
In this work, we have investigated the relationship between the expression of miRNAs and their putative targets in murine and human lymphomas. The pioneer molecular studies on γ-irradiation-induced lymphomas led to the identification of N-ras and K-ras as critical oncogenes in these tumors.6,7 Additional cytogenetic studies demonstrated recurrent chromosomal alterations, such as specific translocations and trisomy of mouse chromosome 15 where the Myc oncogene is located.8 In addition to Ras and Myc oncogenes, other tumor-promoting or tumor-suppresing genes, such as Notch1, p53, pRb, cyclin D, p16INK4a and p15INK4b, p19ARF, Pten, or Ikaros, have been suggested to play a significant role in the development of these malignancies.9-15 Many of these oncogenic events are common to high proliferative lymphomas in humans. Burkitt lymphoma (BL) is a unique hematologic malignancy remarkable for its biologic characteristics, including its highly aggressive nature and its requirement for intensive treatment regimens.16 Human BLs possess chromosomal rearrangements of the MYC oncogene (a genetic hallmark of these neoplasms), which contributes to lymphomagenesis through alterations in cell cycle regulation, cellular differentiation, apoptosis, cellular adhesion, and metabolism.17
In this work, we initially identified a panel of 41 miRNAs consistently down-regulated in γ-irradiation-induced lymphomas. Although some of these miRNAs, such as mir-203, mir-134, or mir-154, map to a region that suffers frequent DNA losses, most repressed miRNAs map to regions without DNA alterations. A few of these miRNAs, such as miR-203, are silenced by aberrant hypermethylation of the promoter region,18 whereas other miRNAs may be repressed by Myc.19 Interestingly, our data suggest that miRNAs may have a combinatorial effect to suppress the activity of relevant oncogenes. Indeed, Myc is predicted to be the major target of the miRNAs silenced in these malignancies. The regulation of Myc by several miRNAs is validated by reporter and cellular assays. A similar analysis also identifies MYC as a major target for the panel of miRNAs down-regulated in human BLs. The down-regulation of multiple miRNAs in these malignancies is predicted to favor not only the overexpression of Myc but also the up-regulation of multiple Myc targets involved in proliferation or differentiation, thus suggesting that the balance between Myc and miRNAs is critical for lymphomagenesis and may be further explored for therapy of these neoplasms.
Methods
Mouse and human tumors
C57BL/6J and RF/J F1 hybrid mice and pure C57BL/6J animals were maintained in our animal facilities following the appropriate ethical recommendations from our institutions. For tumor induction, 4-week-old mice of both sexes were exposed to 4 weekly doses of 1.75 Gy/dose of ionizing γ-radiation.6 Treated mice were observed daily until moribund and then killed and autopsied. Retroviral mutagenesis was performed as published previously.20 In short, newborn mice were injected intraperitoneally with 105 infectious units of murine leukemia virus, and animals were monitored in time for the development of tumors. Moribund mice were killed and tumors isolated. Tumor and normal (age-matched) tissues were processed for histologic analysis (paraffin embedding and hematoxilin and eosin staining) following standard protocols. DNA, RNA, and proteins were isolated from these samples as described previously.18
All human BLs were obtained from the Spanish Tumor Bank Network of the Spanish National Cancer Research Center (Centro Nacional de Investigaciones Oncológicas [CNIO]). Institutional review board approval was obtained for these studies, and all participants provided written informed consent in accordance with the Declaration of Helsinki.
Transcriptional profiles, comparative genome hybridization, and statistical analysis
Comparative genome hybridization, cDNA, and miRNA array experiments were performed essentially as described previously on mouse γ-irradiation-induced lymphomas18 or BLs.21 Differentially expressed cDNAs were obtained using Pomelo tool (www.pomelo2.bioinfo.cnio.es), which implements the limma t test using the limma package22 from Bioconductor project. The estimated significance level (P value) was corrected to account for multiple hypotheses testing using Benjamini and Hochberg False Discovery Rate (FDR) adjustment. Genes with FDR less than or equal to 0.01 were selected as differentially expressed between controls and tumors. Gene set enrichment analyses (GSEA) were applied using annotations from Biocarta, KEGG, and GeneMAPP pathway databases. Those miRNAs showing 3′-untranslated region (UTR) binding sites in human MYC were tested as a whole gene set using GSEA. We used FDR < 0.25 as significance threshold for the identification of biologically relevant gene sets.23 Data were also analyzed through the use of Ingenuity Pathways Analysis (Ingenuity Systems, www.ingenuity.com). Those pathways showing FDR < 0.25, which is a well-established cut-off for the identification of biologically relevant gene sets,23 were considered enriched in tumors. Myc targets were obtained from the Myc Cancer Gene Database (www.myccancergene.org/site/mycTargetDB.asp),24 and only those targets characterized in mammals were used for statistical analysis. Significantly deregulated miRNAs were computed using the Significant Analysis of Microarray analysis from the TM4 pathway25 and the limma package. Precomputed miRNA targets were obtained from miRBase Targets Database, Version 5 (www.microrna.sanger.ac.uk). For miRNA studies in these samples, median between-array normalization was applied to make microarrays comparable. Statistical significance was analyzed using the Fisher exact or χ2 tests and Prism v 5.01 (GraphPad) software, and networks of interactions were represented using Cytoscape (www.cytoscape.org). Additional details on the statistical analysis of expression data and miRNA-target networks are provided as supplemental Data (available on the Blood Web site; see the Supplemental Materials link at the top of the online article). All microarray data are available on the Gene Expression Omnibus under accession numbers GSE10861 and GSE23026.
Validation of coding-gene and miRNA expression by quantitative reverse-transcribed polymerase chain reaction and protein analysis
To validate miRNA or cDNA expression data, real-time quantitative reverse-transcribed polymerase chain reaction was performed in triplicate using the TaqMan MicroRNA assays kit (Applied Biosystems) according to the manufacturer's instructions in an Applied Biosystems 7900HT Fast Real-Time polymerase chain reaction apparatus. To normalize for differences in the amount of total input DNA, amplification at a reference protein-coding gene (Actin) was performed once per plate in triplicate for each individual DNA. Amplification of RNU19 was used for normalization of miRNA expression. The data analysis was done using the SDS (Sequence Detection Systems), Version 2.2.2 program (Applied Biosystems). Additional primer sets (TaqMan probes; Applied Biosystems) were used to amplify deregulated mRNAs or miRNAs in triplicate on the ABI 7900HT instrument (Applied Biosystems). Differences in gene expression were estimated using Student t tests.
Protein lysates were obtained as reported previously.18 Proteins were transferred to nitrocellulose membranes (Bio-Rad) and probed with antibodies against the following proteins: Myc (Sigma-Aldrich), Mcm2 and Mcm4 (a gift of Juan Méndez, CNIO), Rcc1 (Nventa Biopharmaceuticals), p27Kip1 (BD Biosciences), Mad2 (Marine Biologica Laboratory), and Bcl2, cyclin B1, and Cdk4 (Santa Cruz Biotechnology). In addition, antiactin or antitubulin antibodies (Sigma-Aldrich) were used as a loading control. After washing, blots were incubated with the appropriate secondary antibodies coupled to AlexaFluor 680 and 800 (Invitrogen). Subsequently, the membrane was scanned in Odyssey Infrared Imaging System (Li-Cor Biosciences).
Cell culture, transfections, and reporter assays
Jurkat and MOLT-4 (T-cell lymphoblastic lymphoma) and Raji (BL) cells were obtained from the ATCC. These cells were transfected using the Amaxa nucleofection apparatus following the manufacturer's recommendations. Luciferase assays were performed as described previously.18 The Renilla luciferase, green fluorescent protein, or small RNAs labeled with red fluorescent protein (sigloRed; Dharmacon RNA Technologies) were used to normalize the expression values among different transfections. The 3′-UTRs of mouse and human Myc were cloned in pGL vectors downstream of the luciferase gene. Several mutants to alter the miRNA target sites were obtained using the mutagenesis kit from Stratagene. Most mutants were designed to alter 3 positions in the seed sequence of the target site (mutant sequences and oligonucleotides are available on request). miRNA genes were expressed using the pMirVec vector.26
Results
mRNA and miRNA expression profiles in murine lymphomas
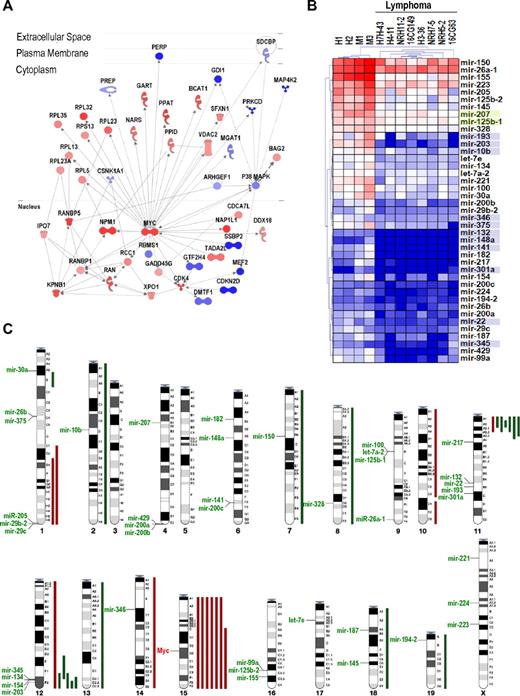
To understand the molecular alterations underlying lymphoma development in γ-irradiated mice, we first analyzed mRNA expression profiles in 15 of these tumors (supplemental Data). Mouse γ-irradiation-induced lymphomas overexpress critical oncogenes, such as Myc, as well as growth factor and chemokine signaling molecules, cell cycle regulatory proteins, DNA replication markers, mitotic proteins, translation initiation factors, and ribosomal genes (Figure 1A, supplemental Figure 1; supplemental Table 1). Down-regulated molecules include histocompatibility proteins and lymphocyte differentiation proteins, as well as cell cycle inhibitory proteins and apoptotic markers. Some of these genes are targets of master transcription factors deregulated in these tumors. Thus, whereas Myc targets represent 6.8% (923 of 13 763) of the genes in the array, 98 (17.6%) of the 556 significantly up-regulated transcripts are bona-fide Myc targets, as defined by Zeller et al,24 suggesting a significant enrichment (P < .0001) of up-regulated Myc targets in these γ-irradiated lymphomas. The deregulation of Myc (both at the mRNA and protein levels; Figure 1 and supplemental Figure 1) and Myc targets is a predominant hallmark in the transcriptional alterations in proliferative, apoptotic, and lymphocyte differentiation pathways (Figure 1A; supplemental Data).
General overview of the transcriptional and genetic alterations in γ-irradiation-induced lymphomas. (A) Myc is a central node in the molecular interactions between up-regulated (red) or down-regulated (blue) proteins, including cell cycle regulators (Cdk or Ran pathways), protein synthesis molecules (Rpl and Rps proteins), and other signaling cascades. (See also supplemental Data for further details.) (B) Transcriptional profiling of miRNAs in normal thymuses (H1, H2, M1, and M3) or T-cell lymphomas. Unsupervised clustering of these data clearly discriminates normal thymuses vs tumor samples. Only significantly deregulated miRNA genes are shown. Blue shadows in miRNA names indicate the presence of a CpG island upstream of the corresponding human or mouse miRNA genes. Green shadows indicate that the CpG island is only present in the mouse sequence. (C) Summary from the comparative genome hybridization analysis of γ-irradiation-induced T-cell lymphomas showing the chromosomal position of down-regulated miRNA genes. Major DNA losses (green bars) and gains (red bars) are indicated to the right of the corresponding chromosomes. The location of Myc in chromosome 15 is also indicated.
General overview of the transcriptional and genetic alterations in γ-irradiation-induced lymphomas. (A) Myc is a central node in the molecular interactions between up-regulated (red) or down-regulated (blue) proteins, including cell cycle regulators (Cdk or Ran pathways), protein synthesis molecules (Rpl and Rps proteins), and other signaling cascades. (See also supplemental Data for further details.) (B) Transcriptional profiling of miRNAs in normal thymuses (H1, H2, M1, and M3) or T-cell lymphomas. Unsupervised clustering of these data clearly discriminates normal thymuses vs tumor samples. Only significantly deregulated miRNA genes are shown. Blue shadows in miRNA names indicate the presence of a CpG island upstream of the corresponding human or mouse miRNA genes. Green shadows indicate that the CpG island is only present in the mouse sequence. (C) Summary from the comparative genome hybridization analysis of γ-irradiation-induced T-cell lymphomas showing the chromosomal position of down-regulated miRNA genes. Major DNA losses (green bars) and gains (red bars) are indicated to the right of the corresponding chromosomes. The location of Myc in chromosome 15 is also indicated.
We then analyzed the miRNA transcriptional profile in these γ-irradiation-induced lymphomas. Forty-one miRNA genes displayed a significant reduction in their expression levels in these tumors (FDR < 0.01; Figure 1B). No miRNA was found overexpressed in these tumors under similar statistical significance. The expression of several of these down-regulated miRNAs was validated using real-time quantitative reverse-transcribed polymerase chain reaction (supplemental Figure 1). Some of these miRNAs have been reported to have tumor suppressor activity. Thus, the let-7 family down-regulates Ras,27 a major oncogene in this malignancy, and miR-203 suppresses lymphomas and leukemias by inhibiting Abl1.18 miR-223 negatively regulates proliferation of hematopoietic progenitors,28 and it is repressed in hepatocellular carcinomas.29 A translocation in specific leukemias is likely to inactivate miR-125b-1, suggesting its tumor suppressor function.30
Genetic and transcriptional alteration of miRNAs
We first analyzed DNA copy number (by comparative genome hybridization in 12 tumor samples) to test whether miRNA down-regulation could be the result of specific chromosomal aberrations. Trisomy of chromosome 15 or amplification of the Myc locus in this chromosome occurs in 7 samples (58% of γ-irradiated tumors; Figure 1C). Consistent DNA losses were observed in the centromeric region of chromosome 11 (6 samples; 50% of γ-irradiated tumors) and the telomeric end of chromosome 12 (5 tumors; 42%). Some of these chromosome alterations are in agreement with previous results.31 Although some candidate genes have been suggested, the major target genes in these regions are mostly unknown. A combined analysis of comparative genome hybridization and cDNA expression patterns suggest that Znfn1a1 (also known as Ikaros) may be a candidate gene in the chromosome 11 deletion because it is the only gene down-regulated in this region (data not shown). The target gene in the deleted telomeric region in chromosome 12 is less obvious as 3 different genes in this region, Bcl11B, Siva, and Crip2, are down-regulated at the mRNA level. However, none of these genes is silenced by promoter hypermethylation (data not shown), and the molecular mechanism behind the decreased expression of these genes is unknown at present. This region also contains a high density of miRNA genes, and we have recently reported that one of them, mir-203, is methylated in several mouse and human leukemias and behaves as a tumor suppressor miRNA in these malignancies.18 Apart from the chromosome 12 miRNAs, all the other miRNAs down-regulated in these lymphomas are not preferentially located to DNA regions with frequent loss of heterozygosity (Figure 1C).
Although the transcriptional control of miRNAs is not well understood yet, a few transcription factors, such as E2F1,3, may modulate miRNA expression.32,33 In addition, Myc has been shown to induce the oncogenic mir-17–92 cluster34 and results in the repression of a significant number of miRNAs.19 Indeed, some known Myc target miRNAs, such as miR-125b or miR-150, are down-regulated in K562 leukemic cells expressing a Myc-ER fusion gene inducible by tamoxifen (supplemental Figure 2), confirming that some of the miRNAs down-regulated in mouse and human lymphomas are Myc targets. Because Myc is highly overexpressed in these lymphomas, the observed down-regulation of several Myc targets, including mir-150, mir-22, mir-26a-1, and mir-26b, and the miRNA clusters mir-100–125b-1, mir-99a-125b-2, and mir-29b-2–29c, is likely to be a consequence of increased Myc signaling in these tumors. All together, these observations suggest that a combination of genetic or epigenetic alterations may mediate the loss of certain miRNAs, such as miR-203,18 and many other miRNAs may be repressed by specific oncogenic transcription factors, such as Myc.
Correlation between miRNA down-regulation and target gene overexpression
Because each miRNA can target multiple genes in the genome, we reasoned that the down-regulation of these 41 miRNA genes in T-cell lymphomas might have important consequences in tumor transcriptional profiles. With a few exceptions (miR-200b, miR-203, miR-429, and miR-205), the set of targets of each individual miRNA was not significantly enriched in overexpressed genes. However, the set of 41 miRNA genes silenced, when considered as a whole, displayed a more dramatic effect on the transcriptome of T-cell lymphomas because the targets of these miRNAs were significantly over-represented in up-regulated genes (supplemental Table 2). Whereas 40.6% of the genes in the array (4997 of 12 322) are putative targets of the 41 miRNAs down-regulated, these targets represent 46.3% (258 of 557) in the subset of overexpressed genes (P = .0001).
We next analyzed which genes were most likely to benefit from the combined down-regulation of several miRNA genes. All the putative genetic interactions (GIs; number of tumor-down-regulated miRNA genes that can potentially target specific sequences in the 3′-UTRs of the protein-coding gene indicated) between the 557 up-regulated genes and the 41 down-regulated miRNA genes were obtained from the miRBase Targets, Version 5 database. Several up-regulated genes were predicted to be targeted by more than one of these miRNAs. Interestingly, Myc was the gene with the highest number of target sites for different down-regulated miRNA genes (Figure 2). Despite its relatively small size, the 3′-UTR of the murine Myc transcript (453 nt; approximately half of the average 3′-UTR size in the genome) is potentially targeted by 13 different miRNA genes silenced in these T-cell lymphomas (32% of the down-regulated miRNA genes). In addition to Myc, additional overexpressed genes controlled by multiple miRNA genes included Ncor2 (11 GI), Fkbp3 (10 GI), Cad, Grwd1, and Rrp12 (9 GI), as well as other genes with a reduced number (≤ 8 GI) of mRNA-miRNA gene interactions.
GIs between overexpressed genes and down-regulated miRNA genes. GIs are defined as the number of down-regulated miRNA genes that can potentially target specific sequences in all possible 3′-UTRs of the overexpressed gene indicated. (See supplemental Data for further details.) Myc is the overexpressed gene with the highest number of GIs in γ-irradiation-induced T-cell lymphomas. Thirteen of the 41 miRNA genes down-regulated in these tumors can potentially target the Myc 3′-UTR. Other genes potentially targeted by multiple miRNAs, such as Ncor2 (11 GI) and Kkbp3 (10 GI), are indicated in the figure. Only genes up-regulated in irradiation-induced lymphomas with more than or equal to 7 GI are represented.
GIs between overexpressed genes and down-regulated miRNA genes. GIs are defined as the number of down-regulated miRNA genes that can potentially target specific sequences in all possible 3′-UTRs of the overexpressed gene indicated. (See supplemental Data for further details.) Myc is the overexpressed gene with the highest number of GIs in γ-irradiation-induced T-cell lymphomas. Thirteen of the 41 miRNA genes down-regulated in these tumors can potentially target the Myc 3′-UTR. Other genes potentially targeted by multiple miRNAs, such as Ncor2 (11 GI) and Kkbp3 (10 GI), are indicated in the figure. Only genes up-regulated in irradiation-induced lymphomas with more than or equal to 7 GI are represented.
Individual and combinatorial effects of miRNAs on Myc expression
To directly evaluate the regulation of Myc by miRNAs, we tested the ability of several of the down-regulated miRNAs to repress Myc. The regulation of Myc by miR-145 has been reported in detail previously35 and is not further analyzed here. Twelve different additional miRNAs putatively targeting Myc were used to analyze their effect on Myc sequences (Figure 3). In addition, we also used the mir-148b gene, which is not silenced in these tumors but expresses a miR-148b mature sequence highly similar to that of miR-148a but with one mismatch. As additional controls, we used 2 miRNA genes, mir-200c and mir-101, which are not predicted to target the murine Myc sequence and are down-regulated or unaltered, respectively, in the T-cell tumors analyzed.
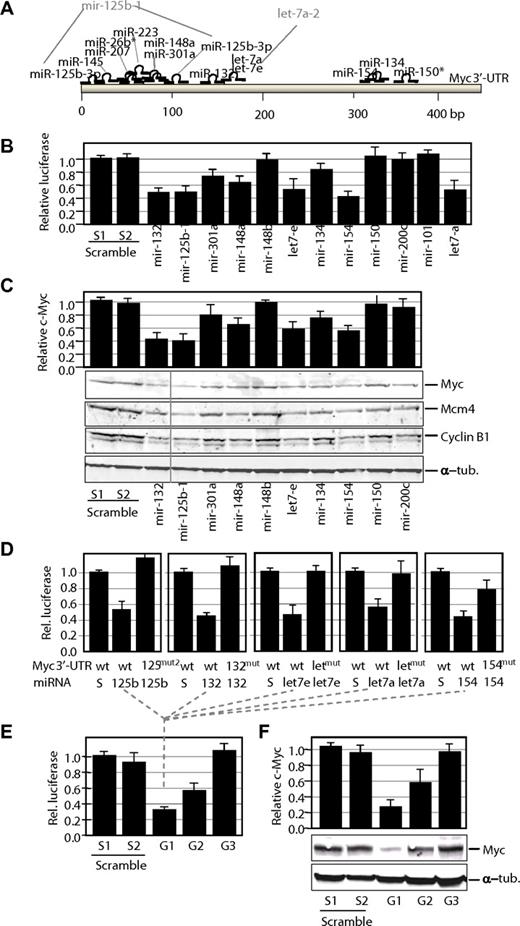
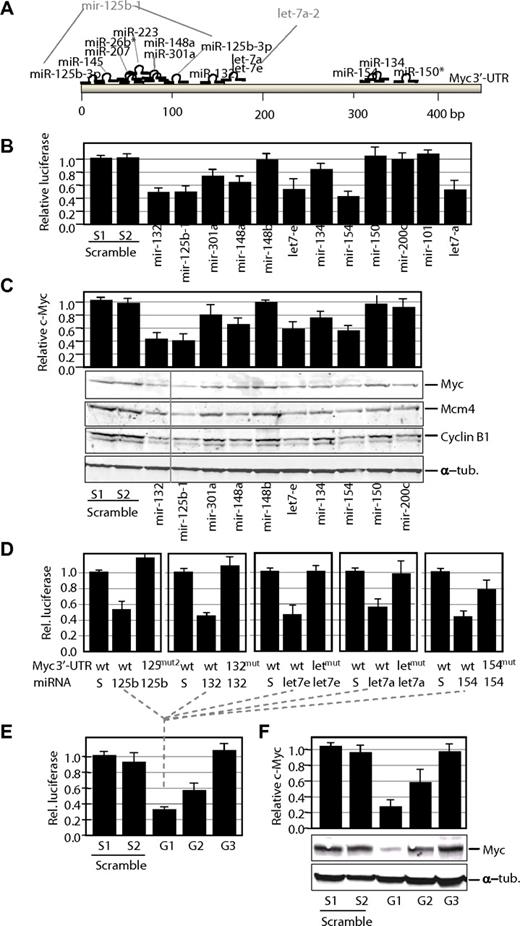
Control of Myc expression by miRNAs. (A) Potential target sites for mature miRNAs in the mouse Myc 3′-UTR. Only mature miRNAs produced by miRNA genes down-regulated in γ-irradiation-induced lymphomas are shown in this scheme. Gene nomenclature is also indicated when different from the mature form (eg, mir-125b-1 is the gene that generates miR-125–3p). (B) Luciferase activity of a reporter construct carrying the Myc 3′-UTR downstream of the luciferase gene. The construct was cotransfected with a vector expressing each of the indicated miRNA precursors. All data are normalized versus the luciferase levels generated by scramble sequences. (C) Effect of miRNA genes on Myc protein levels. Transfection with miRNA genes was performed as described earlier in the Figure 3 legend, but cells were processed for immunoblot analysis for Myc or 2 different Myc targets, Mcm4 and Cyclin B1. A vertical line has been inserted to indicate repositioned gel lanes. The relative levels of Myc proteins were normalized using α-tubulin (α-tub.) as a loading control. (D) Luciferase activity of wild-type (wt) or mutant (mut) Myc 3′-UTRs in the presence of scrambled sequences (S) or the corresponding miRNAs. wt, indicates wild-type Myc 3′-UTR sequence; mut, single mutants for the indicated miRNA; and mut2, double mutant for the miR-125b-3p target sites. (E) Luciferase assays of wild-type Myc 3′-UTRs in the presence of pools of group 1 (G1; mir-132, mir-125b-1, let-7e, let-7-a, and mir-154), group 2 (G2; mir-301a, mir-148a, and mir-134), or group 3 (G3; mir-26b, mir-150, mir-207, and mir-223) miRNAs. In these pools, the sum of all miRNA vectors also equals 10 μg as in the scramble vectors or the previous assays. (F) Effect of G1–3 pools on Myc protein levels. Transfection with miRNA genes was performed as described earlier in the Figure 3 legend, but cells were processed for immunoblot analysis for Myc. The relative levels of Myc proteins were normalized using α-tubulin (α-tub.) as a loading control.
Control of Myc expression by miRNAs. (A) Potential target sites for mature miRNAs in the mouse Myc 3′-UTR. Only mature miRNAs produced by miRNA genes down-regulated in γ-irradiation-induced lymphomas are shown in this scheme. Gene nomenclature is also indicated when different from the mature form (eg, mir-125b-1 is the gene that generates miR-125–3p). (B) Luciferase activity of a reporter construct carrying the Myc 3′-UTR downstream of the luciferase gene. The construct was cotransfected with a vector expressing each of the indicated miRNA precursors. All data are normalized versus the luciferase levels generated by scramble sequences. (C) Effect of miRNA genes on Myc protein levels. Transfection with miRNA genes was performed as described earlier in the Figure 3 legend, but cells were processed for immunoblot analysis for Myc or 2 different Myc targets, Mcm4 and Cyclin B1. A vertical line has been inserted to indicate repositioned gel lanes. The relative levels of Myc proteins were normalized using α-tubulin (α-tub.) as a loading control. (D) Luciferase activity of wild-type (wt) or mutant (mut) Myc 3′-UTRs in the presence of scrambled sequences (S) or the corresponding miRNAs. wt, indicates wild-type Myc 3′-UTR sequence; mut, single mutants for the indicated miRNA; and mut2, double mutant for the miR-125b-3p target sites. (E) Luciferase assays of wild-type Myc 3′-UTRs in the presence of pools of group 1 (G1; mir-132, mir-125b-1, let-7e, let-7-a, and mir-154), group 2 (G2; mir-301a, mir-148a, and mir-134), or group 3 (G3; mir-26b, mir-150, mir-207, and mir-223) miRNAs. In these pools, the sum of all miRNA vectors also equals 10 μg as in the scramble vectors or the previous assays. (F) Effect of G1–3 pools on Myc protein levels. Transfection with miRNA genes was performed as described earlier in the Figure 3 legend, but cells were processed for immunoblot analysis for Myc. The relative levels of Myc proteins were normalized using α-tubulin (α-tub.) as a loading control.
We first studied the effect of these miRNAs using the murine Myc 3′-UTR cloned downstream of a luciferase reporter. As shown in Figure 3B, 5 miRNA genes, including mir-132, mir-125b-1, let-7e, let-7a, and mir-154, were highly efficient down-regulating luciferase expression in the luc-Myc-3′-UTR construct. Because let-7 miRNAs have been previously reported to target Myc,36,37 we consider the miRNAs in this group (group 1) as highly efficient down-regulators of Myc. In addition, mir-301a, mir-148a, and mir-134 (group 2) displayed an intermediate but consistent effect, whereas mir-150 (Figure 3B), mir-26b, mir-207, and mir-223 (not shown) did not have any significant effect. Similarly, the control vectors expressing mir-148b, mir-200c, or mir-101 did not have any effect on the luciferase signal. To additionally test the effect of these miRNAs on Myc expression, the Myc protein levels were quantified by immunoblotting after transient expression of the individual miRNAs. As shown in Figure 3C, several of these miRNA genes, including mir-132, mir-125b-1, and mir-154, were able to significantly down-regulate Myc expression even stronger than the validated let-7 miRNAs. The reduction in Myc protein levels correlated with a significant decrease in the proliferation rate of Jurkat cells, suggesting a tumor suppressor activity for many of these miRNAs in leukemia cells (supplemental Figure 3). Some miRNAs displayed a dramatic antiproliferative effect despite its minimal effect of Myc protein levels, suggesting additional critical targets for its antiproliferative function. In general, the down-regulation of Myc by miRNAs (mostly group 1) correlated with the down-regulation of Myc target genes, such as Mcm4 or Cyclin B1 (Figure 3C), in agreement with a functional inactivation of Myc transcriptional targets in response to these miRNAs.
To further validate the direct control of Myc by group 1 miRNAs, we performed individual mutagenesis of miRNA target sites in the Myc 3′-UTR. The predicted miR-132, let-7, and miR-154 target sites were mutated by substituting 3 different nucleotides in each corresponding seed sequences. In addition, a double miR-125b mutant was obtained by mutating the 2 predicted target sites for this miRNA. As indicated in Figure 3D, expression of individual group 1 miRNAs reduced luciferase activity in wild-type Myc 3′-UTR but not on mutation of the corresponding target sites, suggesting direct down-regulation by miRNAs through these sequences.
We also went to analyze the combined effect of several of these miRNAs in controlling luciferase expression or Myc protein levels. Different pools of miRNAs belonging to group 1 (efficient targeting), group 2 (intermediate effect), and group 3 (miRNAs with no effect on Myc) were prepared. Cotransfection with the group 1 pool resulted in a slightly stronger reduction of luciferase activity (Figure 3E) and Myc protein levels (Figure 3F), although this effect may be limited by technical constraints of these assays (transfection efficiency or saturation of overexpressed miRNAs). Group 2 pools also displayed a stronger effect than individual group 2 miRNAs both in the luciferase assays and in the levels of Myc proteins. No effect was observed in the group 3 pools in agreement with the lack of effect of these individual miRNAs on Myc expression.
Combined down-regulation of MYC-targeting miRNAs in human BL
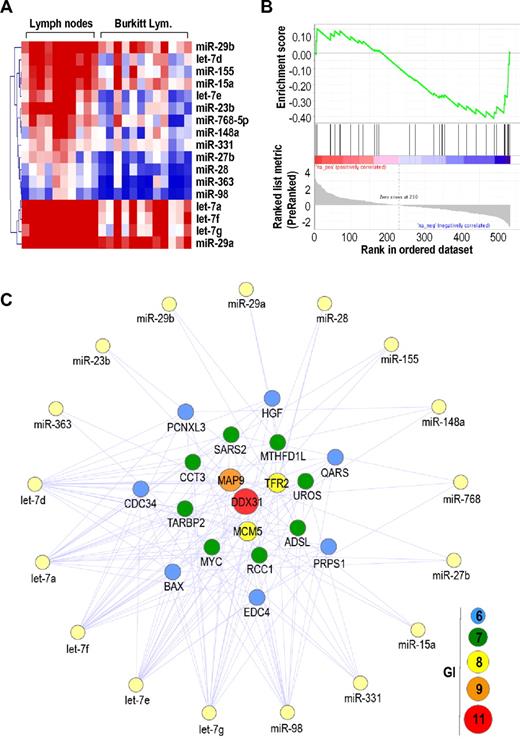
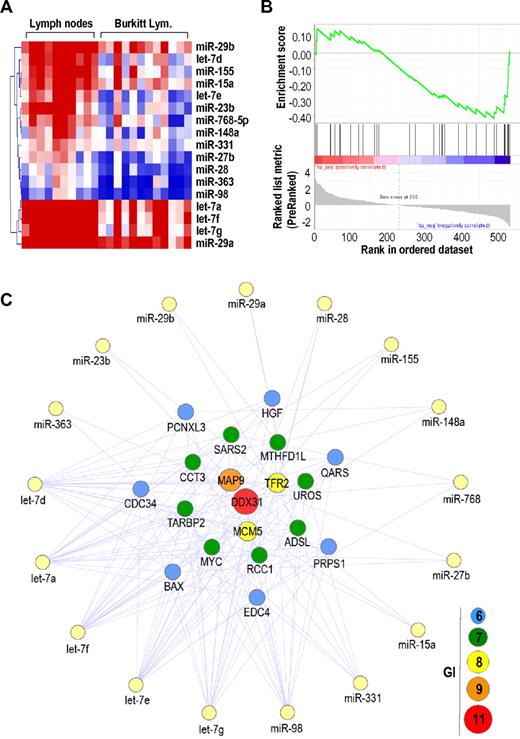
To validate the strong correlation between deregulation of Myc and miRNAs levels in humans, we studied cDNA and miRNA expression profiles in BL, a human pathology mediated by specific genetic translocations that lead to overexpression of MYC. In most BL cases, a reciprocal translocation has moved the proto-oncogene MYC from its normal position on chromosome 8 to a location downstream to the enhancers of the antibody heavy chain genes on chromosome 14. These translocated MYC oncogenes maintain the endogenous MYC 3′-UTR and are therefore sensitive to miRNAs. Because the expression of miRNAs has not been reported in detail in these tumors, we analyzed the expression profiles of protein-coding genes and miRNAs in the same 12 BL samples compared with normal lymph nodes (Figure 4; supplemental Figure 4) or normal CD10+CD19+ B cells (supplemental Figure 5). These BL samples displayed the t(8;14)(q24;q32) translocation (data not shown) that is likely to enhance the transcription of MYC. Gene expression profiling analysis confirmed a significant up-regulation of MYC (FDR < 0.01) in these BL samples (data not shown). In addition, 43 miRNAs were deregulated (FDR < 0.01) in these BLs compared with normal lymph nodes, including 26 up-regulated (including the known oncogenic cluster mir-17–92; supplemental Figure 4) and 17 down-regulated miRNAs (Figure 4A). We then applied GSEA using MYC-targeting miRNAs list (as predicted by miRBase) as a gene set. GSEA revealed a significant enrichment (FDR < 0.085) of the MYC-targeting miRNAs in control samples compared with BLs (Figure 4B), thus suggesting a BL-specific down-regulation of miRNAs that can potentially target the MYC mRNA.
Genetic interactions between protein-coding genes and miRNAs in BL. (A) Heat map of significantly down-regulated miRNAs in BL compared with normal lymph nodes. (B) GSEA for down-regulated miRNAs targeting the MYC 3′-UTR. (C) Genetic interactions (GI) between up-regulated protein-coding genes and down-regulated miRNAs in BL. Only protein-coding genes with GI ≥ 6 are shown.
Genetic interactions between protein-coding genes and miRNAs in BL. (A) Heat map of significantly down-regulated miRNAs in BL compared with normal lymph nodes. (B) GSEA for down-regulated miRNAs targeting the MYC 3′-UTR. (C) Genetic interactions (GI) between up-regulated protein-coding genes and down-regulated miRNAs in BL. Only protein-coding genes with GI ≥ 6 are shown.
We then mapped GI between up-regulated protein-coding genes (1219 genes) and down-regulated miRNAs (17 miRNAs) in the same 12 BL samples. As shown in Figure 4C, MYC was one of the most common targets (7 GI) of down-regulated miRNAs in these tumors, along other overexpressed genes, such as DDX31 (11 GI), MAP9 (9 GI), and TFR2 (8 GI), or the replication protein MCM5 (8 GI). Other genes with multiple target sites for silenced miRNAs included CDC34, an ubiquitin-conjugating enzyme known to be modulated by let-7.38 We also compared the expression of miRNAs of BLs versus normal B cells expressing CD19 and CD10, 2 markers of the normal germinal centers that are also expressed in BL.39,40 A total of 33 miRNAs were deregulated in BLs using a comparison similar to CD19+CD10+ cells, including 11 up-regulated and 22 down-regulated miRNAs (supplemental Figure 5). Common targets of these down-regulated miRNAs also included DDX31 and MAP9 (8 GI), MCM5 (6 GI), or MYC (5 GI), among other overexpressed genes (supplemental Figure 5). These findings indicate that preferential down-regulation of MYC-targeting miRNAs probably supports the high expression levels of MYC transcripts as a consequence of genetic translocation in human BL.
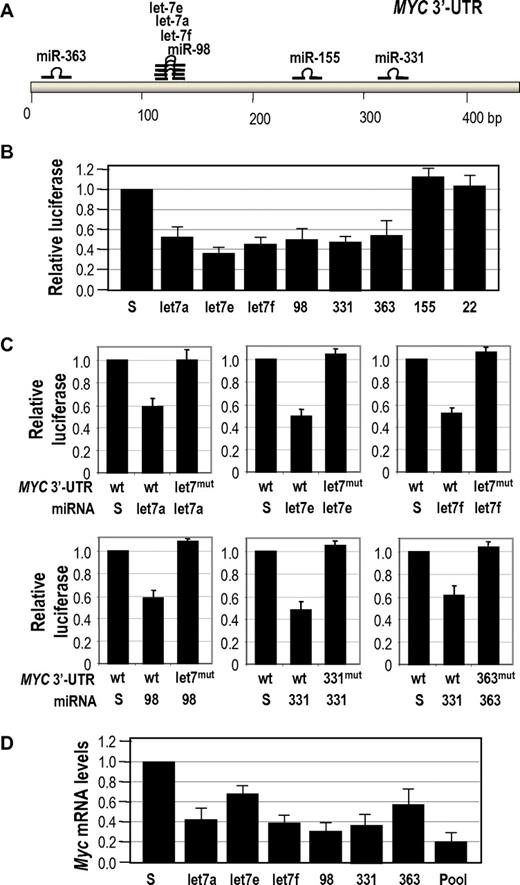
Because the human MYC 3′-UTR only displays a moderate conservation with the mouse sequence, we then validated the control of human MYC by miRNAs down-regulated in BLs. Figure 5A shows the localization of target sites for BL-specific down-regulated miRNAs in the human MYC 3′-UTR. As shown in Figure 5B, all these miRNAs, with the only exception of miR-155, were able to down-regulate the MYC 3′-UTR in reporter assays. In all these 6 cases, a specific mutation in the miRNA target site rescued this repression, suggesting the specificity in this interaction (Figure 5C). Moreover, all these 6 miRNAs were able to down-regulate MYC transcripts when overexpressed in the human BL cell line Raji. This down-regulation is even stronger when a pool of these 6 miRNAs (using a total amount of miRNA DNA similar to the individual transfections) was used (Figure 5D).
Control of human MYC by multiple miRNAs. (A) Schematic representation of the human MYC 3′-UTR and the localization of target sites for the miRNAs down-regulated in BLs. (B) Luciferase reporter assays to test the effect of the indicated miRNAs in the MYC 3′-UTR. Vectors expressing scrambled sequences (S) or mir-22 (not predicted to target MYC) were used as controls. (C) Mutagenesis of miRNA target sites in the human MYC 3′-UTR. Luciferase activity in the presence of the wild-type (wt) or a mutated (mut) MYC 3′-UTR in which 3 positions of the seed sequence have been mutated for each specific miRNA target site indicated. These constructs were assayed in the presence of vectors expressing the indicated miRNAs or scrambled sequences. (D) Effect of the indicated miRNAs in the protein levels of MYC in Raji BL cells. The pool contains an equimolar mixture of all indicated miRNAs in which the sum of all these miRNAs equals 10 μg as in the scramble vectors or the previous assays.
Control of human MYC by multiple miRNAs. (A) Schematic representation of the human MYC 3′-UTR and the localization of target sites for the miRNAs down-regulated in BLs. (B) Luciferase reporter assays to test the effect of the indicated miRNAs in the MYC 3′-UTR. Vectors expressing scrambled sequences (S) or mir-22 (not predicted to target MYC) were used as controls. (C) Mutagenesis of miRNA target sites in the human MYC 3′-UTR. Luciferase activity in the presence of the wild-type (wt) or a mutated (mut) MYC 3′-UTR in which 3 positions of the seed sequence have been mutated for each specific miRNA target site indicated. These constructs were assayed in the presence of vectors expressing the indicated miRNAs or scrambled sequences. (D) Effect of the indicated miRNAs in the protein levels of MYC in Raji BL cells. The pool contains an equimolar mixture of all indicated miRNAs in which the sum of all these miRNAs equals 10 μg as in the scramble vectors or the previous assays.
The Myc pathway is a significant target of miRNAs down-regulated in lymphomas
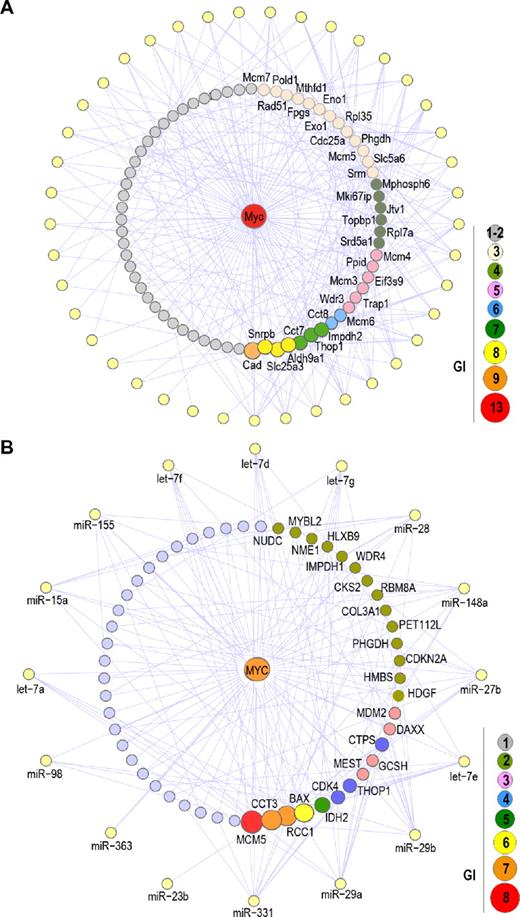
The combined effect of down-regulated miRNAs on Myc activity can contribute to the induction of Myc targets and the corresponding downstream pathways in murine and human lymphomas. In both murine and human tumors, there is a significant enrichment of Myc targets among up-regulated genes. As reported in the first section of the “Results,” Myc targets were overrepresented among up-regulated genes in γ-irradiation-induced tumors. Similarly, 135 Myc targets were included among the 1219 up-regulated genes (11.1%) in BLs versus 949 Myc targets in the 16 203 genes (5.8%) represented in the array (P < .0001). In addition, the set of up-regulated Myc targets was significantly enriched in target sites for down-regulated miRNAs. In murine tumors, 75 of 98 up-regulated Myc target genes (76.5%) can be potentially down-regulated by the silenced miRNA genes (Figure 6A), whereas the corresponding frequency for up-regulated non-Myc targets is 43.9% (207 of 481; P < .0001). Similarly, 63.7% (86 of 135) of up-regulated Myc targets were predicted targets of silenced miRNAs in BLs versus 39.9% (433 of 1084) of non-Myc targets (P < .0001; Figure 6B). As an example, mouse Cad, Snrp, Slc25a3, Aldh9a1, as well as human MCM5, CCT3, BAX, or RCC1 were among the Myc target genes with a highest number of predicted target sites for down-regulated miRNAs (supplemental Table 3). Thus, the combined effect of Myc overexpression and amplification (Figure 1), down-regulation of miRNAs that control Myc levels in mouse (Figures 2–3) and humans (Figures 4–5; supplemental Figure 5), and down-regulation of miRNAs that control Myc target levels (Figure 6) is likely to have a significant effect in the Myc oncogenic pathways in murine γ-irradiation-induced or human BLs.
Significant effect of mouse or human down-regulated miRNAs on Myc targets. (A) GIs between Myc target genes and down-regulated miRNA genes in mouse irradiation-induced lymphomas. Peripheral yellow nodes represent down-regulated miRNA genes (as in Figure 2), whereas Myc targets are distributed as a circle around Myc (the interaction between Myc and Myc targets is not shown for clarity). A total of 72 Myc targets are potentially targeted by down-regulated miRNA genes, and only genes with more than or equal to 3 GI are shown. A complete list of these interactions is provided in the Supplemental data. (B) Similar analysis of the GI between MYC target genes and down-regulated miRNAs in BLs. Peripheral yellow nodes represent down-regulated miRNA genes (as in Figure 7), whereas MYC targets are distributed as a circle around MYC.
Significant effect of mouse or human down-regulated miRNAs on Myc targets. (A) GIs between Myc target genes and down-regulated miRNA genes in mouse irradiation-induced lymphomas. Peripheral yellow nodes represent down-regulated miRNA genes (as in Figure 2), whereas Myc targets are distributed as a circle around Myc (the interaction between Myc and Myc targets is not shown for clarity). A total of 72 Myc targets are potentially targeted by down-regulated miRNA genes, and only genes with more than or equal to 3 GI are shown. A complete list of these interactions is provided in the Supplemental data. (B) Similar analysis of the GI between MYC target genes and down-regulated miRNAs in BLs. Peripheral yellow nodes represent down-regulated miRNA genes (as in Figure 7), whereas MYC targets are distributed as a circle around MYC.
Discussion
In mammals, miRNAs are predicted to control the activity of a significant fraction of all protein-coding genes.41,42 The sets of 41 miRNAs down-regulated in γ-irradiation-induced lymphomas (Figure 1) and 17 miRNAs down-regulated in BLs (Figure 4) are predicted to target approximately 46% (256 of 556) or 43% (519 of 1219), respectively, of the up-regulated genes in these lymphomas, suggesting that miRNA deregulation may have a significant impact in tumor transcription profiles. The analysis of the major targets of these miRNAs indicates that some genes may be repeatedly targeted by several different miRNAs. Interestingly, Myc, a major oncogene in these tumors,8,17 stands up as the gene in which lack of expression of miRNAs may have the highest influence in γ-irradiation-induced tumors and one of the major targets in BLs. Thus, the silencing of approximately one-third of the miRNA genes down-regulated in these murine or human tumors may help to accumulate Myc proteins. Whereas the sets of miRNA targets may vary using different algorithms, the enrichment of target sequences for down-regulated miRNAs is commonly found in different algorithms, and several of these target sequences have been validated through reporter and mutagenesis assays. Several of these miRNAs, including miR-132, miR-125b-1, let-7 family, and miR-154 are able to decrease Myc levels and the proliferative potential of tumor cells.
Because tumor samples were compared with normal age-matched thymuses or lymph nodes, these results may also indicate that these miRNAs help to maintain low levels of Myc proteins in adult quiescent differentiated cells compared with other proliferative stages. In any case, given the major role of the Myc transcription factor in driving leukemogenesis,43 it is not surprising that tumors select cells with inactivation of several of the miRNAs that may decrease Myc levels. In addition, proliferating cells frequently express mRNAs with shortened 3′-UTRs and fewer miRNA sites, suggesting the relevance of avoiding miRNA function in cell proliferation.44 We have failed to detect point mutations in the MYC 3′-UTR of human lymphoma patients (N = 38; data not shown). However, given the number of miRNA target sites in that sequence, it is possible that a single point mutation does not confer enough resistance to the combined effect of all miRNAs targeting MYC in these cells. Thus, tumor cells preferentially down-regulate inhibitory miRNAs instead of selecting individual or multiple mutations in the MYC 3′-UTR.
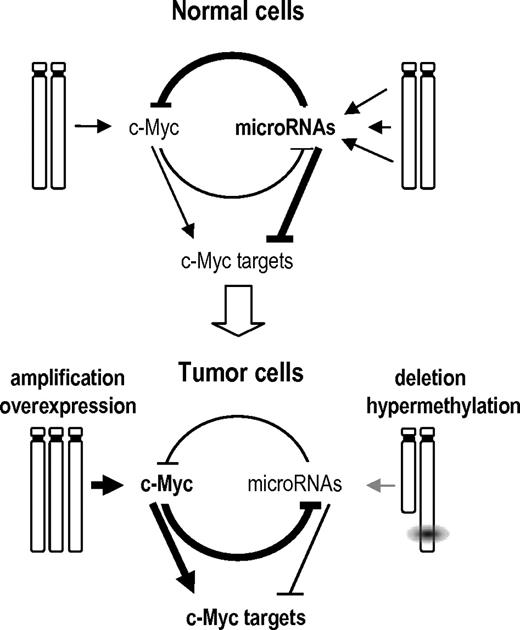
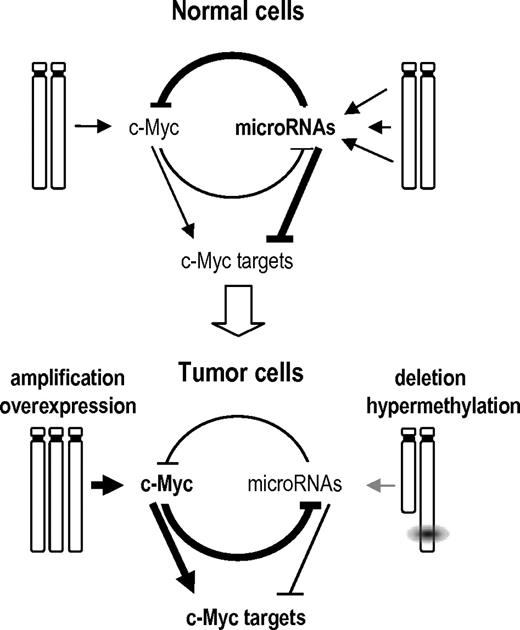
Myc up-regulates many molecular routes crucial for malignant transformation, including cell survival, proliferation, and translation pathways.24 Myc is also known to specifically induce the oncogenic mir-17–92 cluster,34 and several miRNAs expressed in this cluster are up-regulated in BL (supplemental Figure 4). However, the predominant consequence of Myc activation in miRNA biology is thought to be a widespread miRNA repression as recently reported.19,45 In γ-irradiation-induced or BLs, several silenced miRNAs, including miR-15a, miR-22, miR-23b, miR-125b, miR-150*, miR-26a, or miR-26b, miR-29a, and miR-29b, and several let-7 family members may be repressed as a consequence of Myc signaling.19,45 Interestingly, some of the silenced miRNAs also have the potential to target the Myc transcript, suggesting regulatory loops between Myc and miRNAs (supplemental Figure 6). It has been also previously reported that let-7a down-regulates Myc and reverts Myc-induced growth in BL cells.36 Thus, the inactivation of several of these miRNAs enhances Myc overexpression, which in some cases is originated by trisomy of chromosome 15 (mouse lymphomas) or specific translocations (human neoplasias). Tumor-suppressor miRNAs that are not the target of chromosomal deletions or epigenetic modifications may be directly repressed by Myc in a feedback loop that enhances Myc protein levels and favors malignant transformation (Figure 7). Because a threshold level of c-Myc expression is required to maintain the neoplastic state in Myc-driven tumors,46 these regulatory loops suggest a bidirectional mechanism to regulate the balance between the Myc pathway and miRNA regulation in normal and tumor cells.
A model of the GIs between Myc, its targets, and miRNAs in normal and tumor cells. In normal cells, multiple miRNAs are expressed that can repress Myc or Myc targets. miRNA genes are not repressed by Myc because of the low levels of Myc signaling in normal cells. Tumor cells acquire diverse genetic or epigenetic alterations that result in the overexpresssion of Myc and Myc targets to facilitate tumor development through diverse cellular processes. On one hand, Myc can be amplified and overexpressed. On the other hand, miRNAs are silenced by genetic (loss of heterozygosity), epigenetic (hypermethylation), or regulatory (repression by Myc) mechanisms. Because of the low levels of these miRNAs, signaling by Myc and Myc targets is enhanced resulting in dramatic deregulation of the cell cycle, protein translation, and metabolism among other cellular processes. This model is mostly based on the results obtained by Chang et al19 on the repression of miRNAs by Myc and the control of Myc by miRNAs reported here.
A model of the GIs between Myc, its targets, and miRNAs in normal and tumor cells. In normal cells, multiple miRNAs are expressed that can repress Myc or Myc targets. miRNA genes are not repressed by Myc because of the low levels of Myc signaling in normal cells. Tumor cells acquire diverse genetic or epigenetic alterations that result in the overexpresssion of Myc and Myc targets to facilitate tumor development through diverse cellular processes. On one hand, Myc can be amplified and overexpressed. On the other hand, miRNAs are silenced by genetic (loss of heterozygosity), epigenetic (hypermethylation), or regulatory (repression by Myc) mechanisms. Because of the low levels of these miRNAs, signaling by Myc and Myc targets is enhanced resulting in dramatic deregulation of the cell cycle, protein translation, and metabolism among other cellular processes. This model is mostly based on the results obtained by Chang et al19 on the repression of miRNAs by Myc and the control of Myc by miRNAs reported here.
Despite the relevant oncogenic function of Myc in several malignancies and the therapeutic value observed in genetic models,47 its complex function as a transcription factor has made it difficult to design therapeutic approaches to inhibit its activity in human tumors.48,49 The control of Myc by miRNAs may therefore add some new possibilities for the therapeutic inhibition of Myc in tumors either by reexpressing endogenous miRNAs (eg, through epigenetic drugs that restore the expression of hypermethylated miRNAs) or by introducing exogenous small RNAs that target the Myc transcript.
The online version of this article contains a data supplement.
The publication costs of this article were defrayed in part by page charge payment. Therefore, and solely to indicate this fact, this article is hereby marked “advertisement” in accordance with 18 USC section 1734.
Acknowledgments
The authors thank Susana Temiño and Lucía Barrado for technical assistance, Juan Cruz Cigudosa, and David Blesa for BACs availability and processing, and Javier León for kindly providing reagents.
M.J.B. and M.G. were supported by the Spanish Ministry of Science and Innovation (MICINN; fellowships). R.S.-M. and I.P.d.C. were supported by Juan de la Cierva and Ramón y Cajal contracts. This work was supported by the Association for International Cancer Research (08-0188), Fundación Ramón Areces, Fundación Mutua Madrileña Automovilista (M.M.), and the MICINN (SAF2009-11426, J.F.-P.; SAF2007-64571, I.P.d.C.; and SAF2009-07973, M.M.). J.F.-P. is supported by the Centro de Investigaciones Biomédicas en Red de Enfermedades Raras network from the MICINN. The Bioinformatics Unit of the CNIO is supported by the Spanish National Bioinformatics Institute (Genoma España). The Cell Division and Cancer Group of the CNIO is supported by the OncoCycle Program (Comunidad de Madrid, S-BIO-0283-2006), the OncoBIO Consolider-Ingenio 2010 Program (MICINN, CSD2007-00017), and the European Community's Seventh Framework Program (FP7/2007-2013; grant agreement HEALTH-F5-2010-241548).
Authorship
Contribution: M.J.B. performed most research assays; M.G.d.C., R.S.-M., I.P.d.C., and M.G. contributed with specific assays with mouse samples; G.G.-L., D.G.P., and M.M. performed the statistical analysis; L.D.L., S.M., N.M., and M.A.P. contributed with specific analysis of human samples; J.S. contributed vital new reagents; J.F.-P. and M.M. designed and supervised this research; and M.M. wrote the paper.
Conflict-of-interest disclosure: The authors declare no competing financial interests.
Correspondence: Marcos Malumbres, Centro Nacional de Investigaciones Oncológicas, Melchor Fernández Almagro 3, E-28029 Madrid, Spain; e-mail: malumbres@cnio.es.

