Abstract
MicroRNAs (miRNAs) regulate cell physiology by altering protein expression, but the biology of platelet miRNAs is largely unexplored. We tested whether platelet miRNA levels were associated with platelet reactivity by genome-wide profiling using platelet RNA from 19 healthy subjects. We found that human platelets express 284 miRNAs. Unsupervised hierarchical clustering of miRNA profiles resulted in 2 groups of subjects that appeared to cluster by platelet aggregation phenotypes. Seventy-four miRNAs were differentially expressed (DE) between subjects grouped according to platelet aggregation to epinephrine, a subset of which predicted the platelet reactivity response. Using whole genome mRNA expression data on these same subjects, we computationally generated a high-priority list of miRNA-mRNA pairs in which the DE platelet miRNAs had binding sites in 3′-untranslated regions of DE mRNAs, and the levels were negatively correlated. Three miRNA-mRNA pairs (miR-200b:PRKAR2B, miR-495:KLHL5, and miR-107:CLOCK) were selected from this list, and all 3 miRNAs knocked down protein expression from the target mRNA. Reduced activation from platelets lacking PRKAR2B supported these findings. In summary, (1) platelet miRNAs are able to repress expression of platelet proteins, (2) miRNA profiles are associated with and may predict platelet reactivity, and (3) bioinformatic approaches can successfully identify functional miRNAs in platelets.
Introduction
On rupture of atherosclerotic plaques, some persons form occlusive platelet thrombi whereas other persons repair the wound without occluding the vessel. The extreme interindividual variation in platelet reactivity probably contributes to the variation in both risk and clinical outcome of ischemic vascular disease because platelet hyper-reactivity has prospectively been shown to be a risk for recurrent coronary syndromes.1 Although heritability strongly influences the interindividual variation in platelet reactivity,2-4 there is a lack of understanding of the responsible genetic and molecular mechanisms. To understand better the basis for human platelet function, it is critical to define the genes that are expressed in the tissue of interest. We have previously used platelet RNA expression analyses from platelets of differing reactivity to identify differentially expressed (DE) platelet transcripts and proteins.5 During the course of our studies, we found that a DE platelet microRNA (miRNA) altered the expression of VAMP8, a critical component of platelet granule exocytosis. miRNAs are small (∼ 22 nucleotides) noncoding RNAs that function post-transcriptionally in regulating gene expression by inducing mRNA degradation or translation inhibition, generally by targeting the 3′-untranslated region (UTR) of mRNAs.6 miRNAs were initially identified as regulators of genes involved in development but have since been shown to affect a broad range of normal physiologic processes, including hematopoietic lineage commitment, as well as pathologic conditions.7,8 More than 1000 miRNAs have been identified, which are estimated to regulate most (> 60%) coding genes.9 The cellular impact of most miRNA-mRNA interactions is a fine-tuning of protein output, and not a major repression of expression.10 Importantly, as little as a 20% reduction in miRNA levels can produce a disease phenotype.11
Recent data demonstrate a role for miRNAs in both normal and diseased human megakaryocytopoiesis.8,12-17 Although we and others have observed miRNAs in platelets,15,18-23 their biology is largely unexplored. We are unaware of a prior unbiased, genome-wide miRNA profiling study that has attempted to establish associations with platelet phenotypes. Because we had previously obtained platelet mRNA profile data on a cohort of healthy subjects with marked variability in platelet responsiveness, we had a unique opportunity to test for (1) associations between miRNA profiles and platelet reactivity and (2) relationships between DE miRNAs and target DE mRNAs. These experimental and bioinformatic approaches identified a refined and highly suggestive set of candidate DE miRNA-mRNA pairs. We report the validation of this approach by miR-mediated knockdown of protein in cells, thus providing new insights into platelet physiology and into the molecular mechanisms affecting differential megakaryocyte/platelet gene regulation.
Methods
Subjects
The study was approved by the institutional review boards of Thomas Jefferson University and Baylor College of Medicine, and informed consent was obtained from all participants in accordance with the Declaration of Helsinki. The original cohort of healthy subjects, the sample collection, and methods of platelet phenotyping have been described previously.24 From this cohort, 29 subjects were recalled for phlebotomy for the platelet RNA expression study. After completion of the mRNA profiling,5 sufficient RNA remained for miRNA profiling on 19 subjects.
LDP and RNA preparations
Blood was drawn into acid citrate dextrose (85mM trisodium citrate, 78mM citric acid, 111mM glucose) and centrifuged at 180g for 10 minutes. Ethylenediaminetetraacetic acid was added to the platelet-rich plasma (PRP) at a final concentration of 2mM. Platelets were pelleted at 1000g for 10 minutes and resuspended in 3 mL Beads buffer (0.8% NaCl, 0.02% KCl, 0.144% Na2HPO4, 0.024% KH2PO4, 0.5% bovine serum albumin, and 2mM ethylenediaminetetraacetic acid). A total of 40 μL of human CD45 MicroBeads reagent (Miltenyi Biotec) was added and incubated at room temperature for 45 minutes with gentle mixing. Leukocyte-depleted platelets (LDPs) were collected as the negative fraction flow-through using magnetic separation columns (Miltenyi Biotec). This protocol yielded a purity of less than 1 leukocyte per 5 million platelets. RNA extraction from LDPs and megakaryocytic cell lines (HEL and Meg-01) was performed with TRIzol (Invitrogen).
miRNA array profiling
The quality of the total RNA was verified by an Agilent 2100 Bioanalyzer profile. Approximately 350 ng of total RNA from each sample and the reference RNA were labeled with Hy3 and Hy5 fluorescent labels, respectively, and hybridized to the miRCURY LNA array, Version 11.0 (Exiqon), which contains more than 900 capture probes targeting all human miRNAs registered in the miRBASE Version 13.0 at the Sanger Institute following the procedure described by the manufacturer (Exiqon). After hybridization, the microarray slides were scanned and image analysis carried out using ImaGene Version 8.0 software (BioDiscovery). The quantified signals were background corrected and normalized using the global LOWESS (LOcally WEighted Scatterplot Smoothing) regression algorithm. All miRNA microarray data have been deposited in the Gene Expression Omnibus under accession number GSE27917.
Bioinformatic analysis of miRNA levels
Traditional log2-ratio analysis was used for consideration of 2-color microarray data.25,26 The use of log2-ratios provides a more reliable analysis across a large number of heterogeneous microarray oligonucleotide probes by integrating a pair of hybridization signals within each oligonucleotide feature: one value for the test sample and one for a reference control. The ratio value cancels out intensity variations between the oligos that are driven by hybridization energetic properties of the probe sequences, yet the ratio values retain the relative abundance differences between the test and reference samples.25-27 Because all samples are compared with a common reference, the log2-ratios serve to more reliably represent the differences in miRNA abundance between the test samples across the large number of features on the array.
The log2-ratios were used to perform a cluster analysis on the samples, and a rank correlation dendrogram with a mean join rule between clusters was computed to represent the similarity of the miRNA profiles. We also performed a 2-sample unequal variances t test to identify the DE miRNAs between groups with differing platelet reactivity. To visualize the miRNA log2-ratio values for the set of potentially DE miRNAs between the platelet response groups, we used the heatmap method, which provides a 2-dimensional visual representation of the relative expression values for many miRNAs across all persons in our study.
Biomarker predictions
We analyzed the log2-ratio miRNA values as explanatory data to predict the quantitative epinephrine response phenotype of each subject. To avoid overfitting, we first selected a subset of the miRNAs that had the strongest individual correlations with the epinephrine response phenotype based on linear regression analysis. We performed our predictive analysis with variable numbers of miRNAs from as few as 2 to more than 10. We found that 7 miRNAs performed best in our analysis, by optimally balancing model richness with the danger of overfitting and loss of ability to generalize to new observations. This analysis determined the best predictor miRNAs among all miRNAs identified in the 2-sample t test differential expression analysis. We then performed multiple linear regression prediction using cross-validation with the 7 miRNAs used together to predict response. To ensure this analysis was robust, we chose a cross-validation approach where each subject was in turn removed from the model estimation step and then their platelet phenotype response was predicted using the model fit (regression coefficients) determined by the analysis of the other subjects.
mRNA-miRNA correlation analysis
To refine the number of functional studies for candidate DE miRNAs, we developed a strategy based on the predicted negative correlation between levels of functional miRNAs and the level of an authentic mRNA target. Raw mRNA expression data were extracted on the samples from our prior platelet mRNA profiling study.5 We then used the miRNA-mRNA target predictions made available in the September 2008 release of miRANDA target prediction (www.microrna.org/microrna/home.do). For each mRNA-miRNA pair where (1) the mRNA was predicted to be expressed,5 (2) the miRNA had observable expression in all 19 samples, and (3) the miRanda target prediction score was greater than 150, we computed a simple linear regression slope statistic and the associated P value. In addition, we computed 2-sample T-statistics to compare mRNA expression values between the high and low platelet reactivity groups. In situations where multiple mRNA probes were present for a single gene, we considered the probe with the strongest mRNA-miRNA absolute correlation.
Assess miRNA knockdown of target gene products
The megakaryocytic cell line Meg-01 and HCT116-Dicer-KO 2 (HCT-DK) cells were used for miRNA transfection experiments. The HCT-DK cells (kindly provided by Dr Renato Baserga, Department of Cancer Biology, Thomas Jefferson University) express a mutant DICER1 that has the exon 5 helicase domain disrupted but has an intact RNase III domain, resulting in reduced (but not absent) RNase activity and, hence, reduced amounts of mature miRNAs.28 This system allows a more clear assessment of exogenous miRNA effects. Cells were transfected with 40 to 80nM final concentration of specific or negative control pre-miR miRNA ds-oligo precursors (Ambion). Meg-01 and HCT-DK cells were transfected by electroporation using Nucleofactor II (Amaxa) and DharmaFECT 4 (Dharmacon RNA Technologies), respectively, and were harvested 48 to 72 hours later for protein analysis. The pre-miR-miRNA precursor molecule-negative control #1 (Ambion) used in these experiments has a random sequence that has no known human mRNA target. Proteins were separated by reduced gradient (4%-20%) sodium dodecyl sulfate–polyacrylamide gel electrophoresis, transferred to membranes, and immunoblotted with polyclonal antibodies specific for CLOCK, KLHL5, and PRKAR2B (Abcam). Protein quantification was performed using LI-COR Odyssey Western blot analysis.
Assessment of miRNA binding to 3′-UTRs using reporter gene assays
The locations of candidate miRNA binding sites in the 3′-UTR of candidate mRNAs were identified using miRanda, and the corresponding regions of the genome were polymerase chain reaction amplified from genomic DNA and cloned directionally into the 3′-UTR of the enhanced green fluorescent protein (EGFP) gene in the pEGFP-C1 vector (BD Biosciences). These reporter gene constructs were verified by sequencing to contain the 3′-UTRs of PRKAR2B (nt 1794-2032), KLHL5 (nt 955-1198), and CLOCK (nt 1-643) (nucleotide positions are numbered starting at the first position of the 3′-UTR of the mRNA). Reporter constructs were cotransfected with the candidate pre-miR miRNA ds-oligo precursors (Ambion) into HCT-DK cells and assessed for GFP expression by immunoblotting. GFP expression was normalized to α-tubulin.
Functional assessment of the type II β regulatory subunit of cAMP-dependent PKA
All mouse protocols were approved by the Animal Care and Use Committee of University of Washington (Seattle, WA). Platelet lysates were prepared from PRP and immunoblotted for PRKAR2B. Citrated whole blood from wild-type C57Bl/6 mice and mice null for Prkar2b29 was diluted 25-fold with Tyrode-N-2-hydroxyethylpiperazine-N′-2-ethanesulfonic acid buffer (140mM NaCl, 2.7mM KCl, 12mM NaHCO3, 0.46mM NaH2PO3, 5.5mM glucose, 10mM N-2-hydroxyethylpiperazine-N′-2-ethanesulfonic acid, pH 7.4), incubated with epinephrine (Bio/Data), or PAR4 activation peptide (PAR4AP; NH2-GYPGQV-CONH2; Abgent), or both, at room temperature for 30 minutes in the presence of 10 μg/mL fluorescein isothiocyanate-conjugated rat anti–mouse CD62P antibody (P-selectin antibody; BD Biosciences). The samples were then fixed with 1% paraformaldehyde and analyzed by flow cytometry. Platelet mean fluorescence intensity was quantified by flow cytometry and analyzed by multifactor analysis of variance using explanatory variables for agonist dosage, genotype, and animal effects.
Results
miRNA expression profiling
Platelets were categorized as hyper-reactive (n = 13) or hyporeactive (n = 6) based on the maximal aggregation response to 1.5μM epinephrine (mean 83.1% vs 21%, respectively, P < .001) and 4μM ADP (mean 85.3% vs 55.7%, respectively, P < .001). There was no significant difference between the hyper-reactive and hyporeactive subjects for fibrinogen or von Willebrand factor levels (not shown). Because PRP prepared by standard density centrifugation is contaminated with leukocytes (1 leukocyte per 10 000-100 000 platelets), and because leukocytes contain 10 000 to 100 000 times as much RNA as do platelets,30,31 LDP RNA was used for miRNA expression profiling. We found that 284 miRNAs (of > 900 screened) were expressed in all 19 LDP RNA samples. The 15 highest expressed miRNAs are listed in Table 1. Supple-mental Table 1 (available on the Blood Web site; see the Supple-mental Materials link at the top of the online article) provides all 284 platelet miRNAs by expression level.
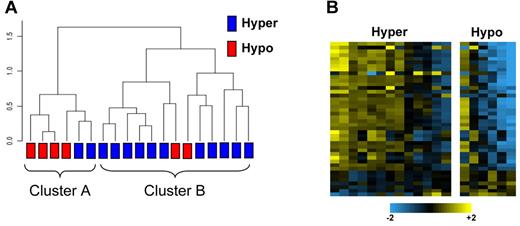
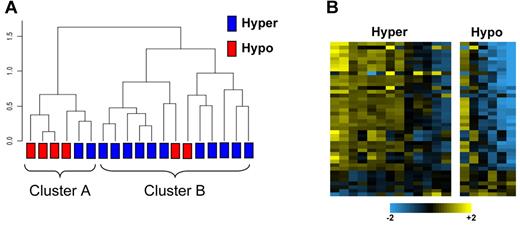
We computed a rank correlation dendrogram using the 284 miRNAs to represent the similarity of the samples independent of platelet functional response (Figure 1A). A group structure emerged in the unsupervised dendrogram analysis, indicating 2 groups of samples according to patterns of miRNA expression. We then considered the individual platelet reactivity and found that these phenotypes partially coincided with the 2 groups defined by miRNA levels. A second analysis was performed in which 74 miRNAs were identified as differentially expressed between the hyper-reactive and hyporeactive groups (P < .05). The heatmap in Figure 1B represents the 41 miRNAs (listed in supplemental Table 2) that best separated the hyperreactive from hyporeactive platelet samples. Table 1 lists the 15 miRNAs showing the greatest differential expression.
Platelet microRNA profiling in 19 healthy subjects. (A) Unsupervised hierarchical clustering of miRNA expression profiles. The dendrogram was generated with 284 miRBase miRNAs that were expressed in the platelets of all 19 subjects included in the study. The dendrogram represents a Euclidean distance dendrogram of the median-centered log ratio values for the 19 samples. Two major clusters are identified, which tend to differentiate between platelets of differing reactivity to epinephrine. (B) Heatmap with miRNAs that were differentially expressed between the 2 platelet reactivity groups using a 2-sample unequal variances t test. Each row in the heatmap indicates the log-ratio intensity data of 1 DE miRNA across the 19 subjects.
Platelet microRNA profiling in 19 healthy subjects. (A) Unsupervised hierarchical clustering of miRNA expression profiles. The dendrogram was generated with 284 miRBase miRNAs that were expressed in the platelets of all 19 subjects included in the study. The dendrogram represents a Euclidean distance dendrogram of the median-centered log ratio values for the 19 samples. Two major clusters are identified, which tend to differentiate between platelets of differing reactivity to epinephrine. (B) Heatmap with miRNAs that were differentially expressed between the 2 platelet reactivity groups using a 2-sample unequal variances t test. Each row in the heatmap indicates the log-ratio intensity data of 1 DE miRNA across the 19 subjects.
Prediction analysis
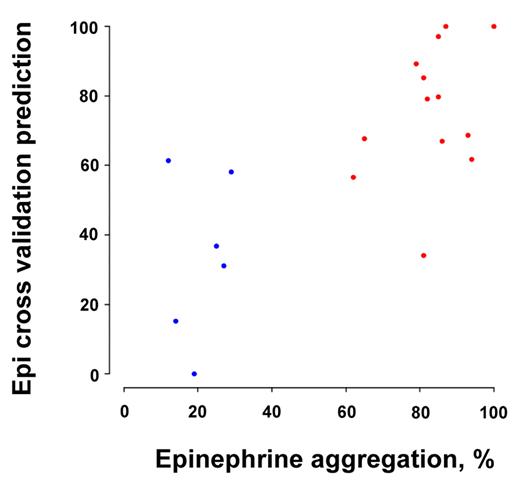
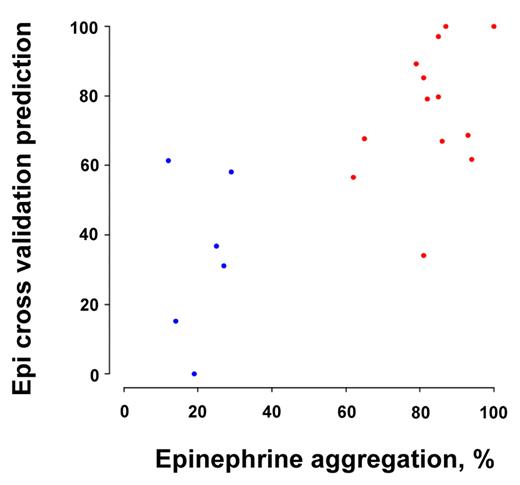
These results prompted us to consider whether a smaller set of platelet mRNAs could be identified that might have predictive value for platelet reactivity. As few as 7 of the differentially expressed miRNAs (miR-19b, miR-34b, miR-190, miR-320a, miR-320b, miR-320c, and miR-320d) identified a strong correlation (Spearman rank correlation = 0.71, P = .0006801) between the true epinephrine response and the predicted response from the cross-validated regression analysis (Figure 2). This prediction analysis suggests that miRNA expression log2-ratios may be a quantitative predictor of the platelet aggregation response.
Platelet reactivity predicted by differentially expressed miRNAs. Cross-validation analysis using 7 miRNAs (miR-19b, miR-34b, miR-190, miR-320a, miR-320b, miR-320c, and miR-320d) was able to predict the true epinephrine response in hyper-reactive (red) and hyporeactive (blue) platelets (r = 0.71, P = .0006801). See “Biomarker predictions” for criteria used to select the miRNAs.
Platelet reactivity predicted by differentially expressed miRNAs. Cross-validation analysis using 7 miRNAs (miR-19b, miR-34b, miR-190, miR-320a, miR-320b, miR-320c, and miR-320d) was able to predict the true epinephrine response in hyper-reactive (red) and hyporeactive (blue) platelets (r = 0.71, P = .0006801). See “Biomarker predictions” for criteria used to select the miRNAs.
Platelet-megakaryocytic cell line miRNA correlations
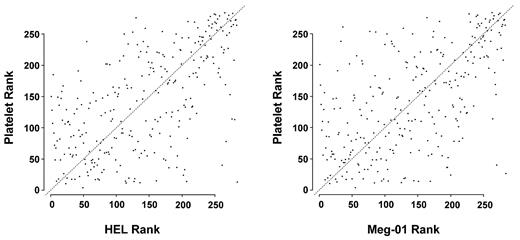
Biologic studies in megakaryocytic cell lines are often used as surrogates for human megakaryocytes, which are difficult to obtain in large numbers. We profiled miRNAs from HEL and Meg-01 cells and found a correlation between normal human platelets and both HEL cells (r = 0.595, P < 2.2 × 10⁻¹⁶) and Meg-01 cells (r = 0.58, P < 2.2 × 10⁻¹⁶; Figure 3).
Rank correlation between platelet and HEL or Meg-01 cells. The miRNA expression levels were ranked for platelets, HEL cells, and Meg-01 cells. Correlations were determined and plotted between platelets and each megakaryocytic cell line.
Rank correlation between platelet and HEL or Meg-01 cells. The miRNA expression levels were ranked for platelets, HEL cells, and Meg-01 cells. Correlations were determined and plotted between platelets and each megakaryocytic cell line.
miRNA-mRNA correlations
The role of a DE mRNA can usually be studied by testing the known or predicted function of the corresponding protein. The situation is very different for a candidate DE miRNA because miRNAs target many mRNAs. Using in silico techniques, we determined that the median number of distinct predicted gene targets per human miRNA is 307 (range = 12 for hsa-miR-126 [minimum] to 1417 for hsa-miR-590–3p [maximum]). Thus, the set of all theoretically possible miRNA-mRNA pairs to consider is quite large. When we considered only the platelet-expressed miRNAs and mRNAs, the number of unique pairs with a good alignment score was reduced to 29 821 (supplemental Figure 1, filtering strategy), an impractical number to test functionally. Furthermore, such in silico predictions often lead to false-positive findings that cannot be validated in living cell experiments. Therefore, we sought to divine linkages between miRNAs and mRNA to prioritize which miRNAs would be tested functionally.
We developed a bioinformatics approach to identify DE platelet miRNAs that have binding sites in 3′-UTRs of DE platelet mRNAs. Our strategy was based on the assumption that any platelet miRNA that causes mRNA degradation by directly binding to the 3′-UTR of the mRNA will result in a negative correlation for the miRNA-mRNA pair in the 19 subjects in our study. We chose miRNA-mRNA pairs that met 3 criteria: (1) DE miRNA between hyper-reactive and hyporeactive platelets (P < .05), (2) DE mRNA between hyperreactive and hyporeactive platelets (P < .05), and (3) a negative correlation in the slopes of the DE miRNA and mRNA. This stringent filtering reduced the number of candidate miRNA-mRNA pairs to 12 among 6 platelet expressed genes (PRKAR2B, KLHL5, CLOCK, WIPF1, CEP27, and ALPP; Table 2)
Platelet expressed miRNAs knockdown platelet expressed targets
To validate this genomic and bioinformatics approach as a means of identifying functional platelet miRNAs, 3 pairs were selected from Table 2 for testing in cells. This selection was based on (1) biologic plausibility of a role for the mRNA in platelets (PRKAR2B, KLHL5, and CLOCK) and (2) an mRNA-miRNA correlation slope of less than −1. Figure 4 shows the anticorrelation of expression patterns for the 3 selected pairs (miR-200b:PRKAR2B, miR-495:KLHL5, and miR-107:CLOCK). (Although W1P1 has known function in platelets, it was not chosen because the negative slope of the miRNA-mRNA correlation was less than for PRKAR2B, KLHL5, and CLOCK.)
Expression levels of the mRNA-miRNA pairs. The box plots represent the expression levels of miRNAs and mRNA in hyper-reactive platelets (Hyper) and hyporeactive (Hypo) platelets. (A) The hsa-miR-200b (left) and PRKAR2B mRNA (right) pair. (B) The hsa-miR-495 (left) and KLHL5 mRNA (right) pair. (C) The hsa-miR-107 (left) and CLOCK mRNA (right) pair. In each pair, the directionality of the Hyper versus Hypo group is opposite for the miRNA and the mRNA. Notably, all miRNAs and mRNAs are significantly differentially expressed (P < .05) between the Hyper and Hypo groups.
Expression levels of the mRNA-miRNA pairs. The box plots represent the expression levels of miRNAs and mRNA in hyper-reactive platelets (Hyper) and hyporeactive (Hypo) platelets. (A) The hsa-miR-200b (left) and PRKAR2B mRNA (right) pair. (B) The hsa-miR-495 (left) and KLHL5 mRNA (right) pair. (C) The hsa-miR-107 (left) and CLOCK mRNA (right) pair. In each pair, the directionality of the Hyper versus Hypo group is opposite for the miRNA and the mRNA. Notably, all miRNAs and mRNAs are significantly differentially expressed (P < .05) between the Hyper and Hypo groups.
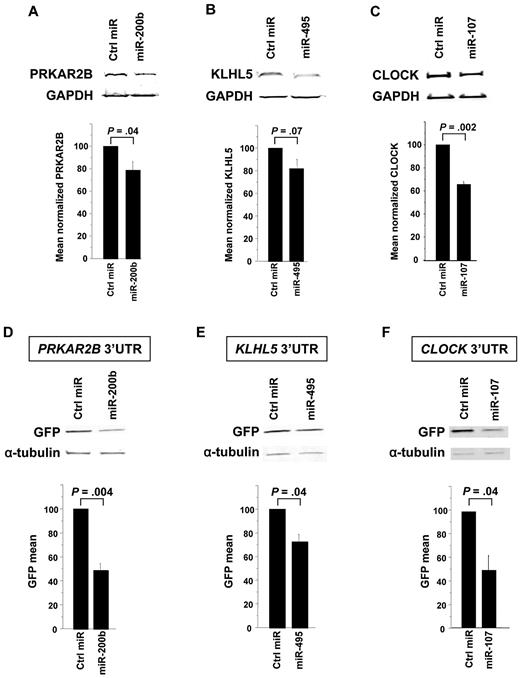
First, miRNAs were transfected into cells that express the target protein. We observed that miR-200b induced a 21% knockdown of PRKAR2B (P = .04, Figure 5A); miR-495 induced an 18% knockdown of KLHL5 (P = .07, Figure 5B); and miR-107 induced a 37% knockdown of CLOCK (P = .002, Figure 5C). Subsequently, to test whether the miRNA of interest directly targeted the 3′-UTR of the candidate mRNA, cotransfection experiments were performed using reporter gene constructs engineered to contain the candidate mRNA 3′-UTR. As shown in Figure 5D-F, miR-200b, miR-495, and miR-107 directly targeted and repressed expression through the 3′-UTR of PRKAR2B (50% reduction; P = .004), KLHL5 (23% reduction; P = .04), and CLOCK (50% reduction; P = .04), respectively.
miRNAs regulate the expression of PRKAR2B, KLHL5, and CLOCK by binding to their 3′-UTR. Cells expressing the protein of interest were transfected by the candidate miRNA and assessed for protein knockdown. The negative miRNA control has a scrambled sequence that does not repress any gene. Each panel shows a Western immunoblot (above) and the mean of at least 3 experiments below. Protein levels were normalized to levels of GAPDH. (A) Pre-miR-200b was transfected into Meg-01 cells (5 × 10⁶ cells), and lysates were harvested at 48 hours. The bar graph represents the mean 21% knockdown of 3 independent experiments. (B) Pre-miR-495 was transfected into Meg-01 cells (5 × 10⁶ cells), and lysates were harvested at 72 hours. The bar graph represents the mean 18% knockdown of 6 independent experiments. The miR-495 knockdown of KLHL5 showed a trend (P = .07). (C) Pre-miR-107 was transfected into HCT-DK cells (0.2 × 10⁶ cells), and lysates were harvested at 48 hours. The bar graph represents the mean 37% knockdown of 4 independent experiments. (D) The 50% decrease in GFP expression when the PRKAR2B 3′-UTR plasmid is cotransfected with pre-miR-200b compared with negative control in HCT-DK cells. Similarly, there was a 23% decrease in GFP when KLHL5 3′-UTR was cotransfected with pre-miR-495 (E) and 50% decrease in GFP with CLOCK 3′-UTR was cotransfected with pre-miR-107 (F). α-Tubulin was used as an internal control to normalize the GFP levels between the test and the control lanes.
miRNAs regulate the expression of PRKAR2B, KLHL5, and CLOCK by binding to their 3′-UTR. Cells expressing the protein of interest were transfected by the candidate miRNA and assessed for protein knockdown. The negative miRNA control has a scrambled sequence that does not repress any gene. Each panel shows a Western immunoblot (above) and the mean of at least 3 experiments below. Protein levels were normalized to levels of GAPDH. (A) Pre-miR-200b was transfected into Meg-01 cells (5 × 10⁶ cells), and lysates were harvested at 48 hours. The bar graph represents the mean 21% knockdown of 3 independent experiments. (B) Pre-miR-495 was transfected into Meg-01 cells (5 × 10⁶ cells), and lysates were harvested at 72 hours. The bar graph represents the mean 18% knockdown of 6 independent experiments. The miR-495 knockdown of KLHL5 showed a trend (P = .07). (C) Pre-miR-107 was transfected into HCT-DK cells (0.2 × 10⁶ cells), and lysates were harvested at 48 hours. The bar graph represents the mean 37% knockdown of 4 independent experiments. (D) The 50% decrease in GFP expression when the PRKAR2B 3′-UTR plasmid is cotransfected with pre-miR-200b compared with negative control in HCT-DK cells. Similarly, there was a 23% decrease in GFP when KLHL5 3′-UTR was cotransfected with pre-miR-495 (E) and 50% decrease in GFP with CLOCK 3′-UTR was cotransfected with pre-miR-107 (F). α-Tubulin was used as an internal control to normalize the GFP levels between the test and the control lanes.
The regulatory subunit of PKA is required for normal platelet activation
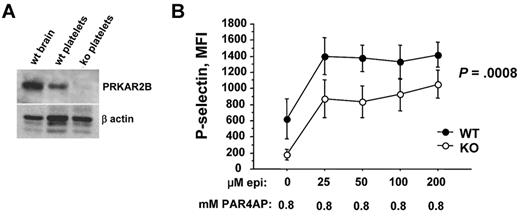
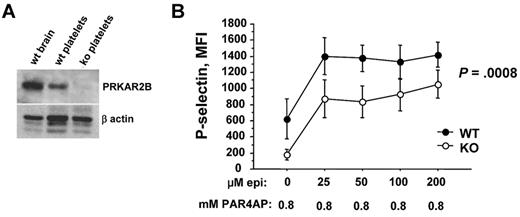
We next tested whether our approach had identified genes that control platelet reactivity. Most studies on the functionality of cyclic adenosine monophosphate (cAMP)–dependent protein kinase A (PKA) in platelets have assessed the phosphorylating activity of the catalytic subunit.32 Although the regulatory subunit (encoded by PRKAR2B) is thought to control PKA activity,33 there are no inhibitors of the regulatory subunit, and we are unaware of work that directly tests its function in platelets. Using mice rendered null for Prkar2b29 , we confirmed the absence of protein in platelets (Figure 6A). Compared with wild-type platelets, we found that platelets lacking PRKAR2B expressed similar levels of P-selectin under resting conditions (not shown). Epinephrine alone has little or no ability to induce mouse aggregation but markedly enhances PAR4-mediated platelet aggregation.34 Using a subthreshold concentration of PAR4AP, we observed that increasing concentrations of epinephrine substantially increased platelet activation (Figure 6B). Notably, and compared with wild-type platelets, Prkar2b−/− platelets had reduced activation (P = .0008). These functional experiments provide strong support to our strategy for identifying functional miRNAs in platelets.
Platelets null for PRKAR2B are hyporesponsive. (A) PRKAR2B immunoblot. Lysates of mouse wild-type (wt) brain, wt platelets, and platelets from Prkar2b−/− mice (KO) were subjected to sodium dodecyl sulfate–polyacrylamide gel electrophoresis and immunoblotted with polyclonal antisera raised against recombinant mouse protein as described.29 Approximately equal loading is shown by immunoblotting for β-actin. (B) Platelet surface expression of the activation marker, P-selectin, was quantified by flow cytometry on platelets from wild-type (WT) mice and mice null for Prkar2b (KO).29 Platelets were stimulated with a fixed, subthreshold concentration of PAR4AP (0.8mM) and the indicated increasing concentrations of epinephrine.
Platelets null for PRKAR2B are hyporesponsive. (A) PRKAR2B immunoblot. Lysates of mouse wild-type (wt) brain, wt platelets, and platelets from Prkar2b−/− mice (KO) were subjected to sodium dodecyl sulfate–polyacrylamide gel electrophoresis and immunoblotted with polyclonal antisera raised against recombinant mouse protein as described.29 Approximately equal loading is shown by immunoblotting for β-actin. (B) Platelet surface expression of the activation marker, P-selectin, was quantified by flow cytometry on platelets from wild-type (WT) mice and mice null for Prkar2b (KO).29 Platelets were stimulated with a fixed, subthreshold concentration of PAR4AP (0.8mM) and the indicated increasing concentrations of epinephrine.
Discussion
The importance of noncoding RNAs has become increasingly appreciated over the past decade.6 miRNA has been the most studied of the small RNAs, but relatively little is known about the role of miRNAs in megakaryocyte/platelet biology. In this study, we focused on the potential role of platelet miRNAs as both a biomarker of platelet reactivity and a regulator of platelet mRNA variation by using a dataset that includes measures of both platelet mRNA and miRNA, as well as the associated phenotypic variation. The major findings were (1) the identification and quantification of 284 miRNAs in normal human platelets, (2) the establishment of miRNA profiles associated with platelet reactivity, (3) the demonstration that platelet miRNAs miR-200b, miR-495, and miR-107 were able to repress the expression of target genes, (4) the validation of an approach for identifying functional miRNAs, and (5) the demonstration that altered levels of PRKAR2B regulate platelet reactivity. Our data can serve as a reference and approach for future studies in megakaryocytes/platelets, and we suggest that a limited number of miRNAs may serve as predictors of enhanced platelet aggregation.
Prior studies have demonstrated miRNAs in PRP from healthy subjects,19-21,23 and miR-339 and miR-28 were shown to be overexpressed in PRP from patients with myeloproliferative disease.19,20 However, because leukocytes have many orders of magnitude more RNA than platelets, it is best not to make conclusions about platelet-specific miRNAs using PRP. Landry et al used pooled RNA from LDPs from 4 healthy persons to profile approximately 444 miRNAs and study miRNA biogenesis in platelets.22 Both the Landry et al study22 and ours found high levels of miRNAs in platelets; and when we compared the mean miRNA levels from our subjects with those of the Landry et al study,22 we found a strong correlation (r = 0.752, P = 4.3 × 10⁻²³; supplemental Figure 2). Not surprisingly, the correlations between human platelet miRNAs and megakaryocytic cell lines were less impressive than these platelet-platelet correlations (Figure 3). Although the platelet megakaryocyte cell line correlations were highly statistically significant, some miRNA levels were discordant between platelets and megakaryocyte cell lines, and cell lines may not always be a good model for miRNAs in this lineage.
By performing individual hybridizations from LDP RNA samples, we were able to retain platelet functional information for association analyses. Using a genome-wide screen, we profiled more than 900 established human miRNAs and defined 2 major groups by unsupervised cluster analysis. Importantly, these groups were defined only by miRNA profiles and without consideration of platelet reactivity. Subsequent assignment of the platelet reactivity to individual samples in these groups demonstrated that these miRNA profiles largely coincided with the platelet responses to epinephrine (Figure 1A). Conversely, when the analysis began by dichotomizing the platelet response to epinephrine, we identified 74 miRNAs DE according to epinephrine reactivity. Notably, the majority of miRNAs were identified as more highly expressed in the hyperreactive samples, a finding consistent with more DE mRNAs being up-regulated in hyporeactive platelets compared with hyperreactive platelets.5,12,16 Perhaps platelets contain more mRNAs that encode proteins that inhibit platelet activation to maintain platelets in a resting state, in which case hyper-reactive platelets may contain higher levels of these regulatory miRNAs (Figure 1B). The differential expression of miRNAs raised the possibility that platelet miRNA profiles may have predictive value for differentiating hyporeactive and hyperreactive platelet phenotypes. Indeed, when we performed a cross-validated linear prediction analysis, we observed that as few as 7 miRNAs could predict epinephrine-induced platelet reactivity. Because miRNAs are very stable with half-lives of days35 and have previously been demonstrated to predict disease activity in cancer,14 our findings support the need for prospective studies testing associations between platelet miRNAs and arterial thrombotic disorders.
Besides their potential as biomarkers, we considered the role of miRNAs as regulators of interindividual variation in platelet function via their effects on mRNA and protein levels. miRNAs usually bind to complementary sites in the 3′-UTR of target transcripts via Watson-Crick base-pairing, which enables recruitment of effector proteins that primarily degrade the mRNA.37 But the mechanism by which an altered miRNA level may affect platelet function is not obvious because miRNAs target many mRNAs. The number of in silico predicted unique miRNA-mRNA platelet pairs was extremely large, so bioinformatics approaches were used to generate a highly refined set of 12 miRNA-mRNA pairs (Table 2). Although our strategy would probably miss mRNAs that are not degraded by miRNAs, our refined list was far less likely to contain false positives because of the high stringency criteria used: both the miRNA and the mRNA had to be significantly differentially expressed (P < .05) in association with platelet reactivity. Furthermore, the direction of altered expression between the hyperreactive and hyporeactive RNAs had to be inverse for miRNA and mRNA (as shown in Figure 4). Such stringent filtering is expected to yield miRNA-mRNA pairs with a high likelihood of being true associations.
Nevertheless, these computational predictions needed validation. Testing a single pair did not seem sufficient to support this bioinformatics approach, so 3 pairs were selected for testing in cells. It is important to note that the data presented in Figure 5 were not “cherry-picked,” and all data from all selected pairs were shown. We considered 3 biologically plausible genes: (1) PRKAR2B, encoding the β-regulatory chain of cAMP-dependent protein kinase type II; (2) KLHL5, encoding a Kelch-like protein that binds actin37 ; and (3) CLOCK, encoding a major regulator of the cell circadian rhythm. Our profiling data showed that the mRNAs encoding all 3 of these proteins are abundantly expressed in normal platelets, and mRNA data were confirmed by immunoblotting of platelet lysates (not shown). MiR-200b and miR-495 knocked down PRKAR2B and KLHL5, respectively, in Meg-01 cells; miR-107 knocked down CLOCK in the HCT-DK cell line. For unclear reasons, miR-107 was not able to repress CLOCK in Meg-01 cells, perhaps because of an unknown cell-specific mechanism of CLOCK expression. Simple miRNA transfection knockdown experiments do not establish that the candidate miRNA acts through the 3′-UTR of the predicted mRNA because miRNAs may repress expression indirectly (eg, by inhibiting a transcriptional factor). However, the protein knockdown experiments were supported by cotransfection studies using reporter genes containing the 3′-UTR of interest (Figure 6). These experiments demonstrated that the combination of the miRNA and the putative 3′-UTR repress gene expression. Although we cannot exclude an indirect miRNA effect on another gene whose product regulates the 3′-UTR in these experiments, this seems unlikely considering the bioinformatic strategy that identified these miRNA-mRNA pairs is based exclusively on the matching sequences of the miRNA and the target 3′-UTR.
All 3 of the identified genes are biologically plausible as modifiers of platelet activation, and we undertook functional validation of PRKAR2B in platelets. cAMP is a well-known inhibitor of platelet activation and aggregation that acts through cAMP-dependent protein kinase (PKA).32,38 PKA is a heterotetramer composed of 2 catalytic subunits and 2 regulatory subunits. When cAMP binds to the regulatory subunit (encoded by PRKAR2B), the catalytic subunit is able to dissociate from the complex, phosphorylate its substrates, and suppress platelet activation.33,39 For the first time, our studies with PRKAR2B null platelets support this traditional view. Platelets lacking PRKAR2B were suppressed in their ability to activate (Figure 6), presumably because of the unregulated, inhibitory activity of the catalytic subunit. Importantly, these findings in knockout mice were consistent with our mRNA expression data showing low levels of PRKAR2B mRNA in hyporeactive human platelets (Figure 4). CLOCK is a transcription factor that plays a critical role in human circadian rhythm by feedback loops affecting variable expression of “clock” family proteins. There is a diurnal variation in the occurrence of myocardial infarction, which has been suggested to be related to the circadian variation in platelet aggregation.40,41 Notably, mice lacking CLOCK lose their circadian variation in platelet aggregation.42 CLOCK expression is regulated by miRNAs in the liver,43 but this is the first report of a megakaryocyte/platelet miRNA affecting a “clock” family gene. KLHL5 is a Kelch-like protein originally identified in Drosophila that has a proven actin-binding domain and also serves as a signaling molecule scaffold.44 Its role in platelet function is unknown but could participate in cytoskeletal reorganization, an essential feature of platelet activation. Taken together, these studies support our combined RNA profiling and bioinformatics approach to study megakaryocytic/platelet gene regulation and reveals novel aspects of known platelet signaling as well as genes that have not been previously known to play a role in platelet biology.
Our study has several limitations. Although this is the largest number of subjects studied for platelet miRNA expression to date, these findings should be confirmed with larger sample sizes and with other platelet phenotypes. The repertoire of platelet miRNAs may be different in disease states than in the healthy subjects in this study. The estimate of 284 platelet miRNAs may be conservative because we required each miRNA to be present in all 19 samples. Although multiple testing was not controlled for, false-positive rates should not have been overly inflated because of the stringency of the miRNA-mRNA selection strategy; indeed, our approach was validated by knockdown experiments in cells. Our studies do not address whether platelet miRNAs act in the platelet, the megakaryocyte, or both, but it is intriguing to consider that platelets have both the capacity to translate mRNA into protein45 and to process pre-miRNAs into mature miRNAs.22 Strengths of our study include our ability to associate miRNAs with platelet reactivity and mRNA levels, the absence of medications that might affect platelet function or miRNA expression, the use of LDP preparations, the screening of most known miRNAs, and validation of in silico predictions in living cells and mouse platelets.
In conclusion, we have profiled platelet miRNA from healthy subjects and provided evidence that supports a contribution of platelet miRNAs to the interindividual variation in platelet function and protein expression. Interindividual differences in miRNA levels could affect disease susceptibility because prior work has shown that even modest changes in miRNA levels (∼ 20% decrease) can cause autoimmune disease and predispose to malignancy.11 Our findings suggest that selected platelet miRNAs may have potential as biomarkers for vascular thrombosis. It will also be interesting to assess whether substantive differences in miRNA profiles exist between platelets and later-stage megakaryocytes. Such differences would support a potential for miRNAs to regulate platelet protein levels during the platelet life span in the circulation. Lastly, miRNA release via microvesicles and cell-to-cell transfer of miRNAs has been established in both human peripheral blood and plant cells.46 The high levels of miRNAs in platelets raise the possibility that platelets may serve as a delivery vehicle for miRNAs, either as a physiologic response to vessel injury or as a potential therapeutic approach.
The online version of this article contains a data supplement.
The publication costs of this article were defrayed in part by page charge payment. Therefore, and solely to indicate this fact, this article is hereby marked “advertisement” in accordance with 18 USC section 1734.
Acknowledgments
The authors thank Angela L. Bergeron and Carol W. Sun for their technical help with platelet phenotyping.
This work was supported by the National Institutes of Health (1R01HL102482, 5R01HL088458).
National Institutes of Health
Authorship
Contribution: S.N. designed and performed the research, analyzed the data, and wrote the manuscript; C.S. and L.C.E. analyzed the data and wrote the manuscript; X.K., L.M., Y.J., and L.Y. performed experiments; J.C. designed and performed experiments; G.S.M. and J.A.L. contributed valuable experimental material and expertise; A.A.K., M.S.B., and S.M.L. wrote the manuscript; J.-f.D. performed the research and wrote the manuscript; and P.F.B. designed the research, analyzed the data, and wrote the manuscript.
Conflict-of-interest disclosure: The authors declare no competing financial interests.
Correspondence: Paul F. Bray, Jefferson Medical College, Curtis Bldg Rm 324, 1015 Walnut, Philadelphia, PA 19107; e-mail: paul.bray@jefferson.edu.

