

Abstract
Abstract 1945
Poster Board I-968
T-cell Subpopulations Quantified by Flow Cytometry in Lymph Node Cell Suspensions Identify a Group of Patients with Follicular Lymphoma with Good Prognosis
Neus Villamor, Gonzalo Gutiérrez, Joaquim Carreras, Eva Giné, Gabriela Ghita, Marta Aymerich, Montserrat Torrebadell, Antonio Martínez, Lluís Colomo, Emili Montserrat, Elías Campo, Armando López-Guillermo
Hematopathology Unit and Department of Hematology, Hospital Clínic, IDIBAPS, Barcelona, Spain.
Tumor microenvironment plays an important role in the behavior of follicular lymphoma (FL), as demonstrated by gene expression profile analysis. Using this technique, an increase in macrophages has been associated with poor outcome, whilst an increase in T-cells is associated with better prognosis. Immunohistochemical analysis has been performed as alternative method to gene expression profile, but the quantification is time consuming and poorly standardized. Patients and methods: T-cell populations from lymph nodes of 68 patients (35M/33F, median age 59, range 29 to 81) with FL at diagnosis were quantified by flow cytometry in cell suspensions. The percentage of CD3, CD4, CD8, CD57, and germinal center (GC) CD4 cells (CD4+CD57+), as well as the ratio B/T, CD4/CD8, CD4/CD3, CD8/CD3 and GC-CD4/CD4 were correlated with the main initial features and the clinical outcome of the patients. The distribution according to the histological grade was: grade 1 and 2, 53 patients; grade 3a, 14; grade 3b, 1. Fifty-one percent of patients had low-risk FLIPI. 62 patients have received polychemotherapy, including rituximab in 33, whereas in 6 a watchful waiting policy was established. After a median follow-up of 4 years, 17 patients have died, with a 5-year overall survival (OS) of 77%. Results: The mean (±SD) percentage of B-cells, CD3, CD4, CD8 and GC-CD4 was 58.6% (±14.2), 36.1% (±15.2), 27.1% (±12.3), 8.7% (±5.1), and 3.4% (±2.4). No correlation was found between percentages of T cell subpopulations, B/T, CD4/CD3 and CD8/CD3 cell ratios and the clinical characteristics, failure-free survival (FFS) and OS. The median value CD4/CD8 and GC-CD4/CD4 ratios was 3.4 (range: 0.51 to 1) and 0.11 (n=56) (range: 0.02 to 0.34), respectively. Grade 3 histology was more frequently observed in patients with CD4/CD8 ratio <4.6 (percentile 0% to 75%) than in cases with CD4/CD8 ratio 34.6 (27% vs 0%; p=0.02). Advanced Ann-Arbor stage was also associated low CD4/CD8 ratio (p=0.02). Response to treatment was not related to lymphocyte subpopulations. FFS was longer in patients with CD4/CD8 34.6 (75% vs. 49% at 5 years, p=0.03), and in those with GC-CD4/CD4 30.18 (percentile 75% to 100%) (71% vs. 47% at 5 years, p=0.05). FLIPI, among other clinical variables, was able to predict OS. Patients with a CD4/CD8 ratio 34.6 had better OS than the remainder (5-year OS: 100% vs. 66%, respectively; p=0.02). Finally, patients with GC-CD4/CD4 ratio (30.18) showed a better OS than the rest (5-year OS: 100% vs. 67%, respectively; p=0.028) (figure). A multivariate analysis was performed including GC-CD4/CD4, CD4/CD8 and FLIPI, with GC-CD4/CD4 being the most important variable to predict OS in the Cox model with 53 patients (relative risk: 41; p=0.01). In conclusion, the analysis of T cell subpopulations in lymph node cell suspensions allows the identification of FL patients with a microenvironment associated with good prognosis. Flow cytometry is an easy, fast and standardized technique to assess T-cell signature in FL. 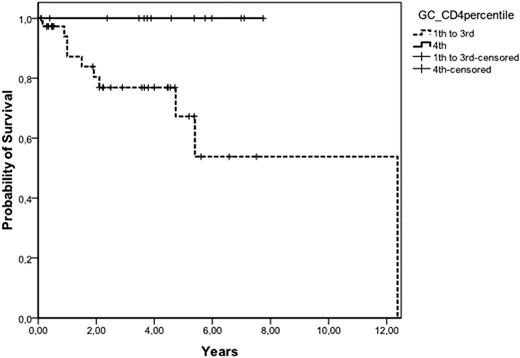
No relevant conflicts of interest to declare.

