Abstract
The postnatal thymus is the primary source of T cells in vertebrates, and many if not all stages of thymocyte development require interactions with thymic epithelial cells (TECs). The Foxn1 gene is a key regulator of TEC differentiation, and is required for multiple aspects of fetal TEC differentiation. Foxn1 is also expressed in the postnatal thymus, but its function after birth is unknown. We generated a Foxn1 allele with normal fetal expression and thymus development, but decreased expression in the postnatal thymus. This down-regulation causes rapid thymic compartment degeneration and reduced T-cell production. TEC subsets that express higher Foxn1 levels are most sensitive to its down-regulation, in particular MHCIIhiUEA-1hi medullary TECs. The requirement for Foxn1 is extremely dosage sensitive, with small changes in Foxn1 levels having large effects on thymus phenotypes. Our results provide the first evidence that Foxn1 is required to maintain the postnatal thymus. Furthermore, the similarities of this phenotype to accelerated aging-related thymic involution support the possibility that changes in Foxn1 expression in TECs during aging contribute to the mechanism of involution.
Introduction
The postnatal thymus consists of a complex cellular and extracellular environment through which developing thymocytes migrate in a stereotypical manner during their differentiation to self-restricted, self-tolerant T cells.1,2 The principal thymic stromal cell types are thymic epithelial cells (TECs), which are broadly divided into cortical and medullary classes, and have specific functions to promote all stages of thymocyte development.3,4 The normal postnatal thymus displays dramatic shifts in size and phenotype over the life of the animal due to the influence of external and internal changes. In the early postnatal stage the thymus undergoes rapid logarithmic expansion in size and T-cell production, and the stroma becomes organized and expanded. At about 1 to 2 weeks (in mice), the thymus enters a period of relative homeostasis and high thymic output that continues until early adulthood. This period results in the generation of a normal complement of peripheral T cells with a diverse repertoire. After this point, the thymus gradually undergoes a process known as age-associated involution. The fully involuted thymus has significantly reduced thymopoiesis. The thymic architecture is changed, as TEC numbers decrease and the cortical and medullary compartments break down.5 Besides a dramatic decrease in the production of naive T cells, the percentage of the most immature (DN1) thymocyte subpopulation is increased in aged mice,6,7 although the number of early thymic progenitors (ETPs) is decreased.8,9
Both the initial development and the maintenance of thymic compartment organization and T-cell production require ongoing productive interactions between thymocytes and thymic stromal cells.10 Failure to maintain the postnatal thymus results in dramatically reduced T-cell production, and thus thymic involution is a critical component of aging-related immunodeficiency.11 Thus, while the identification of the cellular target(s) responsible for involution is central for understanding the mechanisms that maintain the postnatal thymus, this goal is complicated by the interdependence of the different cell populations in the thymus. Indeed, recent evidence has implicated both TEC and hematopoietic stem cell (HSC)–intrinsic defects in involution.8,12-14 Thus, the identity of the cell type(s) responsible for maintaining the steady-state postnatal thymus, and the mechanism(s) by which initiation and progression of involution occurs, remain controversial.9,15-19
The best-known regulator of fetal thymus development is the forkhead transcription factor Foxn1.20 Foxn1 is expressed in all TECs during initial thymus organogenesis and broadly during fetal stages.21-23 In the fetal thymus, Foxn1 is required cell-autonomously for initial TEC differentiation,24 is sufficient to induce both cortical and medullary differentiation,25 and has been implicated in mediating crosstalk-dependent differentiation of TECs.26 Foxn1 is also expressed broadly in postnatal TECs,23 although one report has suggested that the presence of Foxn1 protein may be differentially regulated in TECs postnatally.22,23 Although the Foxn1 gene has been studied for over a decade, previous functional studies have been restricted to fetal differentiation stages, and its postnatal function in the steady-state thymus remains to be investigated.
We have generated a novel Foxn1 allele, Foxn1lacZ, which we have previously reported has normal Foxn1 expression and function through the newborn stage.27 We now show that this allele has a reduction in Foxn1 expression beginning at about 1 week after birth. Using this novel allele of Foxn1, we showed that down-regulation of Foxn1 below 50% of normal mRNA expression levels caused thymic compartment degeneration, loss of specific TEC subsets, and reduced T-cell production, in a highly dosage-dependent manner. Our results provide the first functional evidence that Foxn1 is required to maintain the postnatal thymus. We also showed that those TEC subsets that normally express higher Foxn1 levels were most sensitive to its down-regulation, resulting in specific changes to the postnatal thymic microenvironment. These phenotypes are strikingly similar to aging-associated involution, but on a dramatically accelerated time frame, providing evidence that a TEC-intrinsic mechanism can recapitulate all aspects of involution.
Methods
Mice
Foxn1lacZ/lacZ and Foxn1cre/cre mice were generated as described previously.27 These strains have been backcrossed onto the C57Bl6/J strain for 3 to 7 generations, and are on a mixed 129Sv/C57Bl6/J background that is majority C57Bl6/J. Foxn1+/nude mice on a C57Bl6/J background were purchased from The Jackson Laboratory (Bar Harbor, ME). All analysis was performed on littermate animals generated from +/lacZ x lacZ/nu crosses whenever possible to control for genetic background variation. All the mice were maintained in a specific pathogen-free (SPF) facility at University of Georgia; experiments were approved by the University of Georgia's Institutional Animal Care and Use Committee.
Histology and immunofluorescence
For hematoxylin and eosin (H&E) staining, adult or newborn thymi were fixed with 4% paraformaldehyde (PFA) overnight, dehydrated in gradient ethanol solutions, and embedded in paraffin. Sections (10 μm) were cut and stained with H&E. Imaging was done on Leica (Deerfield, IL) MZ125 dissection scope with Q imaging digital camera (QImaging, Surrey, BC) or on a Zeiss Axioplan microscope (Jena, Germany) with an Optronics digital camera (Optronics, Goleta, CA).
X-gal staining was performed with frozen thymus sections using a standard protocol. Immunofluorescence was performed on cryosections using the following antibodies: rabbit anti–mouse K5, rabbit anti–mouse K14 (Covance Research Products, Princeton, NJ), rat anti–mouse K8 clone (Troma-1; Developmental Studies Hybridoma Bank, Iowa City, IA), or with UEA-1–biotin (Vector Laboratories, Burlingame, CA), donkey anti–rat IgG-FITC, donkey anti–rabbit IgG–Texas Red secondary antibodies, streptavidin-FITC (Jackson Immunoresearch Laboratories, West Grove, PA), goat anti–mouse Foxn1 (WHN G-20; Santa Cruz Biotechnology, Santa Cruz, CA), and rat anti–mouse MHCII (BD Pharmingen, San Diego, CA). Imaging was done on a Zeiss Axioplan 2 microsope with an AxioCam HRm digital camera. Detailed protocols for X-gal staining and immunofluoresence can be found in Document S1, available on the Blood website; see the Supplemental Materials link at the top of the online article.
Flow cytometry
Freshly isolated suspension thymocytes (106) were used for each sample. Cells were blocked by anti-CD16/32 antibody plus rat serum before staining. For tracing the kinetic phenotypic profile and counting cell numbers of thymocyte subsets, anti-CD4–APC, anti-CD8–FITC, anti-CD44–PE, and anti-CD25–biotin followed by streptavidin-PerCP were used. For analyzing the profile of T cells in total CD4−CD8− double negative (DN) subpopulations, phycoerythrin (PE)–conjugated lineage markers (anti-CD3, CD4, CD8, CD11b, CD19, B220, Gr-1, TER-119, NK1.1) combined with anti-CD25 and anti-CD44 antibodies were used. All antibodies were from either BD Pharmingen or Biolegend (San Diego, CA) if not indicated.
Thymic stromal cells (TSCs) were isolated by digesting thymic lobes with collagenase IV + I (1 mg/mL + 0.25 mg/mL) and DNase I (10 μg/mL) for 30 to 60 minutes, and depleting most thymocytes with gradient density centrifugation in 13% Opti-Prep solution (Greiner Bio-One, Longwood, FL) at 2000 rpm for 20 minutes. Enriched TSCs were incubated with anti-EpCam followed by anti–rat IgG-biotin (Jackson Immunoresearch Laboratories) and streptavidin-APC, and then stained with CD45-PE and Ly51-FITC. Cells were also stained directly with anti-CD45–APC, MHCII-PE, and UEA-1–biotin (Vector Laboratories) followed by streptavidin-PerCP for fluorescence activated cell sorting (FACS) analysis.
For PI staining, the enriched TSCs were stained by anti-CD45–FITC and then fixed with cold 70% ethanol for 30 minutes. Cells were stained in 50 μg/mL PI plus 20 μg/mL RNAse in phosphate-buffered saline (PBS; Sigma-Aldrich, St Louis, MO, and Invitrogen, Carlsbad, CA) for at least 30 minutes before analysis by flow cytometry. Flow cytometry used FL2-W versus FL2-A for doublet discrimination. All cells were acquired with a dual-laser FACS Calibur system and analyzed with CellQuest (BD Biosciences, San Jose, CA) or FlowJo (TreeStar, Ashland, OR) software.
BrdU analysis of TEC subsets
Mice were injected once intraperitoneally with 1 mg 5-bromo-2′-deoxyuridine (BrdU; Sigma-Aldrich), and then fed with BrdU-containing water (0.8 mg/mL) for 3 days. Thymic lobes were digested, and TSCs were enriched as for flow cytometry. The enriched TSCs were stained with anti-CD45–APC, anti-MHCII–FITC and UEA-1–biotin (Vector Laboratories) followed by streptavidin-PerCP mAbs for surface staining and then were fixed and permeabilized in PBS containing 1% PFA plus 0.01 Tween 20 for 24 to 48 hours at 4°C. The cells were then submitted to the BrdU, DNase detection technique using anti-BrdU–FITC mAb.
RNA preparation and real-time quantitative reverse transcriptase–polymerase chain reaction
TSCs were isolated and enriched as described above, then incubated with anti–mouse CD45-PE followed by incubation with magnetic beads anti–rat IgG (Dynal Biotech, Oslo, Norway). TSCs were purified by magnetically depleting CD45+ cells. For the purification of different subsets of TSCs, the enriched TSCs were stained with anti-CD45–APC and anti-MHCII–PE, or with UEA-1–biotin followed by streptavidin-APC and anti-CD45–PE. Cells were then sorted on a MoFlo (Dako, Ft Collins, CO). Total RNA of TSCs or the sorted cells was extracted using a QIAGEN (Valencia, CA) microRNA purification kit.
For analysis of the lacZ:cre ratio, whole thymi or primarily cultured TSCs from Foxn1lacZ/cre mice at different ages were homogenized in trizol (Invitrogen) and total RNA was extracted according to the manufacturer. The reverse transcription (RT) was performed with superscript III system (Invitrogen). Quantitative polymerase chain reaction (PCR) was performed on an ABI 7500 real-time PCR system with Taqman universal PCR mix or SYBR green PCR master mix (Applied Biosystems, Foster City, CA). Please see Document S1 for the details of reverse transcription and real-time PCR.
Primary TEC culture and demethylation treatment
Enriched TECs were prepared from Foxn1lacZ/Cre thymi as for flow cytometry, cultured and treated with 5 μM 5-Aza-dC and 300 nM TSA (Sigma-Aldrich). Please see Document S1 for details.
Additional methods are available in Document S1.
Results
Foxn1lacZ causes postnatal thymic degeneration
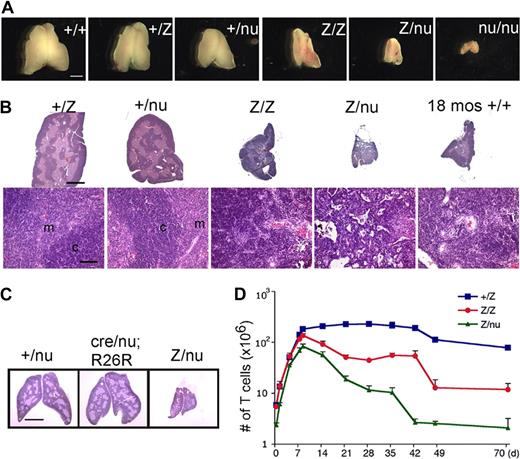
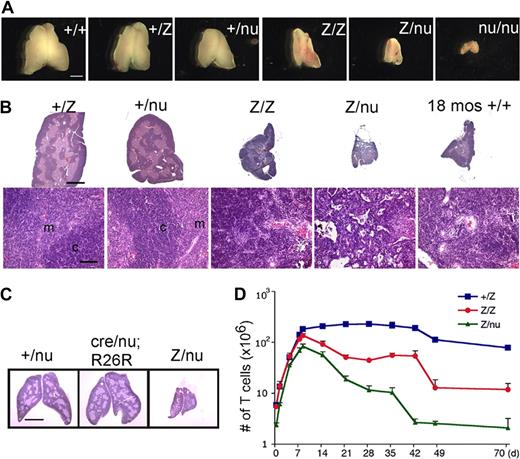
We generated a Foxn1lacZ allele with an IRES-lacZ cassette inserted into the 3′ untranslated region (UTR), generating a bicistronic message and resulting in lacZ expression that faithfully replicates Foxn1 expression in the fetal thymus.27 While Foxn1 function is normal through the newborn stage, the Foxn1lacZ/lacZ adult thymus showed significantly reduced thymus size compared with controls (Figure 1A,B). To determine whether this phenotype was due to an affect on Foxn1 dosage or to the presence of β-galactosidase protein, we crossed the Foxn1lacZ allele with the null allele, nude (nu). lacZ/nu mice had more rapid and severe postnatal thymic degeneration than lacZ/lacZ mice (Figures 1A,B, S1). In addition, expression of the lacZ gene in TECs of Foxn1cre/nu;R26R thymus had no effect on thymic architecture and was similar to +/nu (Figure 1C), showing no evidence for degeneration phenotypes associated with lacZ expression in TECs, or any interaction between reduced Foxn1 dose and the presence of β-galactosidase protein. These data indicated that the thymic degeneration phenotype depended on Foxn1 dosage and was not due to toxicity of β-galactosidase protein, or to a linked second-site mutation in the lacZ line. Comparison of the postnatal thymus phenotype of 6 genotypes, wild-type (+/+), Foxn1+/lacZ (+/lacZ), Foxn1+/nu (+/nu), lacZ/lacZ, lacZ/nu, and Foxn1nu/nu (nu/nu), revealed a close correlation between the Foxn1 dosage and the thymic phenotype both by thymus size (Figure 1A) and as quantified by thymic weight (Figure S1F). Postnatal thymocyte numbers were also reduced relative to controls in a dose-dependent fashion 1 week after birth (Figure 1D; see “Thymocyte number and differentiation defects in laczl/lacz mice”). These results further suggested that reduced expression from the Foxn1lacZ allele after birth was responsible for the degenerative phenotype in the postnatal lacZ/lacZ and lacZ/nu thymus.
The Foxn1lacZ allele causes postnatal thymic atrophy. The lacZ allele is indicated in all figures as “Z.” (A) Thymi from 5-week-old +/+, +/lacZ, +/nu, lacZ/lacZ, lacZ/nu, and nu/nu. Foxn1 dosage is closely correlated with postnatal thymus phenotype. Scale bar: 2 mm, applies to all parts of panel A. (B) Hematoxylin-and-eosin–stained paraffin sections of thymi from +/lacZ, +/nu, lacZ/lacZ, and lacZ/nu mice at 10 weeks. Thymus size was greatly reduced, and cortico-medullary architecture was dramatically disorganized in lacZ/lacZ and lacZ/nu thymus. An 18-month-old wild-type thymus is shown as an involuted thymus control. Scale bar in the top panel and bottom panel: 1 mm and 100 μm respectively, applies to all upper parts and lower parts in panel B. m indicates medulla; c, cortex. (C) Hematoxylin-and-eosin–stained sections of 3-week-old Foxn1+/nude, Foxn1cre/nude;R26R, and Foxn1lacZ/nude thymi. Scale bar: 2 mm. Foxn1cre/nude;R26R thymus showed a phenotype similar to Foxn1+/nude, indicating that the presence of β-gal protein in TECs does not cause the phenotype associated with the Foxn1lacZ allele. (D) Total thymocyte numbers in +/lacZ, lacZ/lacZ, and lacZ/nu thymi from newborn through 70 days after birth. Newborn thymocyte numbers were similar in +/lacZ and lacZ/lacZ, and increased logarithmically in the first week after birth; thymocyte number in lacZ/nu thymi was smaller due to haploinsufficiency of the nude allele, but paralleled the other 2 genotypes for the first week.
The Foxn1lacZ allele causes postnatal thymic atrophy. The lacZ allele is indicated in all figures as “Z.” (A) Thymi from 5-week-old +/+, +/lacZ, +/nu, lacZ/lacZ, lacZ/nu, and nu/nu. Foxn1 dosage is closely correlated with postnatal thymus phenotype. Scale bar: 2 mm, applies to all parts of panel A. (B) Hematoxylin-and-eosin–stained paraffin sections of thymi from +/lacZ, +/nu, lacZ/lacZ, and lacZ/nu mice at 10 weeks. Thymus size was greatly reduced, and cortico-medullary architecture was dramatically disorganized in lacZ/lacZ and lacZ/nu thymus. An 18-month-old wild-type thymus is shown as an involuted thymus control. Scale bar in the top panel and bottom panel: 1 mm and 100 μm respectively, applies to all upper parts and lower parts in panel B. m indicates medulla; c, cortex. (C) Hematoxylin-and-eosin–stained sections of 3-week-old Foxn1+/nude, Foxn1cre/nude;R26R, and Foxn1lacZ/nude thymi. Scale bar: 2 mm. Foxn1cre/nude;R26R thymus showed a phenotype similar to Foxn1+/nude, indicating that the presence of β-gal protein in TECs does not cause the phenotype associated with the Foxn1lacZ allele. (D) Total thymocyte numbers in +/lacZ, lacZ/lacZ, and lacZ/nu thymi from newborn through 70 days after birth. Newborn thymocyte numbers were similar in +/lacZ and lacZ/lacZ, and increased logarithmically in the first week after birth; thymocyte number in lacZ/nu thymi was smaller due to haploinsufficiency of the nude allele, but paralleled the other 2 genotypes for the first week.
Expression from Foxn1lacZ allele is down-regulated after birth
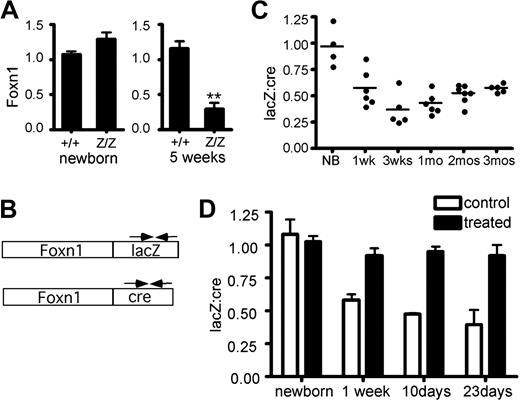
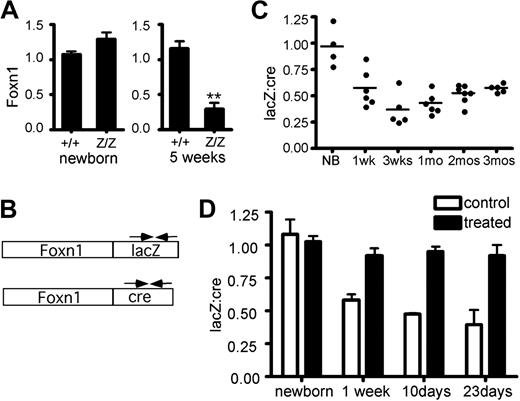
To identify the molecular basis for these phenotypes, we measured expression levels from the Foxn1lacZ allele in the postnatal thymus. Foxn1 expression in T-cell–depleted TSCs was compared between +/+ and lacZ/lacZ at different stages. Foxn1 expression in lacZ/lacZ TSCs were comparable to +/+ at the newborn stage, but reduced to 20% to 30% of +/+ at 5 weeks (Figure 2A). Foxn1 is expressed broadly during fetal stages, but may be differentially regulated in postnatal TECs.22,23 The percentage of TECs in postnatal stroma is also dynamic.28 Therefore, changes in either the TEC/TSC ratio or TEC composition could confound comparison of Foxn1 expression in bulk stroma from controls and mutants at stages after phenotypes are apparent. To avoid variability in either stromal composition or the efficiency of TEC isolation associated with phenotypic differences between control and mutant thymi, we took advantage of the Foxn1cre allele, which we generated using the same strategy as the lacZ allele.27 Unlike the lacZ/lacZ thymus, the cre/cre thymus is normal at both fetal and postnatal stages27 (data not shown). As both alleles produce a bicistronic mRNA, we used cre- and lacZ-specific primers to specifically detect the mRNAs made from each allele (Figure 2B). We measured the lacZ:cre mRNA ratio in total thymus cDNA derived from lacZ/cre mice. At 1 week, the lacZ:cre ratio in most samples was at or below 50% of newborn ratios (Figure 2C), and by 3 to 4 weeks relative LacZ levels dropped to .25 to .40. Since the Foxn1 mRNA level was consistently below 50% (ie, less than + /nu heterozygotes), this degree of down-regulation could be sufficient to cause the observed phenotypes. At later stages, the average ratios rose to the vicinity of .5 and variability decreased, although this change could represent decreased cre allele expression, as this time point coincides with a previously reported postnatal decrease in wild-type Foxn1 expression in thymic stroma.29
Foxn1 mRNA expression from the Foxn1lacZ allele is down-regulated after birth. (A) Relative quantity of Foxn1 expression in CD45− total thymic stromal cells (TSCs) of +/+ and lacZ/lacZ mice at newborn stage and at 5 weeks. At newborn stage, Z/Z and +/+ showed similar Foxn1 expression levels in TSCs. At 5 weeks, Foxn1 expression level in lacZ/lacZ thymi was reduced to about 30% of that of +/+ thymi. (B) Schematic representation of Foxn1-lacZ and Foxn1-cre bicistronic message RNA. Allele-specific primers (arrows) were used for quantitative RT-PCR. (C) Comparison of Foxn1 transcript levels from Foxn1lacZ and Foxn1cre alleles. The lacZ:cre ratio decreased at postnatal stages, suggesting that the expression of Foxn1 from the Foxn1lacZ was reduced after birth compared with that from Foxn1cre allele. P < .001. (D) lacZ and cre mRNA expression were measured with relative quantitative real-time PCR in primary culture thymic stromal cells from Foxn1lacZ/cre mice at different postnatal ages with or without demethylating drug treatment.
Foxn1 mRNA expression from the Foxn1lacZ allele is down-regulated after birth. (A) Relative quantity of Foxn1 expression in CD45− total thymic stromal cells (TSCs) of +/+ and lacZ/lacZ mice at newborn stage and at 5 weeks. At newborn stage, Z/Z and +/+ showed similar Foxn1 expression levels in TSCs. At 5 weeks, Foxn1 expression level in lacZ/lacZ thymi was reduced to about 30% of that of +/+ thymi. (B) Schematic representation of Foxn1-lacZ and Foxn1-cre bicistronic message RNA. Allele-specific primers (arrows) were used for quantitative RT-PCR. (C) Comparison of Foxn1 transcript levels from Foxn1lacZ and Foxn1cre alleles. The lacZ:cre ratio decreased at postnatal stages, suggesting that the expression of Foxn1 from the Foxn1lacZ was reduced after birth compared with that from Foxn1cre allele. P < .001. (D) lacZ and cre mRNA expression were measured with relative quantitative real-time PCR in primary culture thymic stromal cells from Foxn1lacZ/cre mice at different postnatal ages with or without demethylating drug treatment.
Since insertion of the lacZ gene into the 3′-UTR of the β-actin gene has been shown to reduce expression via allele-specific methylation of the β-actin promoter,30 we tested whether down-regulation of Foxn1lacZ is caused by hypermethylation. Due to the poor definition of the Foxn1 promoter and technical difficulties in purifying sufficient TECs for direct analysis of methylation, we chose an indirect assay to test the hypothesis. TSCs from Foxn1lacZ/cre mice were isolated and treated with demethylating agents in primary culture. The majority of the cultured TSCs were TECs (Figure S2), and variability between cultures was internally controlled by the use of the lacZ/cre genotype. The lacZ:cre mRNA ratio in the cultured TECs was measured with or without demethylation treatment. If the Foxn1lacZ allele were hypermethylated, the suppression of lacZ expression after the newborn stage (Figure 2B) should recover after demethylation treatment to be equivalent to Foxn1cre. Indeed, treated cultures at all postnatal stages had a lacZ:cre ratio close to 1 (Figure 2D), indicating that demethyation reversed the down-regulation of the lacZ allele. We obtained similar results with TECs derived from Foxn1lacZ/cre;R26YFP mice, using YFP as endogenous control for real-time RT-PCR (data not shown). These results are compatible with postnatal hypermethylation of the Foxn1lacZ locus underlying the reduced expression from this allele.
Disorganization of thymic compartments and the CMJ
The cortico-medullary junction (CMJ) is the location of the blood vessels where lymphoid progenitor cells (LPCs) enter the postnatal thymus, newly generated T cells exit to the periphery, and where at least one type of potential TEC progenitor is located.31 At 10 weeks, +/lacZ and +/nu thymi had a normal steady-state size and architecture; in contrast, the lacZ/lacZ and lacZ/nu thymi were atrophic and CMJ organization had dramatically deteriorated (Figure 1B). We also observed an increased density of blood vessels in the lacZ/lacZ and lacZ/nu thymi, possibly due to the dramatic decrease in T-cell number and the rapid collapse of thymic stroma. The phenotypes of both 10-week lacZ/lacZ and 4-week lacZ/nu thymi had a striking resemblance to an 18-month wild-type thymus (Figures 1B, S1E). The 10-week lacZ/nu thymus was even more severely affected, with an extremely high vascular density and no discernable compartmental organization (Figure 1B).
Ontogeny of defects in the thymic microenvironment
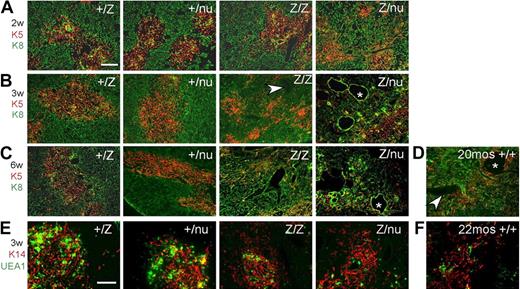
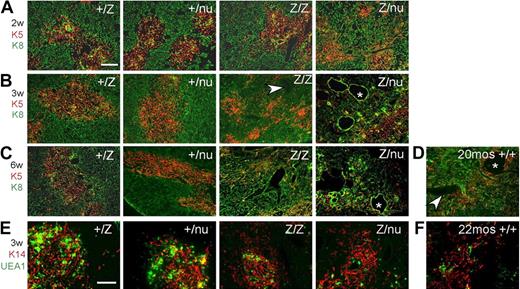
To determine the ontogeny of these phenotypes and assess them at the cellular level, we assayed TEC subsets, stromal organization, and the CMJ using histologic analysis and Keratins (K), and other differentiation markers32 from the newborn stage. In the normal thymus, medullary TECs (mTECs) form compact medullary compartments (K5+) surrounded by K8+ cortex. K14 and UEA-1 mark nonoverlapping mTEC subsets.31,33 At the newborn stage, +/lacZ and lacZ/lacZ thymi were similar, while +/nu and Z/nu mice were smaller (Figure S1A,F). Small, proto-medullary regions (K5+ and either K14+ or UEA-1+) were present and similar in all 4 genotypes, although +/nu and lacZ/nu thymi also had some scattered UEA-1+ cells (Figure S3A,B) indicating a mild TEC organization defect due to haploinsufficiency of the nu allele. By 1 week after birth, all 4 genotypes showed similar well-defined cortico-medullary organization and epithelial marker expression (Figures S1B, S3A,B). By 2 weeks of age, just after expression from the Foxn1lacZ allele decreases, the lacZ/lacZ thymi had a noticeable decrease in thymus size and cortical area (Figure S1C). TEC phenotypes were progressive and dosage-sensitive. The lacZ/lacZ thymi first lost CMJ definition at 3 weeks (Figures 3B, S1D), and by 6 weeks the lacZ/lacZ thymic architecture was disorganized (Figure 3C). In comparison, lacZ/nu thymi showed CMJ disorganization as early as 2 weeks (Figures 3A, S1C), and by 3 weeks had almost completely lost cortico-medullary organization (Figure 3B). In addition, lacZ/lacZ and lacZ/nu thymi showed reduced UEA-1+ mTECs within the K14+ medullary regions (Figure 3E). All of these TEC and stromal organization phenotypes were similar to those seen in the aged wild-type thymus34,35 (Figure 3D,F).
Progressive thymic epithelium phenotypes in Foxn1lacZ mutants. (A-D) Cryosections were stained for Keratin 8 (green) and Keratin 5 (red). Scale bar: 200 μm. Arrowhead, perivascular space; *, cystic structure. (A) Two-week +/lacZ, +/nu, and lacZ/lacZ thymi showed organized cortico-medullary architecture; lacZ/nu thymus also show a breakdown of the cortico-medullary junction (CMJ). (B) At 3 weeks, lacZ/lacZ thymus shows CMJ degeneration, and there was a more severe phenotype in lacZ/nu thymus, with no organized cortical or medullary regions. (C) At 6 weeks, lacZ/lacZ and lacZ/nu thymi had an even more severe defect compared with 3 weeks. (D) A 20-month-old +/+ thymus is shown as a normal involution control. (E,F) Frozen thymus sections stained with anti–Keratin 14 (red) and UEA-1 (green). Scale bar: 200 μm. Both the 3-week lacZ/lacZ and lacZ/nu (E) and the 22-month-old +/+ thymus (F) have fewer UEA-1+ mTECs within K14+ medullary regions.
Progressive thymic epithelium phenotypes in Foxn1lacZ mutants. (A-D) Cryosections were stained for Keratin 8 (green) and Keratin 5 (red). Scale bar: 200 μm. Arrowhead, perivascular space; *, cystic structure. (A) Two-week +/lacZ, +/nu, and lacZ/lacZ thymi showed organized cortico-medullary architecture; lacZ/nu thymus also show a breakdown of the cortico-medullary junction (CMJ). (B) At 3 weeks, lacZ/lacZ thymus shows CMJ degeneration, and there was a more severe phenotype in lacZ/nu thymus, with no organized cortical or medullary regions. (C) At 6 weeks, lacZ/lacZ and lacZ/nu thymi had an even more severe defect compared with 3 weeks. (D) A 20-month-old +/+ thymus is shown as a normal involution control. (E,F) Frozen thymus sections stained with anti–Keratin 14 (red) and UEA-1 (green). Scale bar: 200 μm. Both the 3-week lacZ/lacZ and lacZ/nu (E) and the 22-month-old +/+ thymus (F) have fewer UEA-1+ mTECs within K14+ medullary regions.
Reduced Foxn1 expression causes a loss in specific TEC subsets
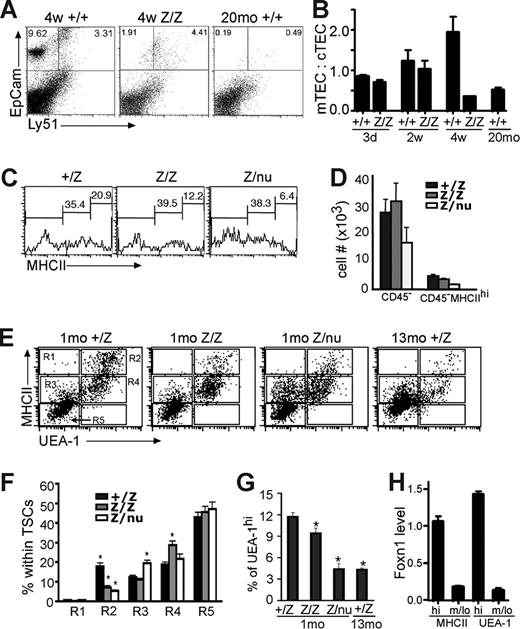
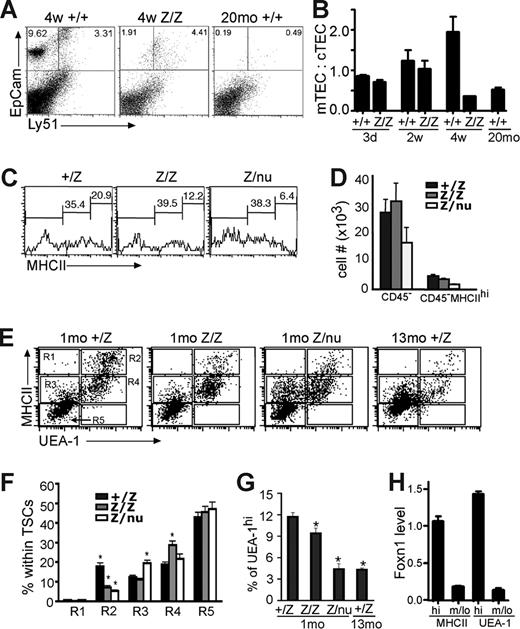
TSCs were further analyzed by flow cytometry at 3 to 4 weeks. The mTEC:cTEC ratio of lacZ/lacZ thymus was comparable to wild-type at newborn and 2 weeks, but decreased by 4 weeks, similar to aged wild-type thymus (Figure 4A,B).28 The overall percentage of MHCIIhi cells in total CD45− TSCs at 3 to 4 weeks was decreased in both lacZ/lacZ and lacZ/nu mice compared with +/lacZ (Figure 4C,D). MHCIIhiUEA-1+ mTECs were specifically reduced by about 50%, with a concomitant increase in MHCIIloUEA-1+ cells. lacZ/nu mice at this stage showed an overall decrease in UEA-1+ TECs, with a more than 50% loss of MHCIIhiUEA-1+ cells; this loss was associated with an increase in MHCIIloUEA-1− cells (Figure 4E,F R2 and R4). While the total percentage of UEA-1+ cells was similar in control and lacZ/lacZ TECs (although reduced in lacZ/nu; data not shown), the percentage of UEA-1hi cells was significantly decreased in lacZ/lacZ TECs, and the decrease in lacZ/nu TECs was similar to that seen in the 13-month thymus (Figure 4G, and data not shown). By 6 weeks, the lacZ/lacZ phenotype (not shown) was similar to the 4-week lacZ/nu phenotype, indicating that both genotypes underwent a similar progression of phenotypes but at different rates.
Specific TEC subsets are more sensitive to the loss of Foxn1. (A) Gated CD45− stromal cells from 4-week thymi were stained for EpCam and Ly51 expression. The percentage of the Ly51−EpCam+ group was greatly reduced in lacZ/lacZ thymus compared to +/+. (B) Quantitative summary of mTEC:cTEC ratio at different stages. mTEC:cTEC ratio was reduced in lacZ/lacZ thymus at 4 weeks, similar to +/+ thymus at 20 months. (C) Gated CD45− TSCs from 5-week-old thymi analyzed for the MHCII expression. The percentage of MHCIIhi cells was greatly reduced in lacZ/lacZ and Z/nu thymi. (D) Quantitative summary of the total CD45− TSCs and MHC IIhi cell number. (E) Gated CD45− stromal cells from +/lacZ, lacZ/lacZ, and laccZ/nu thymi at 1 month and +/lacZ thymus at 13 months analyzed for MHCII and UEA-1 by flow cytometry. R1-R5 gates are indicated with boxes. (F) Summary of the percentages of cells in each gate for each genotype; significant changes relative to +/lacZ controls are indicated (*P < .05). (G) Summary of the percentage of UEA-1hi cells in 1-month thymus of each genotype and 13 months +/lacZ thymus (*P < .05). (H) MHCIIhi and UEA-1hi TEC subsets express higher levels of Foxn1. Quantitative real-time PCR was performed with cDNA from sorted TEC subsets from 4-week-old wild-type thymus (see Figure S4 for sorting gates). P < .001, n = 3.
Specific TEC subsets are more sensitive to the loss of Foxn1. (A) Gated CD45− stromal cells from 4-week thymi were stained for EpCam and Ly51 expression. The percentage of the Ly51−EpCam+ group was greatly reduced in lacZ/lacZ thymus compared to +/+. (B) Quantitative summary of mTEC:cTEC ratio at different stages. mTEC:cTEC ratio was reduced in lacZ/lacZ thymus at 4 weeks, similar to +/+ thymus at 20 months. (C) Gated CD45− TSCs from 5-week-old thymi analyzed for the MHCII expression. The percentage of MHCIIhi cells was greatly reduced in lacZ/lacZ and Z/nu thymi. (D) Quantitative summary of the total CD45− TSCs and MHC IIhi cell number. (E) Gated CD45− stromal cells from +/lacZ, lacZ/lacZ, and laccZ/nu thymi at 1 month and +/lacZ thymus at 13 months analyzed for MHCII and UEA-1 by flow cytometry. R1-R5 gates are indicated with boxes. (F) Summary of the percentages of cells in each gate for each genotype; significant changes relative to +/lacZ controls are indicated (*P < .05). (G) Summary of the percentage of UEA-1hi cells in 1-month thymus of each genotype and 13 months +/lacZ thymus (*P < .05). (H) MHCIIhi and UEA-1hi TEC subsets express higher levels of Foxn1. Quantitative real-time PCR was performed with cDNA from sorted TEC subsets from 4-week-old wild-type thymus (see Figure S4 for sorting gates). P < .001, n = 3.
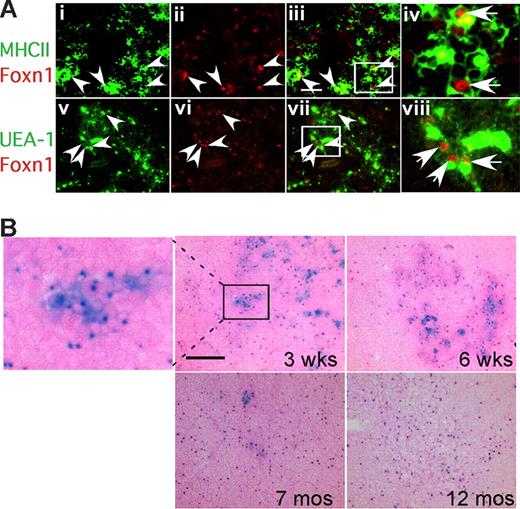
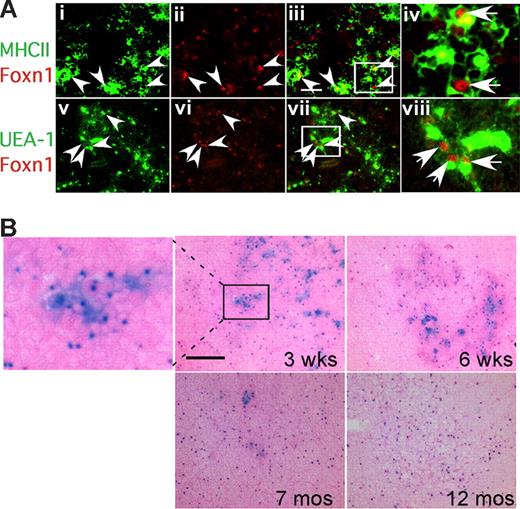
Strikingly, analysis of Foxn1 mRNA levels in these same TEC subsets showed a much higher level of expression in the most sensitive subsets, MHCIIhi and UEA-1hi TECs (Figures 4H, S4). Immunostaining on thymus sections also showed that MHCIIhi and UEA-Ihi TECs were associated with high levels of Foxn1 protein (Figure 5A; note that Foxn1 is nuclear and MHCII and UEA-1 are cell-surface markers). These data suggest that these cell types might require higher Foxn1 expression for their initial differentiation and/or to maintain their phenotype, and therefore might be more sensitive to the loss of Foxn1 expression. As decreases in these same TEC subsets have been recently reported in aged thymus,28 we investigated whether the presence of lacZhi TECs correlated with the presence of these cells. Consistent with this notion, lacZhi TECs were greatly reduced in aged +/lacZ thymus compared with younger ages (Figure 5B). Since lacZhi cells were still present even at 6 weeks in heterozygotes, the loss of these cells in lacZ/lacZ homozygotes did not simply reflect decreased expression from the lacZ allele, and was consistent with the progressive loss of TECs with highest Foxn1 levels in aged mice.
Expression of Foxn1 in postnatal thymus. (A) Cryostat sections of 4-week-old wild-type thymus stained for Foxn1 and either MHCII (i-iv), or UEA-1 (v-viii). MHCIIhi and UEA-1hi cells were associated with bright Foxn1 signals (arrowheads). Scale bar in subpanel iii: 50 μm, applies to subpanels i through iii and v through vii. (iv,viii) Higher magnification views of the boxes in subpanels iii and vii showing colocalization of Foxn1 (nuclear) and MHCII or UEA-1. (B) Loss of Foxn1hi (lacZhi) TECs in aged thymus. X-gal staining on frozen sections of Foxn1+/lacZ thymi at 3 weeks, 6 weeks, 7 months, and 12 months. Eosin counterstaining (pink) is lighter in aged thymus due to lower T-cell density.
Expression of Foxn1 in postnatal thymus. (A) Cryostat sections of 4-week-old wild-type thymus stained for Foxn1 and either MHCII (i-iv), or UEA-1 (v-viii). MHCIIhi and UEA-1hi cells were associated with bright Foxn1 signals (arrowheads). Scale bar in subpanel iii: 50 μm, applies to subpanels i through iii and v through vii. (iv,viii) Higher magnification views of the boxes in subpanels iii and vii showing colocalization of Foxn1 (nuclear) and MHCII or UEA-1. (B) Loss of Foxn1hi (lacZhi) TECs in aged thymus. X-gal staining on frozen sections of Foxn1+/lacZ thymi at 3 weeks, 6 weeks, 7 months, and 12 months. Eosin counterstaining (pink) is lighter in aged thymus due to lower T-cell density.
Decreased proliferation of TECs in lacZ/lacZ mice
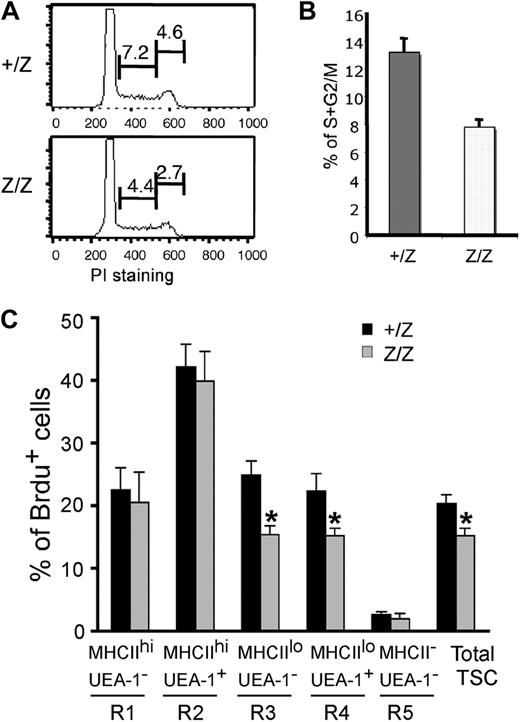
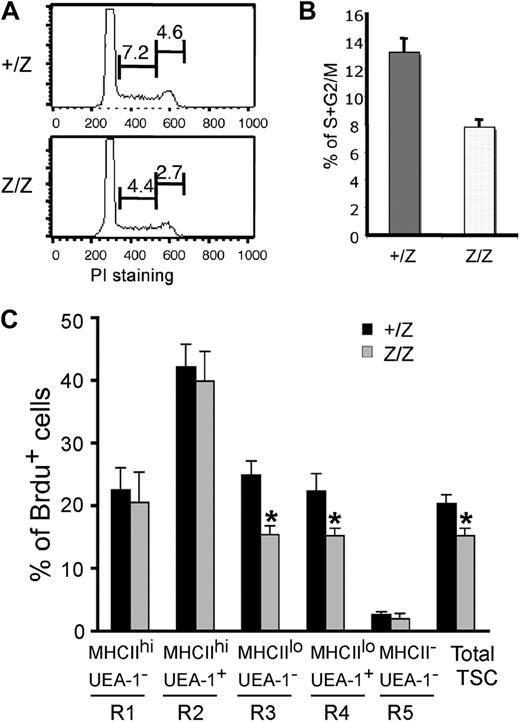
Foxn1 has been suggested to regulate TEC proliferation during fetal stages.36 To investigate the cellular mechanism involved in the loss of TEC subsets in postnatal lacZ/lacZ thymus, we analyzed proliferation in TECs. Cell-cycle analysis of CD45− stromal cells at 2 weeks showed that the percentage of total proliferating TSCs was decreased by about 40% in the lacZ/lacZ mutant at this stage (Figure 6A,B). As this time point is prior to the major changes in CMJ organization and TEC subsets, these data suggest that changes in TEC proliferation contribute to at least some of the observed phenotypes in these mice. To correlate this analysis to changes in TEC populations, we analyzed the same 5 stromal subsets (R1-R5) defined by MHCII and UEA-1 staining in Figure 4 by BrdU analysis of proliferation at 4 weeks after birth (Figures 6C, S5). Reduced proliferation was restricted to the MHCIIlo subsets (corresponding to R3 and R4 in Figure 4), while proliferation of MHCIIhi cells was unchanged (Figure 6C). These results suggest that Foxn1 regulation of proliferation is TEC subset specific.
Reduced proliferation of CD45- TSCs in Foxn1lacZ mutant mice. (A) CD45− TSCs from 2-week +/lacZ and lacZ/lacZ thymi stained for propidium iodide and analyzed for cell cycle. The percentage of the populations at S and G2/M phases was reduced in lacZ/lacZ thymus. (B) Quantitative summary of CD45− TSCs at S and G2/M phases. N = 3, P < .05, standard error is indicated. (C) BrdU analysis of proliferation on different thymic stromal subsets of +/lacZ, lacZ/lacZ, and lacZ/nu at 1 month (Figure 4E gates; Figure S5, histogram of Brdu+ cells).
Reduced proliferation of CD45- TSCs in Foxn1lacZ mutant mice. (A) CD45− TSCs from 2-week +/lacZ and lacZ/lacZ thymi stained for propidium iodide and analyzed for cell cycle. The percentage of the populations at S and G2/M phases was reduced in lacZ/lacZ thymus. (B) Quantitative summary of CD45− TSCs at S and G2/M phases. N = 3, P < .05, standard error is indicated. (C) BrdU analysis of proliferation on different thymic stromal subsets of +/lacZ, lacZ/lacZ, and lacZ/nu at 1 month (Figure 4E gates; Figure S5, histogram of Brdu+ cells).
Thymocyte number and differentiation defects in lacZ/lacZ mice
The changes in TEC phenotypes resulted in immediate, non–cell autonomous defects in thymocyte development. Newborn thymocyte numbers were similar in +/lacZ and lacZ/lacZ, and increased logarithmically in the first week after birth; lacZ/nu numbers were lower due to haploinsufficiency for nude, but paralleled the other 2 genotypes for the first week (Figure 1D). Thymocyte numbers began decreasing in both lacZ/lacZ and lacZ/nu between 1 and 2 weeks (Figure 1D), immediately after Foxn1 down-regulation (Figure 2C). A further nearly 10-fold drop in cell number occurred at 5 weeks in lacZ/lacZ with similar timing to controls, but this decrease was more severe and precipitous than the normal cell number decrease at this stage (Figure 1D).28 This decrease occurred earlier in lacZ/nu, at 4 weeks, indicating that the timing of this drop may also be influenced by Foxn1 dosage. After this point, cell numbers were relatively stable in all genotypes through at least 3 months of age.
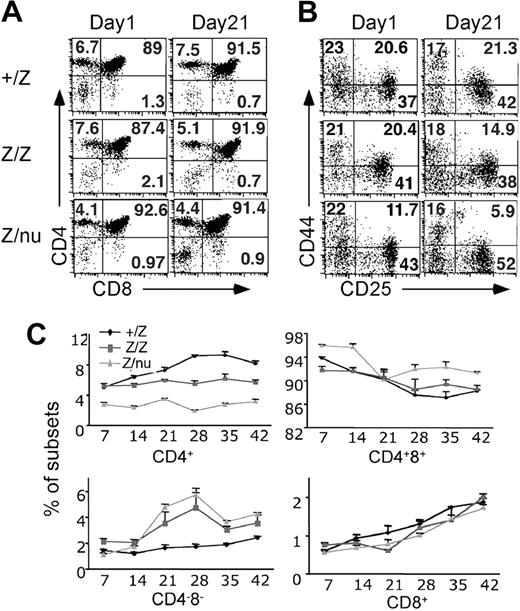
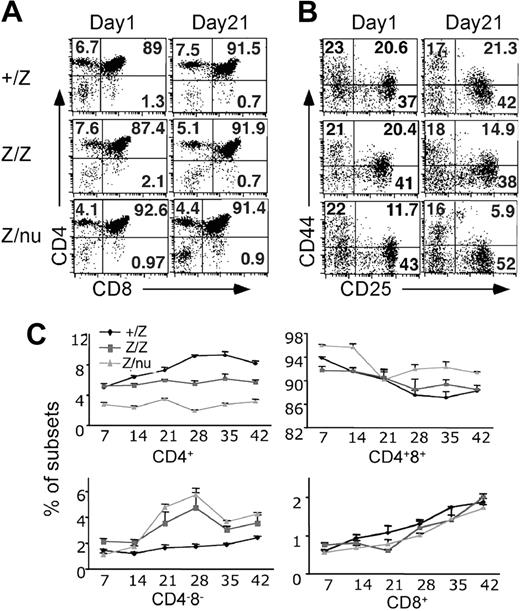
Both lacZ/lacZ and lacZ/nu mice also showed specific thymocyte development defects. The first change was a reduced frequency of CD4+ SP cells beginning at about 14 days (Figure 7A,C). By 3 weeks the DN cell percentage increased in both lacZ/lacZ and lacZ/nu mice (Figure 7B,C). Subset analysis of Lin− DN cells showed decreased DN2 cells at 3 weeks in both lacZ/lacZ and lacZ/nu, indicating a partial block or delay in the DN1-DN2 transition (Figure 7B), which is also associated with normal aged thymus.6,7 lacZ/nu mice also showed fewer CD4+ cells and a milder DN1-DN2 block at the newborn stage, reflecting haploinsufficiency for nude. Consistent with the expression of Foxn1 only in TECs, bone marrow cells from adult lacZ/nu mice showed normal thymocyte development in a wild-type host (Figure S6), confirming that these thymocyte development phenotypes were due to a TEC-intrinsic mechanism.
T-cell development was affected in mutant thymi. (A) Thymocytes from +/lacZ, lacZ/lacZ, and lacZ/nu thymi at newborn stage and 3 weeks were analyzed for CD4 and CD8 expression with flow cytometry. Numbers of DN, CD4+ SP, CD8+ SP, and DP cells are indicated as percent. (B) Gated CD4−CD8− DN populations at newborn and 3 weeks were analyzed for CD44 and CD25 expression. Numbers of DN1 (CD44+CD25−), DN2 (CD44+CD25hi), DN3 (CD44−CD25hi/lo), and DN4 (CD44−CD25−) cells are indicated as percent. (C) Summary of each subpopulation at multiple time points. Each time point represents at least 3 subjects.
T-cell development was affected in mutant thymi. (A) Thymocytes from +/lacZ, lacZ/lacZ, and lacZ/nu thymi at newborn stage and 3 weeks were analyzed for CD4 and CD8 expression with flow cytometry. Numbers of DN, CD4+ SP, CD8+ SP, and DP cells are indicated as percent. (B) Gated CD4−CD8− DN populations at newborn and 3 weeks were analyzed for CD44 and CD25 expression. Numbers of DN1 (CD44+CD25−), DN2 (CD44+CD25hi), DN3 (CD44−CD25hi/lo), and DN4 (CD44−CD25−) cells are indicated as percent. (C) Summary of each subpopulation at multiple time points. Each time point represents at least 3 subjects.
Discussion
Our data indicate that Foxn1 down-regulation in lacZ/lacZ mice resulted in collapse of the postnatal steady-state thymus in a gene dosage-sensitive manner. We show that the effects of reduced Foxn1 on TECs are specific and progressive, and include CMJ disorganization, decreased proliferation, and the loss of MHCIIhi and UEA-1hi cells, which we demonstrate are also the TECs with highest wild-type Foxn1 levels. The loss of UEA-1hi cells is consistent with our previous work showing that UEA-1+ TECs never develop in a Foxn1 constitutive hypomorph, Foxn1Δ/Δ.26 As UEA-1+ TECs are associated with medullary compartment organization,37 these cells may represent a critical target for Foxn1 function to maintain the postnatal thymus microenvironment. Our BrdU analysis also shows that TEC proliferation is specifically decreased in the MHCIIlo population, but not in the MHCIIhi TECs, even though MHCIIhi cells are decreased in number and MHCIIlo subsets increase in lacZ mutants and with age. These results suggest that reduction of Foxn1 levels affects both differentiation and proliferation, but may affect these 2 processes in opposite directions and in a subset-specific manner. This apparent contradiction suggests that while Foxn1 may control both TEC differentiation and proliferation in the postnatal thymus, these 2 functions may be independently regulated, and is clearly an avenue worth further investigation.
Both fetal TEC differentiation and maintenance of the postnatal thymus microenvironment require “crosstalk” interactions between TECs and developing thymocytes.31,38 Our previous analysis of a Foxn1 hypomorphic allele implicated Foxn1 in mediating crosstalk-dependent differentiation of TECs in the fetal thymus.26 Our current data provide the first functional evidence that Foxn1 is also required in the postnatal thymus. Thus our current data suggest that Foxn1 is required at multiple stages in the thymus. These data are reminiscent of the role of NKX2.1, which is required for thyroid organogenesis and to maintain the differentiated thyroid.39 Similar to NKX2.1, Foxn1 is dispensable for initial thymus formation, but is required for both fetal TEC differentiation and functional maintenance of the mature organ. This suggests that the endodermal organs share similar paradigms in the molecular mechanisms linking fetal differentiation and functional regulation.
The timing and progression of phenotypes and the apparently uncoupled effects on TEC differentiation and proliferation suggest that multiple defects contribute to thymic degeneration after loss of Foxn1, and that Foxn1 may be required both to maintain existing TECs and in progenitors for the generation of new TECs after turnover. Since TECs turn over every 10 to 14 days in adult mice,28,40 the appearance of TEC proliferation and thymocyte development phenotypes within 1 week of Foxn1 down-regulation suggests that decreased Foxn1 causes changes in TEC function in real-time, causing an immediate loss of thymic function. Other phenotypes appear 3 weeks after birth or later, including DN cell defects, decreased UEA-1hi TECs, and degenerative progression of initial phenotypes without further reductions in Foxn1 expression. These changes may reflect failure to replace TECs after turnover, causing reduced niche availability to promote thymocyte development.
Multiple mechanisms may also underlie the thymocyte development defects seen after Foxn1 down-regulation. The most striking finding is the immediate loss of thymocyte generation capacity, well before TEC phenotypes, morphologic defects, or specific changes in thymocyte differentiation were detected. The early loss of MHCII expression may directly affect the specific ability of TECs to promote differentiation of CD4+ thymocytes, resulting in the selective decrease in these cells. These results show that cell-autonomous changes in thymic organization are associated with reduced thymocyte number and abnormal thymocyte development that were largely consistent with changes previously reported for aging-related involution.6 The reduced TEC proliferation and subsequent loss of TEC subsets likely cause a progressive decrease in microenvironmental niches capable of supporting thymocyte development, and with the loss of compartment organization would be expected to decrease the efficiency of thymocyte differentiation. Thus, both cellular and molecular mechanisms likely contribute to the indirect loss of thymocyte development capacity in the lacZ/lacZ thymus, and may operate in the aged thymus as well.
Our data indicate that TECs may have an extreme degree of dosage sensitivity for Foxn1. It has been known for more than 3 decades that the +/nu thymus has a mild thymus size reduction,41,42 indicating that Foxn1 dose is critical for thymus development. Our data show that 50% of normal Foxn1 expression (+/nu) caused reduced thymus size and thymocyte production and mild stromal organization and thymocyte development defects. Decreasing to 30% to 40% of normal levels (lacZ/lacZ) affected the maintenance and/or phenotype of MHCII + TECs. Reduction to 20% or less (lacZ/nu) caused more rapid degeneration, as 3-week-old lacZ/nu thymi bear a striking resemblance to the 10-week lacZ/lacZ thymus, as well as the involuted 18-month wild-type thymus. By 10 weeks lacZ/nu thymi had degenerated beyond even the normal aged thymus. This Foxn1 expression level may thus be too low to maintain TECs, whereas the lacZ/lacZ phenotype appears to be a reasonably physiologic model for premature involution, and might represent a threshold Foxn1 level for thymic maintenance. These results indicate that TECs are extremely sensitive to changes in Foxn1 dosage of only 10% to 20%, reminiscent of a recent report showing similar sensitivity to bicoid protein levels in the early Drosophila embryo.43 To our knowledge this is the first demonstration of this level of dosage sensitivity for a transcription factor in vertebrates, particularly for postnatal function.
While our results are compatible with the hypothesis that the down-regulation of the Foxn1lacZ allele is due to lacZ-induced allele-specific methylation, the question of its postnatal specificity remains. A recent study showed that 3′-UTR insertion of lacZ in the β-actin locus changed the methylation of and suppressed expression from the modified allele. Interestingly, this hypermethylation only occurred in differentiated ES cells, but not in undifferentiated cells,30 suggesting that this methylation might be regulated by differentiation-related signals. This phenomenon suggests that the postnatal-specific down-regulation of the Foxn1lacZ allele may be triggered by differentiation- or temporally controlled cues. Since the effect on Foxn1 expression is due to insertion of the lacZ gene, the question of whether methylation is a normal regulator of Foxn1 expression during thymic involution remains to be seen.
Disorganization of the thymic stroma and in particular the CMJ is a morphologic hallmark of aging-related involution.44 Although thymic involution is a critical component of aging-related immunodeficiency,11 the cellular and molecular basis of postnatal thymic homeostasis and involution is not well understood. Both fetal TEC differentiation and maintenance of the postnatal thymus microenvironment require crosstalk interactions between TECs and developing thymocytes,31,38 and cell-autonomous defects in either compartment could result in the failure of crosstalk and contribute to normal thymic aging phenotypes. However, the cellular target responsible for involution is controversial, with evidence implicating both TEC- and HSC-intrinsic defects in involution.8,12-14
Our results provide the first functional evidence that Foxn1 is required for maintenance of the postnatal thymic epithelium and adult thymic homeostasis. Our data show that a change in the expression level of a single critical transcription factor in TECs is sufficient to mimic accelerated involution, causing aging-associated phenotypes that have been previously reported in both TECs28 and thymocytes.6 Furthermore, Foxn1 expression has been reported to be progressively down-regulated in wild-type TECs with aging.29 While our data do not prove that down-regulation of Foxn1 is a proximal cause of involution, the close similarity between the Foxn1lacZ-associated phenotypes and normal aging-related phenotypes raises the possibility that loss of Foxn1may contribute to normal aging-related involution, and furthermore provides evidence that a TEC-intrinsic mechanism can recapitulate both the TEC- and thymocyte-based phenotypic aspects of aging-related involution.
The increased susceptibility to infection, autoimmune diseases, and cancer in aged people is due, at least in part, to the aging of the immune system. As TEC maintenance and function and HSC differentiation in the thymus are intricately linked, the identification of Foxn1 as a central factor in postnatal TEC maintenance is critical for understanding the molecular nature of this cellular interdependence. Whether changes in Foxn1 expression in the wild-type thymus are the cause of or a downstream effect of the normal mechanisms underlying involution, investigation of the mechanisms by which Foxn1 is regulated in TECs during normal aging could provide an avenue for understanding the molecular control of thymic homeostasis, and therefore potential therapeutic targets to maintain postnatal T-cell production.
The online version of this article contains a data supplement.
The publication costs of this article were defrayed in part by page charge payment. Therefore, and solely to indicate this fact, this article is hereby marked “advertisement” in accordance with 18 USC section 1734.
Acknowledgments
We thank D.-m. Su (Univervsity of Texas at Tyler) for performing the initial experiments indicating thymic degeneration associated with the Foxn1lacZ allele while he was a member of the Manley lab. We thank C. Blackburn (University of Edinburgh), E. Richie (M. D. Anderson Science Park), and B. Condie (University of Georgia) for critical discussions, reading of the manuscript, and for sharing data prior to publication; A. Farr (University of Washington) for the TSC isolation protocol; Z. Liu (Univeristy of California, San Diego) for advice and technical help; and J. Nelson in the Center for Tropical and Emerging Global Diseases Flow Cytometry Facility at the University of Georgia for technical support for flow cytometry and cell sorting.
This work was supported by a grant to N.R.M. from the National Institute of Allergy and Infectious Diseases (NIAID) at the National Institutes of Health (NIH).
National Institutes of Health
Authorship
Contribution: L.C. performed and analyzed the histologic, immunofluorescence, and X-gal staining; primary TSC culture and demethylation assays; qRT-PCR analysis of Foxn1 expression in whole thymus, sorted TECs, and cultured TSCs; cTEC:mTEC ratios; and wrote the manuscript. S.X. performed and analyzed flow cytometric analysis of TECs and thymocytes, proliferation analysis of TECs, and the adoptive transfer experiments, and assisted in writing the manuscript. N.R.M. designed the study, analyzed data, and wrote the final manuscript. All authors discussed the results and commented on the manuscript before submission.
Conflict-of-interest disclosure: The authors declare no competing financial interests.
Correspondence: Nancy R. Manley, Department of Genetics, Paul D. Coverdell Center, 500 D.W. Brooks Drive, University of Georgia, Athens, GA 30602; e-mail: nmanley@uga.edu.
References
Author notes
*L.C. and S.X. contributed equally to this work.

