Abstract
Clinical responses of solid tumors after allogeneic human leukocyte antigen-matched stem cell transplantation (SCT) often coincide with severe graft-versus-host disease (GVHD). Targeting minor histocompatibility antigens (mHags) with hematopoiesis- and cancer-restricted expression, for example, HA-1, may allow boosting the antitumor effect of allogeneic SCT without risking severe GVHD. The mHag HA-1 is aberrantly expressed in cancers of most entities. However, an estimated 30% to 40% of solid tumors do not express HA-1 (ie, are HA-1neg) and cannot be targeted by HA-1–specific immunotherapy. Here, we investigated the transcriptional regulation of HA-1 gene expression in cancer. We found that DNA hypermethylation in the HA-1 promoter region is closely associated with the absence of HA-1 gene expression in solid tumor cell lines. Moreover, we detected HA-1 promoter hypermethylation in primary cancers. The hypomethylating agent 5-aza-2′-deoxycytidine induced HA-1 expression only in HA-1neg tumor cells and sensitized them for recognition by HA-1–specific cytotoxic T lymphocytes. Contrarily, the histone deacetylation inhibitor trichostatin A induced HA-1 expression both in some HA-1neg tumor cell lines and in normal nonhematopoietic cells. Our data suggest that promoter hypermethylation contributes to the HA-1 gene regulation in tumors. Hypomethylating drugs might extend the safe applicability of HA-1 as an immunotherapeutic target on solid tumors after allogeneic SCT.
Introduction
Allogeneic stem cell transplantation (SCT) from human leukocyte antigen (HLA)–matched donors can induce immune-mediated clinical responses in patients with solid tumors.1-3 These graft-versus-tumor (GVT) effects in the HLA-matched setting are mainly driven by minor histocompatibility antigens (mHags).4 mHags are polymorphic peptides presented in the context of HLA molecules and are expressed on normal and malignant cells. mHag alleles only present in the patient but absent in the donor lead to strong donor T-cell responses.5 However, these alloimmune responses result not only in beneficial GVT effects but also in detrimental graft-versus-host disease (GVHD). Two findings were instrumental for the separation of GVT effects from GVHD. First, mHags are derived from genes with differential (ie, restricted vs ubiquitous) tissue distribution.6 Second, ubiquitously expressed mHags (eg, H-Y) are the prime in situ targets of GVHD.7 Thus, cancer-specific mHags provide the unique option to boost the GVT effect without inducing severe GVHD. The hematopoiesis-restricted mHag HA-1 is aberrantly expressed in most solid tumors,8,9 allowing cancer cell killing by HA-1–specific cytotoxic T lymphocytes (HA-1 CTLs) in vitro.8,10 The power of HA-1 as an immunotherapeutic target on cancer cells in vivo has recently been shown by the eradication of human cancer metastases by HA-1 CTLs in immunodeficient mice.11 The immunogenicity of HA-1 is based on a single amino acid polymorphism (histidine [H]<->arginine [R])12,13 in the HA-1 protein comprising 2 alleles. Only the HA-1H but not the HA-1R allele results in highly immunogenic T-cell epitopes (in HLA-A2 and -B60).4 Consequently, T cells of an HA-1RR donor mount a strong immune response against the HA-1–expressing hematopoietic and cancer cells of an HA-1H patient after HLA-matched SCT. The frequencies of HA-1 disparities between HLA-A2+ patients and their stem cell (SC) donors differ in the various ethnic populations. The estimated disparity rates are 4.2% to 8.5% in HLA-A2+ sibling pairs and 6.8% to 12.2% in HLA-A2+–matched unrelated donor pairs.14
The expression of HA-1 mRNA in 60% to 70% of cancer cell lines and primary tumors of most entities already indicates a broad applicability of HA-1 as an immunotherapeutic target on solid tumors.8,9 Induction of HA-1 gene expression in the remaining estimated 30% to 40% of HA-1neg cancers may further extend the usability of HA-1 as an immunotherapeutic tool. However, the mechanisms of transcriptional regulation of HA-1 in solid tumors, which may provide drug targets for HA-1 induction in HA-1neg cancers, are as yet unknown. Transcriptional regulation largely results from epigenetic mechanisms, that is, heritable changes in the gene expression that are not accompanied by changes in DNA sequences. Among these highly complex and interrelated processes, histone deacetylation and promoter DNA hypermethylation are most widely investigated.15-18 Histone deacetylation is based on chromatin condensation that makes DNA inaccessible to the transcription machinery.17 DNA hypermethylation in promoter regions is another relevant epigenetic mechanism of gene silencing. DNA is methylated almost exclusively in the context of CpG dinucleotides. Approximately 50% of genes are associated with CpG islands in their promoter regions, and these CpGs are usually low in methylation.18 However, DNA methylation patterns are profoundly altered early during carcinogenesis and include both genomewide losses and regional gains in DNA methylation. DNA hypermethylation within CpG islands in the promoter region leads to transcriptional silencing of genes.16,17 Drugs are currently being investigated to reverse epigenetic events in cancer.18 Histone acetylation can be increased by histone deacetylation (HDAC) inhibitors, for example, trichostatin A (TSA).17 Conversely, expression of genes, which have been inactivated by aberrant DNA methylation, can be restored by DNA methyltransferase inhibitors, for example, by the pyrimidine nucleoside analog 5-aza-2′-deoxycytidine (5-AZA-CdR). 5-AZA-CdR can induce the expression of genes, including cancer testis antigens (CTAs),19-22 histocompatibility antigens,23,24 and tumor suppressor genes25 in cancer cells.
The aim of the present study was to identify the mechanisms that are responsible for the silencing of HA-1 in solid-tumor cells to develop an approach to convert HA-1neg cancers into targets for stem cell–based immunotherapy.
Methods
Cell culture
The following cell lines were used in this study: the lymphoma cell line Raji; the breast cancer cell lines MDA MB-231, MCF7, and MDA-MB 134-VI (from ATCC, Manassas, VA); OCUB-F (from Riken Gene Bank, Ibaraki, Japan); the renal cancer cell line BB65-RCC (kindly provided by Dr B. Van den Eynde, Ludwig Institute for Cancer Research, Brussels, Belgium); the melanoma cell line 518A2 (a kind gift of Dr P. Schrier, Leiden University Medical Center, Leiden, The Netherlands); the renal cell cancer cell line MZ1774 and the melanoma cell line Mel93.04 (kindly provided by Dr S. Osanto, Department of Clinical Oncology, Leiden University Medical Center, Leiden, The Netherlands); the renal cancer cell line BA (kindly provided by Prof G. C. de Gast, Department of Oncology, University Medical Center Utrecht, Utrecht, The Netherlands); the lung cancer cell lines GLC-2 and GLC-8 (kindly provided by Prof L. de Leij, Department of Pathology and Laboratory Medicine, University Medical Center Groningen, Groningen, The Netherlands); the skin fibroblast cell lines Fib04 and Fib02 (kind gifts of Dr Nicola Annels, Department of Pediatrics, Leiden University Medical Center, Leiden, The Netherlands); Fib01 and Fib03 (established in our laboratory); and EBV-transformed B-cell lines (EBV LCLs) H02, H03, and H05 (established in our laboratory). All cell lines were genomically typed for HLA and for the mHags HA-1 and H-Y.26 All cell lines used in this study are HLA-A*0201pos, except MDA-MB-134-VI, OCUB-F, GLC-2, GLC-8, BA, and Fib02. Cell lines were cultured in Iscove modified Dulbecco medium (BioWhittaker Europe, Verviers, Belgium) supplemented with 10% heat-inactivated fetal calf serum, 100 IU/mL penicillin and 100 IU/mL streptomycin (Greiner, Alphen a/d Rijn, The Netherlands).
Laser microdissection and sample processing
Sections of archived snap-frozen breast cancer biopsy samples of 10 different persons were transferred on 1.0-mm PEN-membrane–covered slides (Carl Zeiss B.V., Sliedrecht, The Netherlands). For each tumor sample, the histopathologic lesions of interest were first identified on hematoxylin/eosin–stained serial sections. After laser microdissection of estimated more than 4000 cells with a PALM MicroBeam System (Zeiss, Munich, Germany), the microdissected tissue samples were transferred into a 0.5-mL microfuge tube containing lysis buffer. DNA isolation was performed with a QIAamp DNA Investigator Kit (QIAGEN, Venlo, The Netherlands) according to the instructions of the manufacturer and subsequently subjected to bisulfite treatment.
Nucleic acid extraction and cDNA synthesis
RNA and genomic DNA were isolated using the TRIzol reagent (Invitrogen, Breda, The Netherlands) and QiaAmp DNA Blood Mini Kit (QIAGEN), respectively, according to the manufacturers' instruction. cDNA was synthesized with random hexameric primers (Promega, Leiden, The Netherlands) with the use of M-MLV reverse transcriptase (Promega).
RNA ligase-mediated rapid amplification of 5′ cDNA ends
The transcription start site of the HA-1 gene was determined by the First Choice 5′ RNA ligase-mediated rapid amplification of 5′ cDNA ends (RLM-RACE) kit (Ambion Europe, Huntingdon, United Kingdom) using the 5′-RACE adaptor outer primer and inner primers provided by the kit and HA-1–specific primers 5′-TGTCAGGCCCACGTGACAGG-3′ and 5′-CCCAACAGGAAAAGGCTTCG-3′. Polymerase chain reaction (PCR) products were cloned into the pGEM-T-Easy vector (Promega). Plasmid DNA was isolated using the QiaPrep Spin Miniprep Kit (QIAGEN). Sequencing was performed by Base Clear B.V. (Leiden, The Netherlands) with the use of the M13-reverse primer.
pGL3 HA-1 promoter constructs
A 1983–base pair (bp) MluI/AfeI fragment from cosmid clone pTCF-HA-113 corresponding to 50 bp upstream of the ABCA7 stop codon and 45 bp upstream of the HA-1 translation start codon was first cloned in front of the Firefly luciferase gene with the MluI and SmaI sites of the reporter plasmid pGL3-Basic (Promega) to create pMluI/AfeI. Deletion constructs pKpnI/AfeI, pSacI/AfeI, pSmaI/AfeI, and pNaeI/AfeI were generated by restriction digestion of pMluI/AfeI construct with KpnI, SacI, SmaI, and NaeI, respectively, in combination with NcoI. DNA fragments were purified with the Zymoclean Gel DNA Recovery Kit (Zymo Research, Orange, CA) and ligated into pGL3-Basic digested with NcoI and the above-named restriction enzymes, except the NaeI/NcoI fragment in which the SmaI sites of pGL3-Basic were used.
Transfection and luciferase reporter assays
All transfections were performed in triplicate by electroporation (Genepulser; Bio-Rad, Hercules, CA) at 250 V and 960 μF with 107 Raji cells with the use of 10 μg of the reporter construct. Transfection efficiency and firefly luciferase activity were normalized by cotransfection with 1 μg pRL-SV40 (Promega), a construct with Renilla luciferase expressed under the control of the SV40 promoter. Luciferase activities were measured with the use of the Dual-Glo Luciferase assay system (Promega) according to the manufacturer's instructions at 48 hours after the transfection.
Sodium bisulfite genomic DNA modification, combined bisulfite restriction analysis, and DNA sequencing
Sodium bisulfite genomic DNA modification and the subsequent DNA extraction were performed with the EZ DNA Methylation-Gold Kit (Zymo Research) according to the instructions of the manufacturer. Subsequently, 2 rounds of PCR were performed to obtain 2 fragments around the HA-1 promoter/exon I region. For the long fragment, primers for the first round of PCR were 5′-GTTCGGGAGTGAGAGTTAG-3′ and 5-CGAATCCCTATCCCCCTAC-3′, which amplified a PCR product of 559 bp; for the second round of PCR, 5′-AGCGTTAGGTAGGGGTTTT-3′ and 5′-AAATAAAAAAAATTTTCATAAACTC-3′ were used, which amplified a 406-bp product. For the short fragments, primers for the first round of PCR were 5′-TTTTTTTGTTGGGGGGAGGG-3′ and 5′-ACCACTCCCAAAATCCCTAC-3′, which amplified a PCR product of 458 bp; for the second round of PCR, 5′-GAGTTTATGAAAATTTTTTTTATTT-3′ and 5′-ACCTCTCTACTATAACCCCTACC-3′ were used, which amplified a 224-bp product. PCR conditions for all reactions were as follows: 95°C for 2 minutes, then at 95°C for 1 minute, 47°C for 1 minute and 72°C for 1 minute for 35 to 40 cycles, and finally 72°C for 5 minutes. For the combined bisulfite restriction analysis (COBRA), PCR products of the long fragment were purified (DNA Clean and Concentrator-5 Kit; Zymo Research) and HinfI digested (New England Biolabs, Westburg, Leusden, The Netherlands). The digested PCR products were separated on a 2% agarose gel electrophoresis and visualized by ethidium bromide staining. For sequencing, PCR products were then extracted from the agarose gel with the Zymoclean Gel DNA Recovery Kit (Zymo Research) and cloned into the pGEM-T Easy plasmid vector (Promega). Seven to 10 independent DNA clones were sequenced by Base Clear B.V. with the use of the M13 reverse sequencing primer.
In vitro treatment with 5-AZA-CdR and TSA
Cells were treated with 1, 10, or 100 μM 5-AZA-CdR (Sigma-Aldrich, St Louis, MO) for 72 or 192 hours or with 500 nM TSA (Sigma-Aldrich) for 24 hours. In the presence of 5-AZA-CdR, media were refreshed every 24 hours.
Real-time quantitative PCR to determine HA-1 expression levels
PCR amplification and quantification were performed using the iQ Real Time PCR detection system and iQ SYBR Green supermix (Bio-Rad). Expression levels were calculated with the IQ5 program (Bio-Rad) with the comparative Ct method, in which relative expression level = 2− (test ΔCt − control ΔCt), with ΔCt corrected for 18S RNA expression. Primers for 18S RNA were 5′-AACGGCTACCACATCCAAGG-3′ and 5′-ACCAGACTTGCCCTCCAATG-3′. To determine HA-1 expression levels, primers 5′-CGTCGAGGACATCTCCCATC-3′ and 5′-GCCTCAAGGAGGTCGTCA-3′ were used that amplified a 99-bp fragment from the HA-1 cDNA. Amplification conditions were as follows: 95°C for 3 minutes, then 40 cycles at 95°C for 15 seconds and 62°C for 45 seconds. The relative levels of expression of the HA-1 gene in the test samples were calculated as percentages of the levels of expression in Raji cells, which was used as a reference cell line. The cutoff (2%) between HA-1–positive and –negative cell lines is based on the mean HA-1 mRNA expression level in fibroblasts compared with Raji cells plus 2 SD. Expression levels of HA-1 after 5-AZA-CdR and TSA treatment were related to unstimulated conditions. For HA-1 allele–specific PCR, primers 5′-CTTAAGGAGTGTGTGCTGCA-3′ and 5′-CTTAAGGAGTGTGTGTTGCG-3′ were used for the HA-1H and HA-1R alleles, respectively, together with the common primer 5′-TCCAGATCATTGTTGCTCTC-3′. A 200-bp fragment was amplified for both alleles. Amplification conditions were as follows: 94°C for 3 minutes, then 10 cycles at 94°C for 15 seconds and 67°C for 45 seconds, followed by 30 cycles at 94°C for 15 seconds, 63°C for 45 seconds, and 72°C for 30 seconds. The relative levels of expression of the HA-1 alleles in the test samples were calculated as percentages of the levels of expression in MDA-MB 231, which was used as a reference cell line.
Generation of HA-1– and H-Y–specific CTLs
The HA-1 CTL clone 2.12 was generated from peripheral blood mononuclear cells (PBMCs) of HLA-A2+/HA-1RR healthy donors as described.27 The HA-1 CTL clone 3HA15 and H-Y CTL clone 21-17 were isolated from patients after allogeneic SCT.6,28 Patient material was obtained with informed consent in accordance with the Declaration of Helsinki and institutional review board approval from the Leiden University Medical Center.
Enzyme-linked immunospot and cytotoxicity assay
A 96-well plate (MultiScreen 96-well filtration plate; Millipore, Billerica, MA) coated with an interferon-γ antibody (mAb 1-D1K; Mabtech, Cincinnati, OH) 5 μg/mL in PBS for 2 hours at room temperature. After blocking the plate with 5% human serum in IMDM for 30 minutes, 5 × 10³ CTLs were coincubated with 5 × 10³ tumor cells. For the detection of spots, plates were incubated with a biotin-labeled anti–human IFN-γ antibody (Mab 7-B6-biotin; Mabtech) and a streptavidin–alkaline phosphatase complex (Extravidine alkaline phosphatase; Sigma, Zwijndrecht, The Netherlands). Staining was performed with substrate (BCIP-NBT; Sigma). Spots were counted with the use of an automated enzyme-linked immunospot (ELISPOT) reader (Bio-Sys Bioreader, Karben, Germany). Tumor cell killing by CTLs was tested in a standard 4-hour 51Cr release assay as described.27
Results
HA-1 gene expression in human tumor cell lines
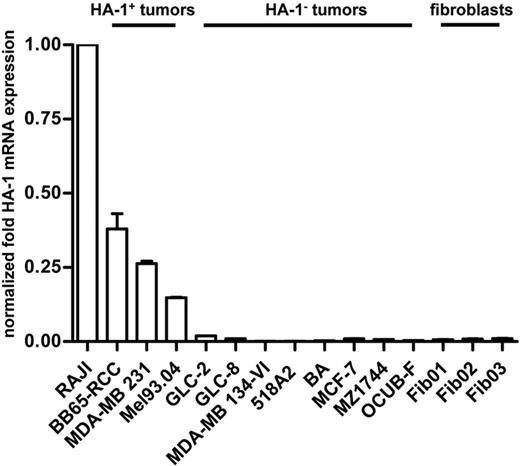
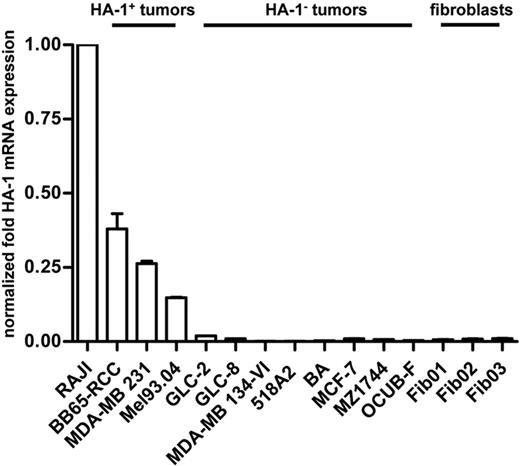
HA-1 mRNA expression in the lymphoma cell line Raji, in various solid-tumor cell lines, and in fibroblasts was determined by quantitative real-time PCR (qPCR). Highest HA-1 expression levels were found in Raji cells. On the basis of on a cutoff of 2% compared with the HA-1 expression level in Raji cells, tumor cell lines were subdivided into the HA-1–expressing (ie, “HA-1pos”) tumor cell lines BB65-RCC, MDA-MB 231, and Mel94.03 and into the HA-1–nonexpressing (ie, “HA-1neg”) tumor cell lines GLC-2, GLC-8, MDA-MB 134-VI, 518A2, BA, MCF-7, MZ1744, and OCUB-F. Mean HA-1 mRNA expression in the HA-1pos tumor cell lines BB65-RCC, MDA-MB 231, and Mel94.03 was 37%, 25%, and 15%, respectively, compared with Raji cell lines. The fibroblast cell lines Fib01, Fib02, and Fib03 showed almost undetectable levels of HA-1 mRNA (Figure 1), which is in accordance with our earlier findings on the hematopoietic and cancer-restricted expression of the HA-1 gene.6,8
HA-1 mRNA expression levels in tumor and fibroblast cell lines. Depicted are the relative levels of HA-1 mRNA expression in different cell lines with the use of Raji lymphoma cells as reference. Results were normalized with 18S mRNA. On the basis of a cutoff of 2% compared with the normalized HA-1 mRNA expression level in Raji cells, tumor cell lines were subdivided into HA-1–expressing (ie, HA-1pos) and HA-1–nonexpressing (ie, HA-1neg) tumor cell lines.
HA-1 mRNA expression levels in tumor and fibroblast cell lines. Depicted are the relative levels of HA-1 mRNA expression in different cell lines with the use of Raji lymphoma cells as reference. Results were normalized with 18S mRNA. On the basis of a cutoff of 2% compared with the normalized HA-1 mRNA expression level in Raji cells, tumor cell lines were subdivided into HA-1–expressing (ie, HA-1pos) and HA-1–nonexpressing (ie, HA-1neg) tumor cell lines.
Transcription start site and promoter of the HA-1 gene
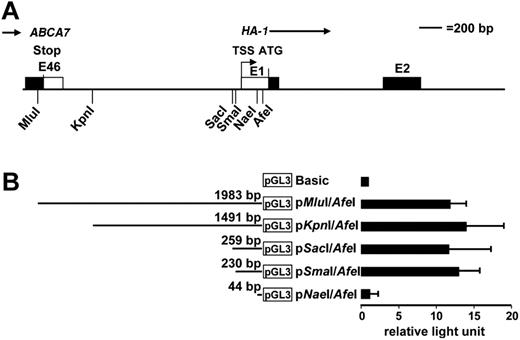
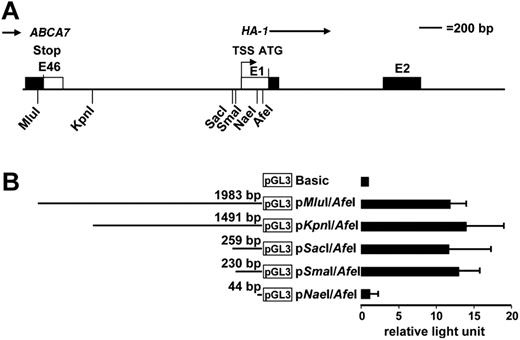
The HA-1 gene (KIAA0223) is localized on chromosome 19 p13.329 ; it contains 23 exons and is flanked by the ABCA7 gene and the RNA polymerase II subunit E gene.30 Our 5′ RACE analysis showed the transcription start site (TSS) of the HA-1 gene at −239 bp 5′ of the HA-1 translation start site (ATG; Figure 2A). To locate the HA-1 promoter, a 1983-bp MluI/AfeI DNA fragment (covering the whole ABCA7/HA-1 intergenic region and the 5′ end of the HA-1 exon I) was fused to the firefly luciferase reporter gene in the pGL3-Basic vector to generate the construct pMluI/AfeI (Figure 2B). Transient transfection of this construct into the lymphoma cell line Raji resulted in high luciferase activity compared with the pGL3-Basic construct, showing promoter activity contained within the pMluI/AfeI DNA fragment. To further narrow the location of the HA-1 promoter, the pMluI/AfeI construct was sequentially deleted from the 5′ end, and reporter activity was determined. All deletion constructs showed high luciferase activity comparable with pMluI/AfeI, except pNaeI/AfeI, which lacks the TSS (Figure 2B). Therefore, we concluded that the HA-1 promoter is located within a 230-bp sequence between the SmaI (−278 bp) and AfeI (−48 bp) restriction sites.
Analysis of the HA-1 TSS and promoter. (A) Depicted is the restriction map of the intergenic region between the ABCA7 gene and the HA-1 gene. The transcription start site (TSS) of the HA-1 gene was determined by 5′ RACE analysis and located −239 bp 5′ of the HA-1 translation start site (ATG). (B) The presence of promoter activity in proximity to the TSS was investigated with deletion constructs of the intergenic region. Depicted are the constructs fused to luciferase reporter (pGL3-Basic). Luciferase activity was determined on transient transfection of the deletion constructs into Raji; x-axis indicates that results were normalized to pGL3-Basic (relative light unit) and are shown as the mean (±SD) of 3 independent experiments.
Analysis of the HA-1 TSS and promoter. (A) Depicted is the restriction map of the intergenic region between the ABCA7 gene and the HA-1 gene. The transcription start site (TSS) of the HA-1 gene was determined by 5′ RACE analysis and located −239 bp 5′ of the HA-1 translation start site (ATG). (B) The presence of promoter activity in proximity to the TSS was investigated with deletion constructs of the intergenic region. Depicted are the constructs fused to luciferase reporter (pGL3-Basic). Luciferase activity was determined on transient transfection of the deletion constructs into Raji; x-axis indicates that results were normalized to pGL3-Basic (relative light unit) and are shown as the mean (±SD) of 3 independent experiments.
Identification and characterization of a CpG island in the HA-1 locus
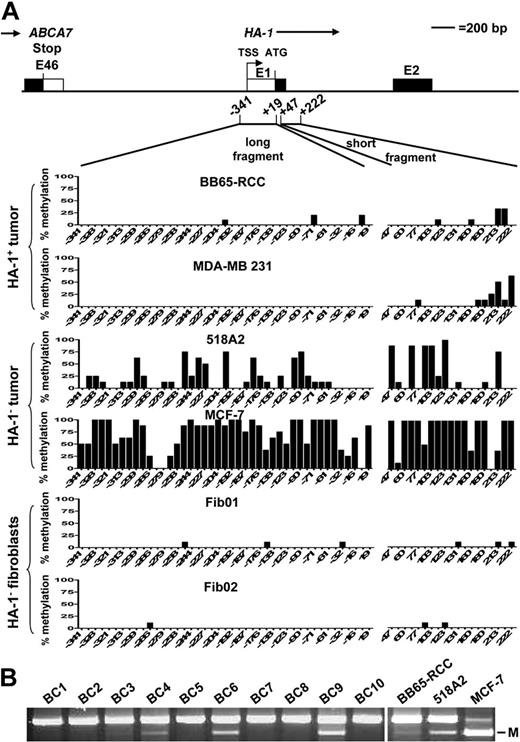
Densely clustered cytosines, so called CpG islands, are frequently located within promoter regions and are the targets of methylation in carcinogenesis.16,17 CpG islands have been defined by Takai and Jones31 as genomic regions greater than 500 bp, with a G+C content greater than 55% and an observed CpG/expected CpG ratio greater than 0.65. To identify the presence of a CpG island in proximity to the HA-1 locus, we analyzed a 4-kb fragment (spanning 2 kb upstream and downstream of the HA-1 translation start site, ATG) using the CpG island searcher (http://cpgislands.usc.edu/cpg.aspx).32 The sequence spanning from −821 to +311 was identified as CpG island33 (Figure S1, available on the Blood website; see the Supplemental Materials link at the top of the online article), thus covering the identified HA-1 promoter region. Subsequently, we characterized the methylation status within this CpG island in different cell lines. Initial Southern analysis with methylation-sensitive or -resistant endonucleases showed that the HA-1 promoter/exon I region enclosed in this CpG island is methylated in HA-1neg tumor cell lines (data not shown). The extent of CG methylation in the HA-1 promoter region and exon I was determined by bisulfite sequencing analysis of a long (−341 to +19) and a short DNA fragment (+47 to +222; Figure 3). High levels of CG methylation in the long and short fragments were detected in the HA-1neg tumor cell lines 518A2, MCF-7 (Figure 3), MDA-MB 134-VI, and OCUB-F (Figure S2A). The HA-1pos tumor cells BB65-RCC, MDA-MB 231 (Figure 3) and Mel93.04 (Figure S2A) showed methylation of only a few CG sites within the short fragment and almost no CG methylation in the long fragment. The fibroblasts Fib01 and Fib02 contained almost no CG methylation within both fragments. Further screening for HA-1 promoter hypermethylation was performed by COBRA which determines methylation of a CG site at position −227 (which is highly methylated in HA-1neg tumor cell lines). COBRA showed HA-1 promoter methylation in the HA-1neg tumor cell lines MZ1744 and BA but not in GLC-2 and GLC-8. Furthermore, HA-1 promoter methylation was absent in a broad spectrum of HA-1pos hematopoietic cells (Figure S2B). Overall, these results suggest a close association between DNA hypermethylation in the HA-1 promoter region and exon I and the absence of HA-1 mRNA expression in cancer cells. Moreover, there was no indication for HA-1 promoter hypermethylation in HA-1neg normal nonhematopoietic cells and in HA-1pos hematopoietic cells. Next, we investigated HA-1 promoter hypermethylation in clinical tumors. Hereto, tumor cell containing areas from frozen sections of breast cancers were enriched by laser microdissection and subjected the DNA to COBRA. Likewise in our findings in tumor cells lines, hypermethylation was also present in the HA-1 promoter of at least 2 of 10 clinical samples (Figure 3B, BC6 and 9; BC4 is weakly methylated).
Analysis of the methylation status of the HA-1 promoter in cell lines and primary breast cancers. Genomic DNA extracted from various HA-1pos and HA-1neg tumor cell lines, fibroblasts, and primary breast cancers was subjected to sodium bisulfite treatment. (A) A long (−341 to +19) and a short (+47 to +222) DNA fragment were amplified by PCR and were subsequently analyzed by sequencing; y-axis indicates percentage of methylated cytosines in 7 to 10 independent DNA clones per cell line; x-axis, position of the CpG dinucleotides with respect to the ATG translation start site (+1). (B) COBRA of laser-microdissected primary breast cancer samples. BC1 to BC10 indicate invasive breast cancers; M, methylation.
Analysis of the methylation status of the HA-1 promoter in cell lines and primary breast cancers. Genomic DNA extracted from various HA-1pos and HA-1neg tumor cell lines, fibroblasts, and primary breast cancers was subjected to sodium bisulfite treatment. (A) A long (−341 to +19) and a short (+47 to +222) DNA fragment were amplified by PCR and were subsequently analyzed by sequencing; y-axis indicates percentage of methylated cytosines in 7 to 10 independent DNA clones per cell line; x-axis, position of the CpG dinucleotides with respect to the ATG translation start site (+1). (B) COBRA of laser-microdissected primary breast cancer samples. BC1 to BC10 indicate invasive breast cancers; M, methylation.
5-AZA-CdR and TSA induce HA-1 expression in HA-1neg cancer cells
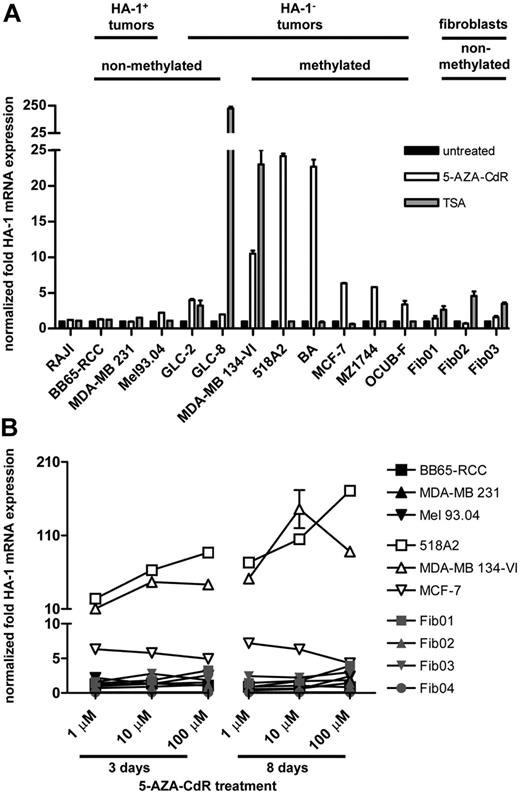
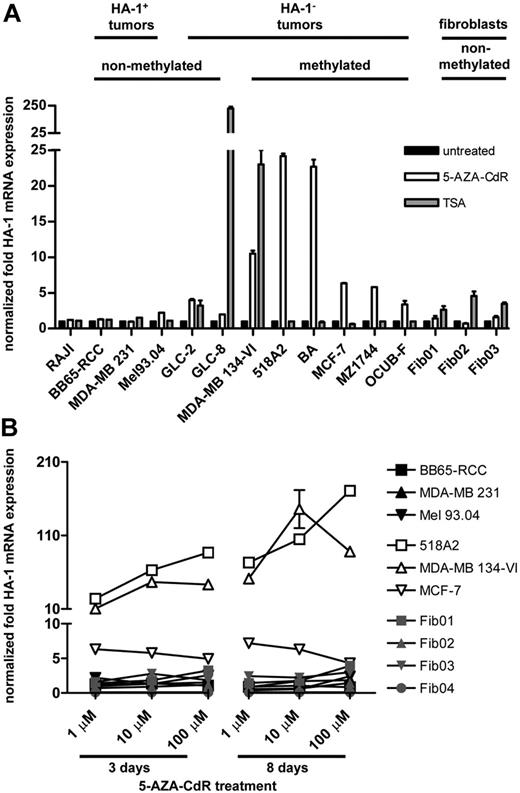
We questioned whether hypomethylating and/or deacetylating agents can modulate HA-1 gene expression in cancer cells. Therefore, we determined HA-1 mRNA expression levels in Raji cells, in HA-1pos and HA-1neg tumor cell lines, and in fibroblasts after treatment with 1 μM of the hypomethylating agent 5-AZA-CdR for 72 hours or with 500 nM of the HDAC inhibitor TSA for 24 hours (Figure 4A). After 5-AZA-CdR treatment, HA-1 mRNA expression was enhanced more than 2-fold compared with the untreated controls in the HA-1neg tumor cell lines GLC-2 (mean HA-1 up-regulation, 3.9 times), MDA-MB 134-VI (10.5 times), 518A2 (24.5 times), BA (22.6 times), MCF-7 (6.5 times), MZ1744 (5.0 times), and OCUB-F (3.4 times). In contrast, HA-1 mRNA expression remained largely unchanged on 5-AZA-CdR treatment in Raji cells; in the HA-1pos tumor cell lines BB65-RCC, MDA-MB 231, and Mel93.04; and in the HA-1neg fibroblast cell lines Fib01, Fib02, and Fib03. More than 2-fold HA-1 mRNA up-regulation after TSA treatment was seen in the tumor cell lines GLC-2 (3.6 times), GLC-8 (228.3 times), MDA-MB 134-VI (22.9 times) and in the fibroblasts Fib01 (2.6 times), Fib02 (4.5 times), and Fib03 (3.4 times), whereas HA-1 expression remained largely unchanged in Raji and all other tumor cell lines.
HA-1 mRNA expression levels in response to 5-AZA-CdR or TSA treatment. (A) HA-1 mRNA expression levels were determined in different cell lines by qPCR after treatment with 1 μM 5-AZA-CdR for 72 hours or with 500 nM TSA for 24 hours; x-axis indicates tumor cell lines with nonmethylated or methylated HA-1 promoter and fibroblasts; y-axis, increase of the HA-1 mRNA expression levels after treatment in relation to unstimulated conditions. (B) HA-1 mRNA expression levels were determined in different cell lines with increasing doses and durations of 5-AZA-CdR treatment; x-axis indicates doses (1, 10, and 100 μM) and durations (3 and 8 days) of 5-AZA-CdR treatment; y-axis, increase of the HA-1 mRNA expression levels after treatment in relation to unstimulated conditions. Error bars reflect SEM. Values for gene expression that do not show error bars reflect data in which the SEM was too small to be depicted graphically.
HA-1 mRNA expression levels in response to 5-AZA-CdR or TSA treatment. (A) HA-1 mRNA expression levels were determined in different cell lines by qPCR after treatment with 1 μM 5-AZA-CdR for 72 hours or with 500 nM TSA for 24 hours; x-axis indicates tumor cell lines with nonmethylated or methylated HA-1 promoter and fibroblasts; y-axis, increase of the HA-1 mRNA expression levels after treatment in relation to unstimulated conditions. (B) HA-1 mRNA expression levels were determined in different cell lines with increasing doses and durations of 5-AZA-CdR treatment; x-axis indicates doses (1, 10, and 100 μM) and durations (3 and 8 days) of 5-AZA-CdR treatment; y-axis, increase of the HA-1 mRNA expression levels after treatment in relation to unstimulated conditions. Error bars reflect SEM. Values for gene expression that do not show error bars reflect data in which the SEM was too small to be depicted graphically.
Next, we investigated whether the effect of 5-AZA-CdR on HA-1 mRNA expression is dose and duration dependent. Therefore, HA-1 mRNA expression in tumor cells and fibroblasts was quantified after incubation with increasing doses (Figure 4B; Figure S3) and durations of 5-AZA-CdR (Figure 4B). The HA-1neg tumor cell lines 518A2 and MDA-MB 134-VI showed a dose- and time-dependent up-regulation of HA-1 mRNA, reaching maximum values of 170.1 times after treatment with 100 μM or of 143.6 times after treatment with 10 μM 5-AZA-CdR for 8 days, respectively. In addition, the HA-1neg cell lines GLC-2 (9.9 times), GLC-8 (12.3 times), BA (23.9 times), MZ1174 (5.9 times), and OCUB-F (4.2 times) further increased HA-1 mRNA expression after treatment with 10 μM instead of 1 μM 5-AZA-CdR for 3 days (rFigure S3). In contrast, HA-1 mRNA expression in the HA-1neg MCF-7 cell line reached its maximum with 1 μM 5-AZA-CdR for 3 days. The relative increase of HA-1 mRNA expression remained less than 4-fold in the HA-1pos tumor cell lines and fibroblasts with increasing doses and duration of 5-AZA-CdR treatment (Figure 4B). Overall, HA-1 expression was induced in 8 of 8 HA-1neg tumor cell lines in response to 5-AZA-CdR and in 3 of 8 HA-1neg tumor cell lines in response to TSA. However, because TSA also induced HA-1 expression in normal nonhematopoietic cells, we subsequently focused our functional immunologic studies on the effects of hypomethylation.
5-AZA-CdR induces recognition of HA-1neg cancer cells by HA-1 CTLs
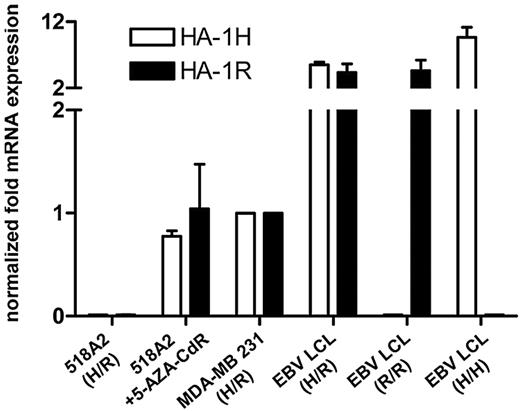
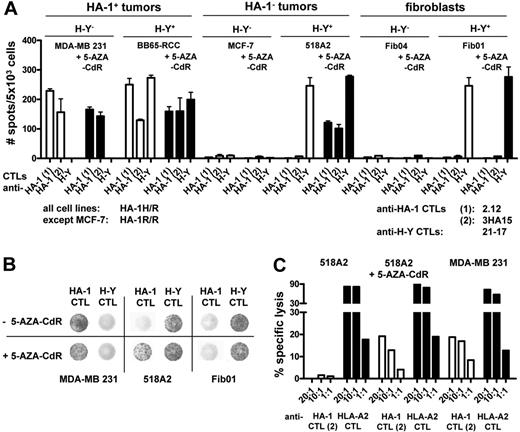
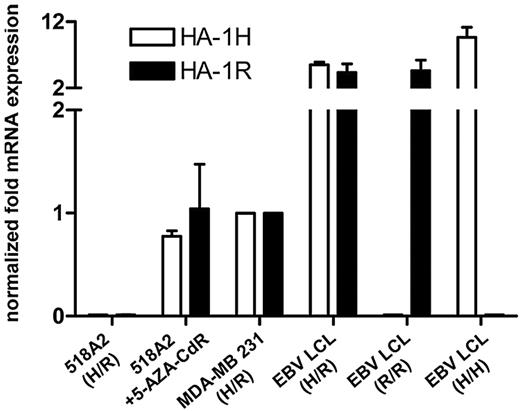
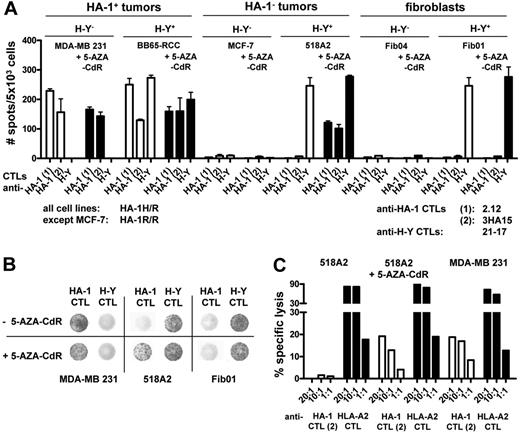
The mHag HA-1 is presented in HLA-A2 and only the HA-1H allele is immunogenic. Among the HA-1neg tumor cells used in this study, only 518A2 was positive both for HLA-A*0201 and HA-1H. Thus, 518A2 tumor cells were selected as relevant tumor targets to evaluate whether HA-1 protein induction in HA-1neg tumor cells suffices for HA-1 CTL recognition. The PCRs performed so far showed HA-1 induction on 5-AZA-CdR treatment, but they did not distinguish between the immunogenic HA-1H or the nonimmunogenic HA-1R allele. To ensure the induction of the immunologically relevant HA-1H allele in tumor cells, we quantified HA-1H and HA-1R mRNA with HA-1 allele–specific qPCR. 518A2 tumor cells (HA-1H/R heterozygous) showed up-regulation of both the immunogenic HA-1H and nonimmunogenic HA-1R allele on 5-AZA-CdR treatment (Figure 5). Subsequently, we determined the functional CTL recognition of HA-1neg and HA-1pos tumor cells and fibroblasts on 5-AZA-CdR treatment in an ELISPOT assay. Indeed, 5-AZA-CdR–treated 518A2 tumor cells were well recognized by HA-1 CTL clones, whereas untreated 518A2 tumor cells were not recognized. HA-1 CTL recognition of the HA-1pos tumor cell lines BB65-RCC and MDA-MB 231 (both HLA-A2/HA-1H) remained largely unchanged on 5-AZA-CdR treatment compared with untreated tumor cells (Figure 6A,B). No recognition by HA-1 CTLs was observed in HA-1neg MCF-7 tumor cells (HLA-A2/HA-1R) and in the fibroblasts Fib01 and Fib04 (both HLA-A2/HA-1H) before and after 5-AZA-CdR treatment. Recognition of the ubiquitously expressed Y chromosome–encoded mHag H-Y in male-derived tumor cells (BB65-RCC, 518A2) and fibroblasts (Fib01) by H-Y CTL clones was not affected by 5-AZA-CdR treatment (Figure 6A,B). Subsequently, we investigated whether 5-AZA-CdR also facilitates lysis of HA-1neg tumor cells by HA-1 CTLs in a chromium release assay. We found that 5-AZA-CdR-treated 518A2 tumor cells were lysed by HA-1 CTLs at comparable levels as the HA-1pos tumor cell line MDA-MB 231 (Figure 6C; controls in Figure S4).
5-AZA-CdR induces both HA-1 alleles in HA-1neg tumor cells. mRNA expression of the HA-1 H and R alleles was determined by allele-specific qPCR. The x-axis indicates 518A2 melanoma cells before and after treatment with 100 μM 5-AZA-CdR for 8 days, MDA-MB 231 tumor cells and control EBV LCLs (HA-1H/R, HA-1R/R, and HA-1HH); y-axis, mRNA expression levels of the HA-1 H and R alleles in relation to the expression levels in MDA-MB 231. EBV LCLs indicate Epstein-Barr virus–transformed B cells. Error bars reflect SEM. Values for gene expression that do not show error bars reflect data in which the SEM was too small to be depicted graphically.
5-AZA-CdR induces both HA-1 alleles in HA-1neg tumor cells. mRNA expression of the HA-1 H and R alleles was determined by allele-specific qPCR. The x-axis indicates 518A2 melanoma cells before and after treatment with 100 μM 5-AZA-CdR for 8 days, MDA-MB 231 tumor cells and control EBV LCLs (HA-1H/R, HA-1R/R, and HA-1HH); y-axis, mRNA expression levels of the HA-1 H and R alleles in relation to the expression levels in MDA-MB 231. EBV LCLs indicate Epstein-Barr virus–transformed B cells. Error bars reflect SEM. Values for gene expression that do not show error bars reflect data in which the SEM was too small to be depicted graphically.
CTL recognition of HA-1neg tumor cells after 5-AZA-CdR treatment. (A) HA-1pos and HA-1neg tumor cells and fibroblasts (all HLA-A2pos) were treated with 100 μM 5-AZA-CdR for 8 days. Depicted is the response of the HA-1H–specific CTL clones 2.12 and 3HA15 and the H-Y–specific CTL clone 21-17 toward target cells before and after treatment with 5-AZA-CdR; y-axis indicates number of interferon-γ spots in the ELISPOT analysis per 5 × 10³ cells. (B) Depicted are representative examples of the ELISPOT wells on coincubation of MDA-MB 231, 518A2, and Fib01 cells with the HA-1 CTL clone 2.12 and the H-Y CTL clone 21-17 before and after treatment with 5-AZA-CdR. (C) 518A2 tumor cells were treated with 1 μM 5-AZA-CdR for 8 days. Depicted is the lysis of 518A2 tumor cells by the HA-1H–specific CTL clone 3HA15 and the HLA-A2–specific CTL clone 1E2 before and after treatment with 1 μM 5-AZA-CdR for 8 days in a chromium release assay; x-axis indicates mean percentage of specific lysis (2 measurements per condition); y-axis, CTL clones each in 2 different effector/target ratios.
CTL recognition of HA-1neg tumor cells after 5-AZA-CdR treatment. (A) HA-1pos and HA-1neg tumor cells and fibroblasts (all HLA-A2pos) were treated with 100 μM 5-AZA-CdR for 8 days. Depicted is the response of the HA-1H–specific CTL clones 2.12 and 3HA15 and the H-Y–specific CTL clone 21-17 toward target cells before and after treatment with 5-AZA-CdR; y-axis indicates number of interferon-γ spots in the ELISPOT analysis per 5 × 10³ cells. (B) Depicted are representative examples of the ELISPOT wells on coincubation of MDA-MB 231, 518A2, and Fib01 cells with the HA-1 CTL clone 2.12 and the H-Y CTL clone 21-17 before and after treatment with 5-AZA-CdR. (C) 518A2 tumor cells were treated with 1 μM 5-AZA-CdR for 8 days. Depicted is the lysis of 518A2 tumor cells by the HA-1H–specific CTL clone 3HA15 and the HLA-A2–specific CTL clone 1E2 before and after treatment with 1 μM 5-AZA-CdR for 8 days in a chromium release assay; x-axis indicates mean percentage of specific lysis (2 measurements per condition); y-axis, CTL clones each in 2 different effector/target ratios.
Discussion
Immunotherapeutic targeting of the mHag HA-1 provides the unique option to enhance the anti–solid-tumor effect of allogeneic SCT without risking severe GVHD.4,8,9 Previous studies showed the expression of HA-1 in most but not all solid tumors.8,9 To extend the applicability of HA-1 as an immunotherapeutic target to HA-1neg cancers, we studied the transcriptional regulation of the HA-1 gene in tumor and normal nonhematopoietic cells. We located the TSS of the HA-1 gene −239 bp 5′ of the HA-1 translation start site (ATG). Moreover, we determined a functional promoter sequence between position −278 and −48 bp upstream of the HA-1 translation start site. Database analysis showed the location of HA-1 promoter region within a CpG island and, thus, within a potential target for cancer-related promoter hypermethylation. Furthermore, we showed that the HA-1 promoter region in 6 of 8 HA-1neg solid-tumor cell lines is (in contrast to HA-1pos tumor cell lines, HA-1pos hematopoietic cells, and HA-1neg normal nonhematopoietic cells) highly methylated. Interestingly, a first limited COBRA of primary breast cancers showed HA-1 promoter hypermethylation in at least 2 of 10 samples in which the tumor cells were highly enriched by laser microdissection. These data suggest that HA-1 promoter hypermethylation also exists in primary cancers. The association of HA-1 silencing with promoter methylation in most cell lines provided a first rationale to modulate the HA-1 expression with hypomethylating drugs. We found that HA-1 gene expression was inducible in all HA-1neg cancer cell lines by treatment with 5-AZA-CdR. However, our data also showed that HA-1 promoter hypermethylation is not the only mechanism silencing the HA-1 gene expression. Namely, treatment with 5-AZA-CdR induced HA-1 gene expression in 2 HA-1neg cancer cell lines (GLC-2 and GLC-8) despite the HA-1 promoter being unmethylated. Gene activation of unmethylated genes in cancer cells after treatment with 5-AZA-CdR has been reported earlier and was linked to histone methylation.34,35 Moreover, also the HDAC inhibitor TSA induced de novo HA-1 expression in 3 of 8 HA-1neg tumor cell lines, which indicates that histone deacetylation may also contribute to the regulation of the HA-1 gene expression in solid tumors. Overall, these data suggest that different mechanisms are involved in silencing the HA-1 gene expression in solid-tumor cells. It remains unclear which mechanism dominantly regulates HA-1 expression in HA-1neg primary cancers and whether this might vary in different stages of tumor progression or different tumor entities. However, although 5-AZA-CdR hardly affected the HA-1 mRNA expression in HA-1neg normal nonhematopoietic cells, fibroblasts showed an increase of the HA-1 expression on treatment with the HDAC inhibitor TSA. The latter observation is relevant in the allogeneic SCT setting, because ubiquitously expressed mHags are the prime in situ targets of GVHD.7 The restriction of HA-1 expression to cancer cells on 5-AZA-CdR treatment suggests that hypomethylating agents do not increase the risk of HA-1–specific immunotherapy to induce GVHD. Therefore, we focused our functional immunologic studies on the effects of hypomethylating agents.
A series of functional data reported in this study is pointing toward the applicability of hypomethylating agents to sensitize HA-1neg cancer cells for HA-1–specific immunotherapy. First, 5-AZA-CdR induced the expression of the immunogenic HA-1H allele in cancer cells facilitating functional recognition and lysis by HA-1–specific CTLs. Second, recognition of normal nonhematopoietic cells by HA-1 CTLs remained absent after 5-AZA-CdR treatment. This finding underlines that hypomethylating agents do not increase the GVHD risk of HA-1–specific immunotherapy. Finally, 5-AZA-CdR treatment did not affect the presentation of constitutively expressed antigens. HA-1pos and H-Ypos tumor cells and H-Ypos fibroblasts remained functionally recognized by HA-1 or H-Y–specific CTLs after 5-AZA-CdR treatment. This finding has clinically relevant implications. Namely, hypomethylating agents may be applied without knowing the actual status of HA-1 expression in the individual cancer metastases. This is particularly important as long as simple read outs assessing HA-1 expression in tumors (eg, by antibodies) are not yet available. Indeed, the level of HA-1 gene expression may vary within individual tumor manifestations.8 Thus, similar to CTAs, in which intratumor heterogeneity of CTA expression can be reduced by 5-AZA-CdR,19 hypomethylating agents might ensure the expression of HA-1 in a maximal number of cancer cells before HA-1–specific immunotherapy.
Clinical studies investigating the effects of 5-AZA-CdR and azacitidine in patients with leukemia, myelodysplasia,36-38 and solid tumors39-41 showed that hypomethylating drugs exert only moderate side effects when given at “tumor-modulating” but subtoxic doses. Novel hypomethylating drugs with potentially better pharmacologic profiles and higher potency than 5-AZA-CdR are currently being explored in clinical trials.18 The capacity of hypomethylating drugs to modulate the gene expression profile in solid tumors in vivo has been shown on tumor samples before and after clinical treatment with 5-AZA-CdR.39,40,42 Hypomethylating drugs are capable of reinducing genes associated with drug sensitivity and to reverse drug resistance of cancer cells in clinical studies.41 Likewise, epigenetic modulation can reinduce a broad spectrum of genes associated with an effective CTL-tumor interaction and, thereby, overcome immune escape of solid tumors. 5-AZA-CdR can improve tumor cell killing by the induction of cell adhesion molecules, for example, ICAM-1 and LFA-3,43 and by the restoration of down-regulated HLA class I molecules frequently occurring in cancer cells.23,24 Moreover, 5-AZA-CdR can induce a broad spectrum of CTAs, eg, MAGE-A3 and NY-ESO-1 in solid-tumor cells in vitro19-22 and in vivo.42 The latter effect is also functionally relevant in vivo, because CTA-negative tumors could be eliminated by CTA-specific immunotherapy after 5-AZA-CdR treatment in murine models.21 Thus, hypomethylating drugs may facilitate immunotherapeutic targeting of multiple antigens that are otherwise not expressed by solid tumors.
In conclusion, we have shown that DNA hypermethylation might be an important but not the only mechanism silencing HA-1 gene expression in solid-tumor cells. The hypomethylating agent 5-AZA-CdR restored HA-1 expression only in HA-1neg solid-tumor cells and not in normal nonhematopoietic cells. Thus, particularly hypomethylating drugs may extend the safe applicability of HA-1 as a target for SC-based immunotherapy of cancer.
The online version of this article contains a data supplement.
The publication costs of this article were defrayed in part by page charge payment. Therefore, and solely to indicate this fact, this article is hereby marked “advertisement” in accordance with 18 USC section 1734.
Acknowledgments
We thank Jan Slats, Annemiek van der Wal, Tamara Koudijs, Ilse Ouwerkerk, and Bianca den Hamer for excellent technical assistance.
This work was supported by the Dutch Cancer Society (Koningin Wilhelmina Fonds [Amsterdam, The Netherlands], project code UL2006-3482) and the Netherlands Organization for Scientific Research (NWO; Den Haag, The Netherlands).
Authorship
Contribution: L.H. performed most cellular experiments, prepared the figures, and drafted the manuscript; K.-W.L. supported figure preparation and drafting the manuscript; J.P. performed all molecular work; Z.A. maintained the cell cultures and helped with the T-cell assays; E.B. performed cell-culture experiments; H.J.T. provided the infrastructure for the laser microdissection; J.A.B., H.v.B., and H.H. provided crucial tumor material; B.W. initiated the project and edited the manuscript; and E.G. initiated and supervised the project and edited the manuscript.
Conflict-of-interest disclosure: The authors declare no competing financial interests.
Correspondence: Lothar Hambach, Department of Immunohematology and Blood Transfusion, E3Q, Leiden University Medical Center, PO Box 9600, 2300 RC Leiden, The Netherlands; e-mail: l.w.h.hambach@lumc.nl.

