Abstract
The effector T-cell lineage shows great plasticity. Th17 cells are acknowledged to be instrumental in the response against microbial infection, but are also associated with autoimmune inflammatory processes. Here, we report that human regulatory T cells (CD4posCD25highFoxp3posCD127negCD27pos) can differentiate into IL-17–producing cells, when stimulated by allogeneic antigen-presenting cells, especially monocytes, in the presence of rhIL-2/rhIL-15. These regulatory T cell (Treg)–derived IL-17–producing cells showed high expression of the Th17-related transcription factor RORγt and were positively identified by CCR6 expression. This differentiation process was enhanced by exogenous IL-1β, IL-23, and IL-21, whereas IL-6 or TGFβ did not affect the emergence of IL-17–producing cells. The addition of IL-1 receptor antagonist (IL-1Ra), but not anti–IL-23 antibody, reduced IL-17–producing cell numbers. When an histone deacetylase (HDAC) inhibitor trichostatin A (TSA) was evaluated, we found a profound negative effect on the emergence of IL-17–producing cells from Tregs, implying that Treg differentiation into IL-17–producing cells depends on histone/protein deacetylase activity. Thus, the data suggest that epigenetic modification underlies the phenomenon of Treg plasticity here described.
Introduction
In mice, IL-17A (IL-17)–producing T cells have been established as an important T-helper (Th) effector lineage, clearly distinct from the Th1 or Th2 lineage.1,2 Infectious disease mouse models indicate that IL-17–producing cells (Th17) mediate protection against extracellular pathogens.3-5 However, on the downside, Th17 cells also appear to be the driving force in the pathogenesis of several autoimmune diseases.2,6
Furthermore, mouse studies showed that differentiation of Th17 cells from naive CD4 T cells requires the concomitant activity of IL-6 and transforming growth factor-β (TGFβ).7-9 The key transcription factor driving Th17 cell differentiation is the orphan nuclear receptor RORγt, which is needed for constitutive expression of IL-17.10 In in vivo studies in mice, IL-17– and RORγt-expressing cells were shown to be present in the lung and digestive mucosal compartments,11 and especially throughout the intestinal lamina propria.10
In humans, IL-17 is associated with many inflammatory disorders such as rheumatoid arthritis, asthma, multiple sclerosis, lupus, Crohn disease, and allograft rejection.3,12-15 Recently, human RORγt-positive IL-17–producing T cells were identified under physiologic conditions in peripheral blood and tonsils,15-17 being contained within the CCR6+ (CCR4+)CD4+ memory T-cell population.15,16 Most recent data show that human Th17 differentiation, distinct from mouse Th17 development, is under control of IL-1β, IL-6, and IL-23.18,19
In mice, the development of Th17 cells was described to be linked to that of regulatory T cells (Tregs) in a reciprocal fashion, whereby under the influence of TGFβ, IL-6 levels determine the outcome.8,9 In vitro, activated Tregs promoted Th17 cell differentiation from CD4 T cells,9,20 likely through their production of TGFβ. In addition, in vivo the transfer of Treg enhanced IL-17 production in a mouse model of systemic autoimmune disease.21 Next, to this reciprocal relationship, it was recently demonstrated that IL-17–producing cells directly develop from mouse Tregs.20 This is a remarkable finding, because Tregs are typically associated with T-cell tolerance and immune homeostasis.22 Different Treg subsets have been described, and even within the naturally occurring CD4posCD25high Foxp3pos population heterogeneity is evident. This heterogeneity reflects differences in differentiation or developmental stage, trafficking properties, and suppressor capacity.23-25 Although the lineage differentiation of helper T cells is very well accepted, that of Tregs is only scarcely recognized. In humans, naive and memory-like CD4posCD25posFoxp3posTreg have been defined in peripheral blood, discriminated by the expression of CD45 isoforms CD45RA and CD45RO.25-28 Also in vitro differentiation of human Foxp3+ Tregs has been demonstrated based on CD45 isoform switching.25,29 Recently, we described 2 human Treg subsets originating from the naturally occurring CD4+Foxp3+ Treg pool,24 made apparent by differential expression of CD27, homing receptors such as CD62L, and suppressor function. Gradually, the notion emerges that the regulatory arm of the immune response may develop along similar lines as the effector arm. This would imply that Treg development might exhibit a degree of plasticity that meets local requirements and thereby transgresses lineage barriers. Here, we fuel this notion by showing that isolated highly purified CD4posCD25highCD27posCD45RAnegFoxp3pos Tregs can differentiate into IL-17–producing cells, given that antigen-presenting cells (APCs), in particular monocytes, and the cytokines IL-2 or IL-15 are present. Moreover, we reveal an important role for the IL-1β/IL-1Ra system in regulating Treg differentiation into IL-17–producing cells. In addition, IL-23 and IL-21 were found to enhance this process. This IL-17 induction was found to be dependent on epigenetic modification as evidenced by use of an HDAC inhibitor.
Methods
Cell isolation and culture of cells
Peripheral blood mononuclear cells (PBMCs) were isolated by density gradient centrifugation (Lymphoprep; Nycomed-Pharma AS, Oslo, Norway) of buffy coats obtained from healthy donors upon written informed consent according to the Declaration of Helsinki with regard to scientific use. To obtain high-purity T-cell populations, first CD4pos T cells were purified from PBMCs by negative selection using monoclonal antibodies (mAbs) directed against CD8 (RPA-T8), CD14 (M5E2), CD16 (3G8), CD19 (4G7), CD33 (P67.6), and CD56 (B159) (BD Biosciences, Erembodegem, Belgium) combined with sheep anti–mouse Ig–coated magnetic beads (Invitrogen, Breda, The Netherlands). This resulted in a CD4pos T-cell enrichment of more than 95% and the absence of CD8pos T cells. Purified CD4pos T cells were labeled with anti–CD27-FITC (M-T271; DAKO, Glostrup, Denmark), CD25PE-(MA251; BD Biosciences), or CD45RA-ECD (2H4; Beckman-Coulter, Mijdrecht, The Netherlands); thereafter CD25highCD27posCD45RAneg cells (Tregs) were isolated by high-purity flow cytometric cell sorting using an Altra cell sorter (Beckman-Coulter). A rerun was performed to analyze the cell purity of the sorted cells; sorted cells were always more than 98% pure. Where indicated, sorted CD4posCD25negCD27pos T cells (Teffs) were used for comparison. Monocytes or B cells were positively isolated from PBMCs with magnetic bead isolation using CD14 microbeads (Miltenyi-Biotec, Utrecht, The Netherlands) and CD19 Dynalbeads (Invitrogen, Breda, The Netherlands), respectively, according to the manufacturers' instruction.
Cells were cultured in culture medium (RPMI-1640 with glutamax supplemented with pyruvate [0.02 mM[, 100 U/mL penicillin, 100 μg/mL streptomycin [all from Gibco, Paisley, United Kingdom], and 10% human pooled serum [HPS]) at 37°C, 95% humidity, and 5% CO2, in 96-well round-bottom plates (Greiner, Frickenhausen, Germany).
Reagents
Recombinant human cytokines IL-2 (rIL-2; 12.5 U/mL, proleukine; Cetus, Amsterdam, The Netherlands) and IL-15 (rIL-15;10 ng/mL), IL-1β (rIL-1β;50 ng/mL), IL-21 (rIL21;12.5 ng/mL) (Biosource, Etten-Leur, The Netherlands), IL-1 receptor antagonist (rIL-1Ra;125 ng/mL), IL-6 (rIL-6;50 ng/mL), IL-23 (rIL-23;50 ng/mL), TGFβ (rTGFβ; 3 ng/mL) (R&D Systems, Abingdon, United Kingdom), granulocyte colony-stimulating factor (G-CSF) (rGCSF; 50 ng/mL, Neutropen; Amgen, Breda, The Netherlands), and trichostatin A (TSA, 50 ng/mL; Sigma-Aldrich, Zwijndrecht, The Netherlands) were used. All agents were added at the start of the cultures.
Flow cytometry, antibodies, and CFSE labeling
Cells were phenotypically analyzed by 4- or 5-color flow cytometry as described previously.30 The following conjugated mAbs were used: CD3-(UCHT1), CD4-(MT310), CD8-(DK25), CD27-(M-T271), CD45RA-(4KB5), CD45RO-(UCHL1) FITC- or PE-labeled (DAKO), CD25-(M-A251) PE, CD127-(M21) PE, CCR4-(1G1) PeCy7, CCR6-(11A9; BD Biosciences) PE- or biotin-labeled, CXCR3-(1C6/CXCR3) PeCy5 (BD Biosciences), CXCR4-(12G5) PeCy5 (eBioscience, Uithoorn, The Netherlands), CCR7-(150503) FITC or PE (R&D Systems), CD4-(T4) ECD, CD4-(T4) PeCy5, and CD62L-(DREG54) ECD (Beckman-Coulter). The detection of biotinylated antibodies was performed with streptavidin conjugated to PeCy5, PeCy7 (Beckman-Coulter), or Quantum dots (Qdot605; Invitrogen, Breda, The Netherlands). Isotype-matched antibodies were used to define marker settings. Intracellular analysis of Foxp3-(PCH101) FITC or PE and IL-17-(6CAP17) PE (eBioscience) was performed after fixation and permeabilization, using Fix and Perm reagent (eBioscience). Before intracellular cytokine measurements, the cells were stimulated for 4 hours with PMA (12.5 ng/mL) plus ionomycin (500 ng/mL) in the presence of Brefeldin A (5 μg/mL; Sigma-Aldrich).
To study cell division by flow cytometry, 106 cells of interest were labeled with 0.5 μM CFSE (Molecular Probes, Leiden, The Netherlands) as described previously.30
Cell samples were measured on a FC500 flow cytometer (Beckman-Coulter), and flow cytometry data were analyzed using CXP software (Beckman-Coulter).
T-cell stimulation and suppression assays
Sorted CD25highCD27pos Treg or CD25negCD27pos Teff (2.5 × 10⁴) populations were stimulated with 0.5 to 105 HLA-mismatched γ-irradiated (30 Gy) stimulator PBMCs (HLA typing was conducted as described previously30 ), or anti-CD3 plus anti-CD28–coated beads (Invitrogen, Breda, The Netherlands) in 200 μL culture medium in the absence or presence of recombinant human cytokines. To analyze cytokine production, cells were stimulated with PMA (12.5 ng/mL) plus ionomycin (50 ng/mL; Sigma-Aldrich) for the indicated culture time.
The suppressor capacity of regulatory cells was studied in a coculture suppression assay. CD4posCD25neg T cells (2.5-5 × 10⁴) were stimulated with anti-CD3 plus anti-CD28–coated beads (Invitrogen, Breda, The Netherlands) in a cell:bead ratio of 4:1, in the absence or presence of increasing numbers of Tregs. T-cell proliferation was analyzed by 3H-thymidine incorporation using a Gas Scintillation Counter (Matrix-96 Beta-counter; Canberra-Packard, Meriden, CT). To this end, 0.037 MBq (1 μCi) 3H-thymidine (ICN-Pharmaceuticals, Irvine, CA) was added to each well, cells were harvested after 8 hours of culture, and 3H-thymidine incorporation was measured. The 3H-incorporation is expressed as mean plus or minus SD counts per 5 minutes of at least triplicate measurements
Measurement of cytokines in culture supernatant
Human IL-1, IL-2, IL-4, IL-5, IL-6, IL-10, IL-13, IL-17, IFNγ, TNFα, and G-CSF were determined in the supernatant of the MLC cultures and primary T-cell cultures, respectively, using human cytokine multiplex kits (Bioplex-system; Bio-Rad, Veenendaal, The Netherlands) according to the manufacturer's instructions. The sensitivity of the cytokine assay was less than 5 pg/mL for all cytokines measured.
Real-time quantitative reverse-transcriptase–PCR
Total RNA was extracted with the RNeasy Micro Kit according to the manufacturer's instructions (Qiagen, Hilden, Germany). cDNA was synthesized using the SuperScript III First-Strand Synthesis System and Oligo(dT)20 primers (Invitrogen, Carlsbad, CA). Transcripts were quantified by real-time quantitative polymerase chain reaction (PCR) on an ABI-PRISM 7700 Sequence Detector using predesigned TaqMan GeneExpression Assays and reagents according to the manufacturer's instructions (Applied Biosystems, Foster City, CA). Probes with the following Applied Biosystems assay identification numbers were used: TBX21, Hs00203436_m1; GATA3, Hs00231122_m1; FOXP3, Hs00203958_m1; IL17A, Hs00174383_m1; TGFB1, Hs00171257_m1; RORC variant 1, Hs00172858_m1; and RORC variant 1 + 2, Hs01076112_m1. Data were normalized using the human HPRT1 Endogenous Control (4333768T; Applied Biosystems) and expressed as relative arbitrary units. Because there is no probe available for RORC variant 2, and the RORC variant 1 was not detected in freshly isolated cells (data not shown), we used a probe that detects both variants and took the levels obtained to be indicative for RORC variant 2 (RORγt).18
Statistics
A standard 2-tailed t test or Wilcoxon matched pairs test was used for statistical analysis; P values of .05 or less were considered significant and are indicated with an asterisk (*). Nonsignificant data are indicated as NS.
Results
Stimulation of CD25high CD27pos Foxp3+ Tregs results in IL-17–producing cells
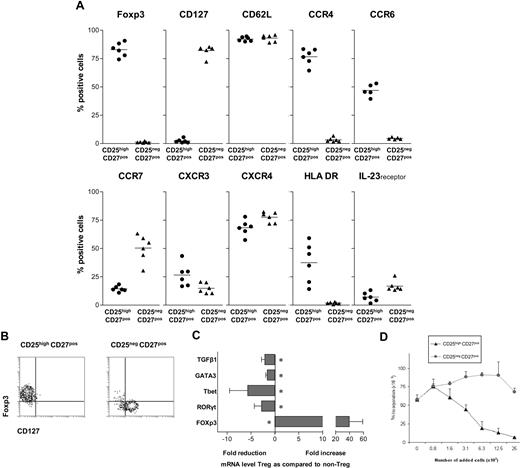
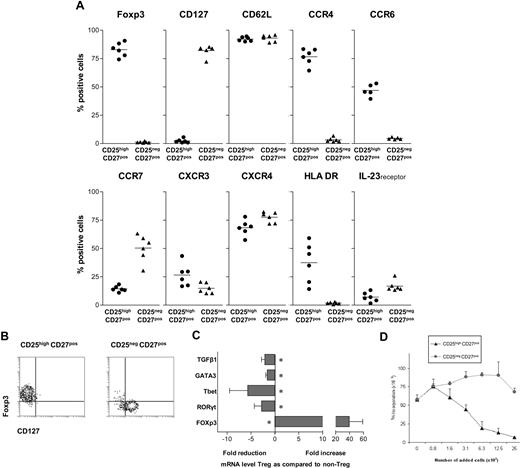
In contrast to the latest studies, describing Th17 differentiation from the naive human Foxp3+CD4 T-cell pool, recent findings on Th17 differentiation in murine models have prompted us to evaluate the differentiation of IL-17–producing cells from human CD4+ Tregs. We set out to study a highly pure and well-defined human CD4posCD25highCD27posCD45RAneg Treg population, freshly isolated from peripheral blood by flow cytometric cell sorting. A phenotypic analysis before sorting established the broader phenotype of our target CD4posCD25high CD27posCD45RAneg Treg population to be as follows: cells consistently expressed CD45RO (not shown), Foxp3, and CD62L. The majority expressed CCR4 and CXCR4, approximately half of the population expressed CCR6 and HLA-DR, few cells expressed CCR7, CXCR3, and IL-23 receptor, whereas CD127 expression was lacking (Figure 1A).
Characterization of CD25highCD27posCD45RAnegCD4pos Tregs. (A) Flow cytometry of peripheral CD25high and CD25neg cells within the PBMC CD4posCD27posCD45RAneg gate (n = 6). Percentages of cells positive for the indicated marker (top) are given. (B) Flow cytometry of sorted CD25highCD27posCD45RAnegCD4pos (CD25highCD27pos) Tregs and CD25negCD27posCD45RAnegCD4pos (CD25negCD27pos) Teffs. CD4 cells were isolated by magnetic bead–based negative selection. The enriched cells were labeled with anti-CD25, anti-CD27, and anti-CD45RA mAb and next, CD25highCD27posCD45RAneg and CD25negCD27posCD45RAneg cell populations were isolated by high-purity flow cytometric cell sorting. Density plots show surface staining of CD127 (x-axis) and intracellular staining of Foxp3 (y-axis). (C) Real-time quantitative reverse-transcriptase (RT)–PCR of the mRNA expression of Tbet, GATA3, RORγt, FOXP3, and TGFβ in freshly sorted CD25highCD27pos Tregs and CD25negCD27pos Teffs. The RT-PCR data shown were normalized to human HPRT1 levels, and expression in nonstimulated conditions of CD25negCD27pos cells was set as 1.0, and fold reduction or increase in gene expression was calculated. Cells obtained from 3 to 5 different donors were used. Mean and SD from different experiments are shown. * indicates statistically significant differences. (D) 3H-thymidine incorporation–based suppression assay of sorted CD25highCD27pos Tregs and CD25negCD27pos Teffs. Sorted cells were titrated (x-axis) into cultures with CD4pos responder T cells (25 × 103) and subsequently stimulated with anti-CD3 plus anti-CD28 mAb–coated beads. Proliferation (y-axis) was measured at day 3 after the start of the culture. A representative experiment is shown. Mean and SD of triplicate measurements are shown. Data are from n = 6 different healthy volunteers (A), or show representative experiments of 2 (C,D) or 3 (D) separate experiments performed with cells obtained from different cell donors.
Characterization of CD25highCD27posCD45RAnegCD4pos Tregs. (A) Flow cytometry of peripheral CD25high and CD25neg cells within the PBMC CD4posCD27posCD45RAneg gate (n = 6). Percentages of cells positive for the indicated marker (top) are given. (B) Flow cytometry of sorted CD25highCD27posCD45RAnegCD4pos (CD25highCD27pos) Tregs and CD25negCD27posCD45RAnegCD4pos (CD25negCD27pos) Teffs. CD4 cells were isolated by magnetic bead–based negative selection. The enriched cells were labeled with anti-CD25, anti-CD27, and anti-CD45RA mAb and next, CD25highCD27posCD45RAneg and CD25negCD27posCD45RAneg cell populations were isolated by high-purity flow cytometric cell sorting. Density plots show surface staining of CD127 (x-axis) and intracellular staining of Foxp3 (y-axis). (C) Real-time quantitative reverse-transcriptase (RT)–PCR of the mRNA expression of Tbet, GATA3, RORγt, FOXP3, and TGFβ in freshly sorted CD25highCD27pos Tregs and CD25negCD27pos Teffs. The RT-PCR data shown were normalized to human HPRT1 levels, and expression in nonstimulated conditions of CD25negCD27pos cells was set as 1.0, and fold reduction or increase in gene expression was calculated. Cells obtained from 3 to 5 different donors were used. Mean and SD from different experiments are shown. * indicates statistically significant differences. (D) 3H-thymidine incorporation–based suppression assay of sorted CD25highCD27pos Tregs and CD25negCD27pos Teffs. Sorted cells were titrated (x-axis) into cultures with CD4pos responder T cells (25 × 103) and subsequently stimulated with anti-CD3 plus anti-CD28 mAb–coated beads. Proliferation (y-axis) was measured at day 3 after the start of the culture. A representative experiment is shown. Mean and SD of triplicate measurements are shown. Data are from n = 6 different healthy volunteers (A), or show representative experiments of 2 (C,D) or 3 (D) separate experiments performed with cells obtained from different cell donors.
For comparison, the CD4posCD25negCD27posCD45RAneg T-cell population was positive for CD127 and CD62L, the majority expressed CXCR4, approximately half of the population expressed CCR7, less than 20% expressed the IL-23 receptor, whereas expression of Foxp3, CCR4, CCR6, and HLA-DR was virtually lacking. Accordingly, after sorting, the resultant CD4posCD25highCD27posCD45RAneg Tregs (from here on referred to as CD25highCD27pos Tregs) all ex-pressed Foxp3 and lacked CD127, whereas in contrast, sorted CD4posCD25negCD27posCD45RAneg T cells (CD25negCD27pos Teffs) all lacked Foxp3 and were all positive for CD127 (Figure 1B). Subsequently, we analyzed the expression of mRNA encoding transcription factors that are specific for Tregs (Foxp3), Th1 cells (Tbet), Th2 cells (GATA3), and Th17 cells (RORγt; Figure 1C). The CD25highCD27pos Treg population, in contrast to the CD25negCD27pos Teff population, showed high expression of Foxp3. Then, the suppressor function of the freshly isolated and sorted CD25highCD27pos Tregs was measured, which as anticipated, showed a dose-dependent suppression of CD4pos T-cell proliferation, in contrast to the CD25negCD27pos Teffs (Figure 1D).
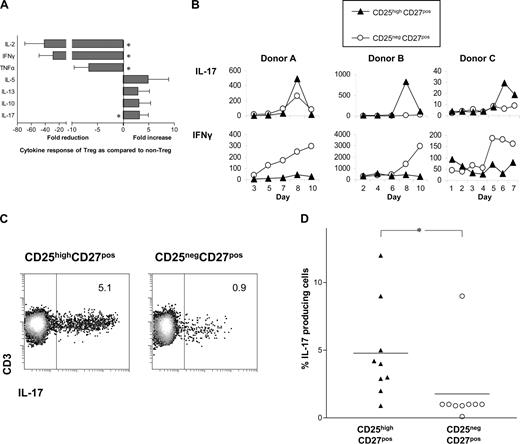
The differential production of cytokines by T cells after stimulation is a hallmark of T-cell differentiation.6 Therefore, we determined the cytokine-producing potential of sorted CD25highCD27pos Tregs upon stimulation with PMA plus ionomycin. In contrast to CD25negCD27pos Teffs, CD25highCD27pos Tregs hardly produced IL-2, IFNγ, or TNFα, but were able to produce IL-5, IL-13, and IL-10 (Figure 2A). Stimulation did not enhance mRNA levels of TGFβ (data not shown). Interestingly, the Treg population was found to produce higher levels of IL-17 than the CD25negCD27pos Teffs. Next, we analyzed IL-17 production of sorted CD25highCD27pos Tregs after stimulation with allogeneic PBMCs in the presence of rIL-2 plus rIL-15 (Figure 2B). This stimulation of Tregs also resulted in IL-17 production, which always occurred within a defined timeframe of 6 up to 9 days of culture. In the Treg cultures, little IFNγ production was found (Figure 2B). Both CD25highCD27pos Tregs and CD25negCD27pos memory Teffs showed proliferation; the latter demonstrated more vigorous cell growth24 (data not shown). The production of IL-17 by Tregs upon stimulation with PBMCs and rIL-2 plus rIL-15 on day 8 of culture was confirmed by intracellular cytokine staining after PMA plus ionomycin stimulation (Figure 2C). The percentage of IL-17–producing cells was significantly higher in the CD25highCD27pos Treg population compared with CD25negCD27pos memory Teffs (summarized in Figure 2D). The majority of IL-17–producing Tregs (> 63%) were single IL-17 producers; 37% produced both IL-17 and IFNγ (data not shown).
The sorted CD25highCD27posCD45RAnegCD4posTreg population produces IL-17 upon stimulation. (A) Cytokine measurements of sorted CD25highCD27posCD45RAnegCD4pos (CD25highCD27pos) Tregs and CD25negCD27posCD45RAnegCD4pos (CD25negCD27pos) Teffs measured in culture supernatants at 20 hours after stimulation with PMA and ionomycin. Data shown were normalized to cytokine production by CD25negCD27pos cells that was set as 1.0. Fold reduction or increase in cytokine production was calculated from 6 independent experiments performed with cells from different donors. Mean and SD from different experiments are shown. * indicates statistically significant differences (P < .05) according to the Wilcoxon matched pairs test. (B) IL-17 concentration measured at distinct time points (days; x-axis) after stimulation with allogeneic PBMCs in the presence of rIL-2 and rIL-15. Data show 3 experiments of 6 (A), or 8 (B), using cells from 3 different donors. (C) A single representative experiment showing flow cytometric analysis of IL-17 production in the sorted Treg and Teff populations that were cultured for 8 days with allogeneic PBMCs and rIL-2 plus rIL-15, and then stimulated for 4 hours with PMA plus ionomycin, in the presence of Brefeldin A. Numbers in the plots indicate the percentages of IL-17–producing CD3+ cells as assessed by intracellular cytokine staining. (D) Data summary of intracellular IL-17 staining in sorted Treg and Teff populations of 9 different donors at day 8 of allogeneic stimulation, such as that described in panel C.
The sorted CD25highCD27posCD45RAnegCD4posTreg population produces IL-17 upon stimulation. (A) Cytokine measurements of sorted CD25highCD27posCD45RAnegCD4pos (CD25highCD27pos) Tregs and CD25negCD27posCD45RAnegCD4pos (CD25negCD27pos) Teffs measured in culture supernatants at 20 hours after stimulation with PMA and ionomycin. Data shown were normalized to cytokine production by CD25negCD27pos cells that was set as 1.0. Fold reduction or increase in cytokine production was calculated from 6 independent experiments performed with cells from different donors. Mean and SD from different experiments are shown. * indicates statistically significant differences (P < .05) according to the Wilcoxon matched pairs test. (B) IL-17 concentration measured at distinct time points (days; x-axis) after stimulation with allogeneic PBMCs in the presence of rIL-2 and rIL-15. Data show 3 experiments of 6 (A), or 8 (B), using cells from 3 different donors. (C) A single representative experiment showing flow cytometric analysis of IL-17 production in the sorted Treg and Teff populations that were cultured for 8 days with allogeneic PBMCs and rIL-2 plus rIL-15, and then stimulated for 4 hours with PMA plus ionomycin, in the presence of Brefeldin A. Numbers in the plots indicate the percentages of IL-17–producing CD3+ cells as assessed by intracellular cytokine staining. (D) Data summary of intracellular IL-17 staining in sorted Treg and Teff populations of 9 different donors at day 8 of allogeneic stimulation, such as that described in panel C.
Cell division–related differentiation of CD25highCD27pos Tregs results in an IL-17–producing cell population that loses CD27 expression
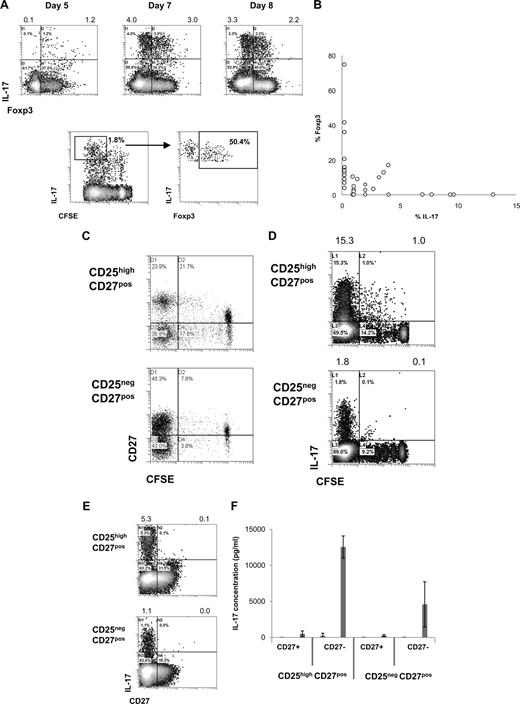
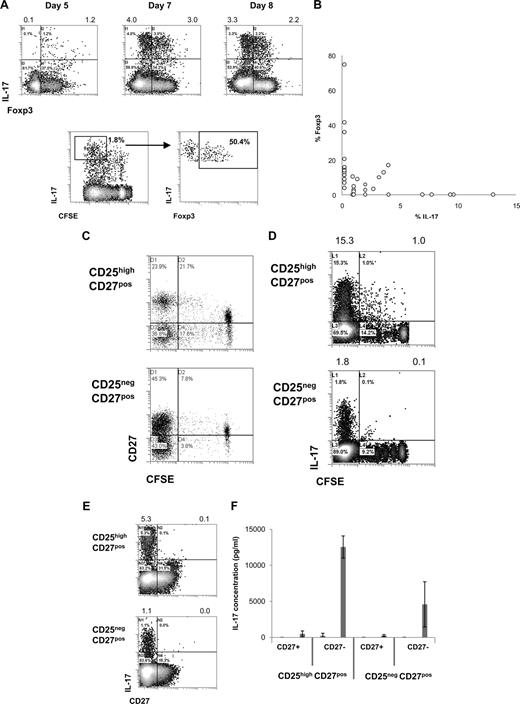
Intrigued by the observation that activated CD25highCD27pos Tregs produced IL-17, we decided to study this phenomenon in more detail. To confirm IL-17 production by Foxp3+ Tregs, we analyzed IL-17 production by sorted CD25highCD27pos Tregs after stimulation with allogeneic PBMCs and rIL-2 plus rIL-15 by flow cytometry. Early after stimulation, CD25highCD27pos Tregs coexpressed Foxp3 and IL-17 (Figure 3A). Importantly, dividing Tregs expressed IL-17 and gradually lost Foxp3 expression (Figure 3A). This would suggest that single-positive IL-17 cells pass through a Foxp3/IL-17 double-positive stage (Figure 3A,B). At the end of the culture, an inverse relationship between Foxp3 expression and IL-17 production was observed (Figure 3B). Next, we addressed the question as to whether the production of IL-17 after allogeneic PBMC stimulation paralleled the previously observed differentiation of CD25highCD27pos Treg into CD27pos and CD27neg T-cell subsets.24 To examine this, high-purity sorted CD25highCD27pos Tregs were labeled with CFSE and activated with allogeneic stimulator PBMCs in the presence of exogenously added rIL-2 plus rIL-15, and analyzed by flow cytometry at day 8 of the cultures. As shown previously, cell division–related differentiation of the CD25highCD27pos Tregs took place as indicated by the emergence of both CD27pos and CD27neg T-cell populations with low CFSE content (Figure 3C). IL-17–producing cells were predominantly found after multiple divisions of the starting CD25highCD27pos population (Figure 3D). Moreover, IL-17 appeared to be exclusively produced by the resultant CD27neg cells (Figure 3E). To confirm that the IL-17–producing cells resided within the CD27neg population, which was generated as a consequence of CD25highCD27pos Treg differentiation, again peripheral CD25highCD27pos Tregs were sorted, labeled with CFSE, and stimulated with allogeneic stimulator PBMCs and rIL-2 plus rIL-15. This typically results in the differentiation of CD25highCD27pos Tregs into CD27neg and CD27pos cells, such as shown in Figure 3C. After 10 days of culture, the emerged CD27neg and CD27pos cells were sorted based on CD27 expression and low CFSE content. These sorted, differentiated CD27pos and CD27neg cells were restimulated with PMA plus ionomycin and analyzed for the production of IL-17 in the culture supernatants. Indeed, IL-17 appeared to be produced exclusively by the CD27neg population that had differentiated from the CD25highCD27pos Treg population, but not from the CD25negCD27pos population (Figure 3F). Thus, after cell division–related differentiation of CD25highCD27pos Tregs, the resultant CD27neg cells are the main producers of IL-17.
CD25highCD27pos Treg differentiation into CD27neg IL-17–producing cells and pass through into a Foxp3/IL-17 double-positive stage. Flow cytometry of sorted CD4posCD25highCD27posCD45RAneg (CD25highCD27pos) Tregs and CD4posCD25negCD27posCD45RAneg (CD25negCD27pos) Teffs that were stimulated with allogeneic PBMCs in the presence of both rIL-2 and rIL-15 and analyzed for cell division, IL-17 production, and Foxp3 and CD27 expression. To analyze IL-17 production, cells were restimulated with PMA plus ionomycin in the presence of Brefeldin A. (A) Density plots at the top show intracellular expression of IL-17 (y-axis) and Foxp3 (x-axis) at days 5, 7, and 8 after culture of CD25highCD27pos Tregs. Numbers at the top of the plots indicate the percentages of IL-17–producing cells. The lower density plots show CFSE content and costaining of Foxp3 of CFSE-labeled CD25highCD27pos Tregs at day 6 of the culture. (B) Summary plot showing percentage of IL-17– and Foxp3–expressing cells, such as analyzed under panel A, at day 8 of the cultures (data from 12 individual experiments, using 12 different blood donors). (C,D) Sorted CD25highCD27pos Tregs and CD25negCD27pos Teffs were CFSE labeled and subsequently stimulated with allogeneic PBMCs and rIL-2 plus rIL-15. Plots show CFSE content (x-axis) and expression of CD27 (C) or IL-17 (D, y-axis) at day 8 of the culture. (E) Density plots show CD27 (x-axis) expression and intracellular IL-17 expression (y-axis). (F) Cytokine measurements of differentiated CD27pos and CD27neg cells obtained after differentiation of sorted peripheral CD25highCD27pos Tregs and CD25negCD27pos Teffs. CD25highCD27pos Tregs and CD25negCD27pos Teffs were sorted from peripheral blood, labeled with CFSE, and cultured in the presence of allogeneic stimulator PBMCs and rIL-2 plus rIL-15 for 10 days. At day 10, the resultant CD27pos and CD27neg cells in the divided CFSE-low cell population were isolated by cell sorting using flow cytometry. The sorted cell populations (20 × 103) were stimulated for 20 hours with PMA plus ionomycin; thereafter IL-17 concentrations were analyzed in the culture supernatants. Means plus or minus SD are shown for 3 independent experiment performed with cells obtained from different donors. Data are representative of 2 (A) or 3 or more (C-E) separate experiments conducted with cells obtained from different blood donors.
CD25highCD27pos Treg differentiation into CD27neg IL-17–producing cells and pass through into a Foxp3/IL-17 double-positive stage. Flow cytometry of sorted CD4posCD25highCD27posCD45RAneg (CD25highCD27pos) Tregs and CD4posCD25negCD27posCD45RAneg (CD25negCD27pos) Teffs that were stimulated with allogeneic PBMCs in the presence of both rIL-2 and rIL-15 and analyzed for cell division, IL-17 production, and Foxp3 and CD27 expression. To analyze IL-17 production, cells were restimulated with PMA plus ionomycin in the presence of Brefeldin A. (A) Density plots at the top show intracellular expression of IL-17 (y-axis) and Foxp3 (x-axis) at days 5, 7, and 8 after culture of CD25highCD27pos Tregs. Numbers at the top of the plots indicate the percentages of IL-17–producing cells. The lower density plots show CFSE content and costaining of Foxp3 of CFSE-labeled CD25highCD27pos Tregs at day 6 of the culture. (B) Summary plot showing percentage of IL-17– and Foxp3–expressing cells, such as analyzed under panel A, at day 8 of the cultures (data from 12 individual experiments, using 12 different blood donors). (C,D) Sorted CD25highCD27pos Tregs and CD25negCD27pos Teffs were CFSE labeled and subsequently stimulated with allogeneic PBMCs and rIL-2 plus rIL-15. Plots show CFSE content (x-axis) and expression of CD27 (C) or IL-17 (D, y-axis) at day 8 of the culture. (E) Density plots show CD27 (x-axis) expression and intracellular IL-17 expression (y-axis). (F) Cytokine measurements of differentiated CD27pos and CD27neg cells obtained after differentiation of sorted peripheral CD25highCD27pos Tregs and CD25negCD27pos Teffs. CD25highCD27pos Tregs and CD25negCD27pos Teffs were sorted from peripheral blood, labeled with CFSE, and cultured in the presence of allogeneic stimulator PBMCs and rIL-2 plus rIL-15 for 10 days. At day 10, the resultant CD27pos and CD27neg cells in the divided CFSE-low cell population were isolated by cell sorting using flow cytometry. The sorted cell populations (20 × 103) were stimulated for 20 hours with PMA plus ionomycin; thereafter IL-17 concentrations were analyzed in the culture supernatants. Means plus or minus SD are shown for 3 independent experiment performed with cells obtained from different donors. Data are representative of 2 (A) or 3 or more (C-E) separate experiments conducted with cells obtained from different blood donors.
APCs and monocytes, together with IL-2 and/or IL-15, are important for the differentiation of CD25highCD27posFoxp3pos Tregs into IL-17–producing cells
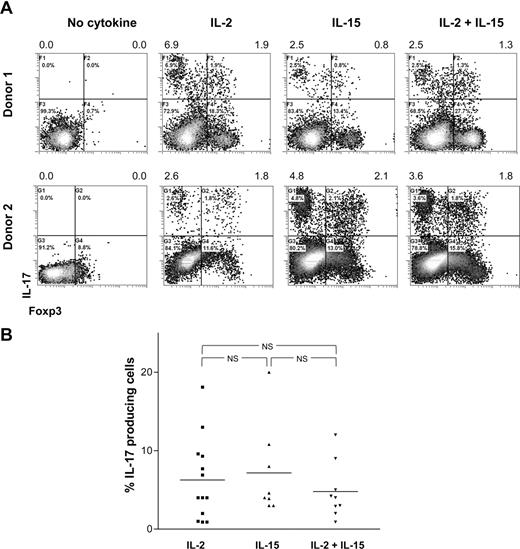
T-cell differentiation is strongly determined by the cytokine microenvironment. Therefore, we here analyzed which cytokines and stimulatory conditions contribute to the differentiation of CD25highCD27pos Tregs into IL-17–producing cells. First, to analyze the effect of exogenous rIL-2 plus rIL-15, growth factors that are routinely added to our cultures to facilitate Treg proliferation, high-purity sorted CD25highCD27pos Tregs were activated with allogeneic stimulator PBMCs in the absence or presence of rIL-2, rIL-15, or the combination thereof. At day 8 of the cultures, the IL-17–producing capacity was analyzed by flow cytometry (Figure 4). In the absence of rIL-2 and rIL-15 supplementation, the CD25highCD27pos Tregs were unable to produce IL-17 (Figure 4A; Figure S1, available on the Blood website; see the Supplemental Materials link at the top of the online article). Overall, the presence of rIL-2, rIL-15, or the combination of both resulted in comparable numbers of IL-17–producing cells. No additive effect of rIL-2 and rIL-15 was observed (data summarized in Figure 4B).
IL-17 production by differentiated Tregs depends on IL-2 or IL-15. Sorted CD25highCD27posCD45RAnegCD4pos (CD25highCD27pos) Tregs were stimulated with allogeneic PBMCs in the absence or presence of rIL-2, rIL-15, or both. At day 8 of the cultures, the cells were stimulated with PMA plus ionomycin in the presence of Brefeldin A and analyzed for intracellular IL-17 expression. (A) Density plots show intracellular staining of IL-17 (y-axis) and Foxp3 (x-axis) after culture of CD25highCD27pos Tregs using the culture condition indicated at the top. Results obtained with cells obtained from 2 different donors are shown. Numbers at the top of the plots indicate the percentage of IL-17–producing cells. Forward side scatter plot are shown in Figure S1. (B) Summary figure showing the percentages of IL-17–producing cells (y-axis) after culture of CD25highCD27pos Tregs using the indicated conditions (x-axis). Individual measurements and mean are indicated. Data are shown from 9 to 13 different experiments, with different donors.
IL-17 production by differentiated Tregs depends on IL-2 or IL-15. Sorted CD25highCD27posCD45RAnegCD4pos (CD25highCD27pos) Tregs were stimulated with allogeneic PBMCs in the absence or presence of rIL-2, rIL-15, or both. At day 8 of the cultures, the cells were stimulated with PMA plus ionomycin in the presence of Brefeldin A and analyzed for intracellular IL-17 expression. (A) Density plots show intracellular staining of IL-17 (y-axis) and Foxp3 (x-axis) after culture of CD25highCD27pos Tregs using the culture condition indicated at the top. Results obtained with cells obtained from 2 different donors are shown. Numbers at the top of the plots indicate the percentage of IL-17–producing cells. Forward side scatter plot are shown in Figure S1. (B) Summary figure showing the percentages of IL-17–producing cells (y-axis) after culture of CD25highCD27pos Tregs using the indicated conditions (x-axis). Individual measurements and mean are indicated. Data are shown from 9 to 13 different experiments, with different donors.
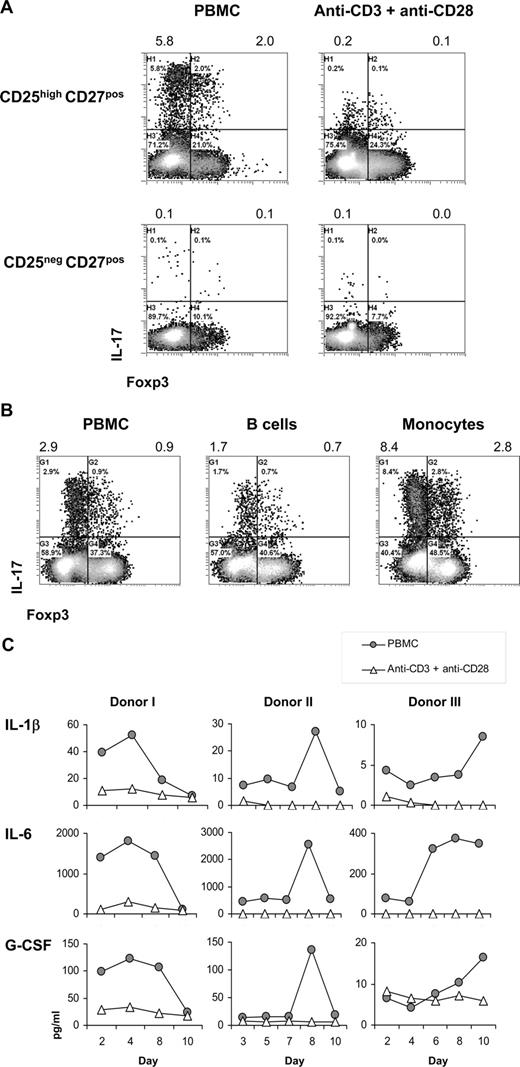
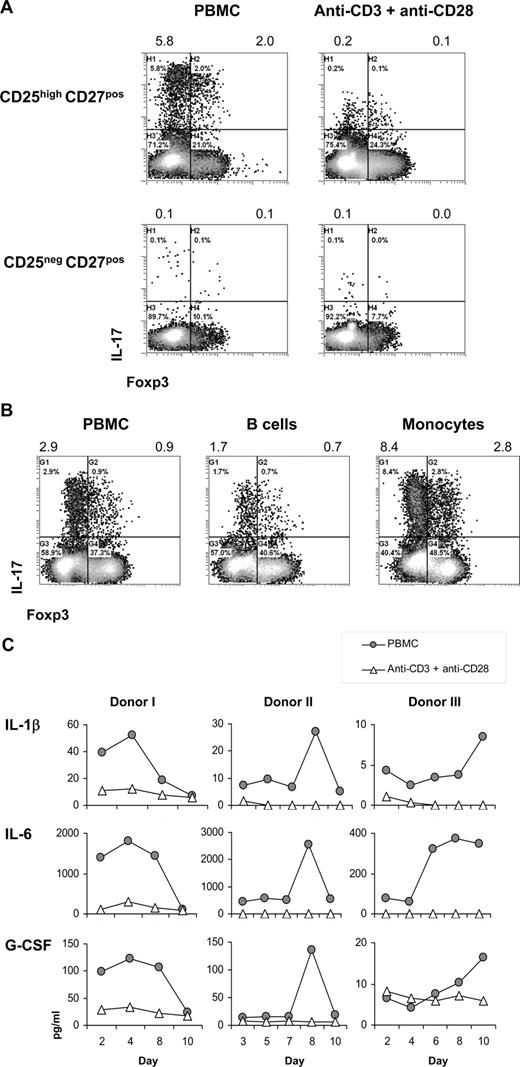
Second, we examined the need for antigen-presenting cells (APCs) in the differentiation of CD25highCD27pos Tregs into IL-17–producing cells. The number of IL-17–producing cells was higher upon stimulation of CD25highCD27pos Tregs with allogeneic PBMCs compared with stimulation with anti-CD3 plus anti-CD28 mAb–coated beads, both in the presence of IL-2/IL-15 (Figure 5A). Notably, both stimulation methods induced Treg proliferation24 (data not shown). Importantly, also the secretion level of IL-17 (mean fluorescence intensity [MFI] values) was higher after PBMC stimulation. Within the stimulating PBMC fraction, the CD14pos monocytes were endowed with the most salient capacity to stimulate differentiation of CD25highCD27pos Tregs into IL-17–producing cells (Figure 5B), stressing the importance of APCs in this process.
Importance of antigen-presenting cells in the differentiation of CD25highCD27pos Tregs into IL-17–producing cells. Flow cytometry and cytokine analysis of sorted CD25highCD27posCD45RAnegCD4pos (CD25highCD27pos) Tregs and CD25negCD27posCD45RAnegCD4pos (CD25neg-CD27pos) Teffs that were stimulated with allogeneic PBMCs or anti-CD3 plus anti-CD28 mAb–coated beads or with purified monocytes or B cells in the presence of rIL-2 plus rIL-15. (A) Density plots show intracellular staining of IL-17 (y-axis) and Foxp3 (x-axis) after 8 days of culture with PBMCs or anti-CD3 plus anti-CD28 mAb–coated beads in the presence of IL-2/IL-15 and restimulation with PMA plus ionomycin in the presence of Brefeldin A. Numbers at the top of the plots indicate the percentage of IL-17–producing cells. (B) Dot plots show intracellular staining of IL-17 (y-axis) and Foxp3 (x-axis) after 8 days of culture with PBMCs, purified monocytes, or purified B cells, and restimulation with PMA plus ionomycin in the presence of Brefeldin A. Numbers at the top of the plots indicate the percentages of IL-17–producing cells. (C) Cytokine analysis of IL-1β, IL-6, and G-CSF in culture supernatants measured at distinct time points (days; x-axis) after stimulation of sorted CD25highCD27pos Tregs with allogeneic PBMCs or anti-CD3 plus anti-CD28 mAb–coated beads (legends). Three experiments conducted with cells from 3 different donors are shown. Data are representative of 4 (A) and 2 (B) separate experiments conducted with cells obtained from different blood donors.
Importance of antigen-presenting cells in the differentiation of CD25highCD27pos Tregs into IL-17–producing cells. Flow cytometry and cytokine analysis of sorted CD25highCD27posCD45RAnegCD4pos (CD25highCD27pos) Tregs and CD25negCD27posCD45RAnegCD4pos (CD25neg-CD27pos) Teffs that were stimulated with allogeneic PBMCs or anti-CD3 plus anti-CD28 mAb–coated beads or with purified monocytes or B cells in the presence of rIL-2 plus rIL-15. (A) Density plots show intracellular staining of IL-17 (y-axis) and Foxp3 (x-axis) after 8 days of culture with PBMCs or anti-CD3 plus anti-CD28 mAb–coated beads in the presence of IL-2/IL-15 and restimulation with PMA plus ionomycin in the presence of Brefeldin A. Numbers at the top of the plots indicate the percentage of IL-17–producing cells. (B) Dot plots show intracellular staining of IL-17 (y-axis) and Foxp3 (x-axis) after 8 days of culture with PBMCs, purified monocytes, or purified B cells, and restimulation with PMA plus ionomycin in the presence of Brefeldin A. Numbers at the top of the plots indicate the percentages of IL-17–producing cells. (C) Cytokine analysis of IL-1β, IL-6, and G-CSF in culture supernatants measured at distinct time points (days; x-axis) after stimulation of sorted CD25highCD27pos Tregs with allogeneic PBMCs or anti-CD3 plus anti-CD28 mAb–coated beads (legends). Three experiments conducted with cells from 3 different donors are shown. Data are representative of 4 (A) and 2 (B) separate experiments conducted with cells obtained from different blood donors.
Given that stimulation with APCs, compared with anti-CD3 plus anti-CD28 mAb–coated bead stimulation, was superior in stimulating the differentiation of Tregs into IL-17–producing cells, we next analyzed which APC-related cytokines were produced in case of APC stimulation versus anti-CD3 plus anti-CD28 stimulation. Compared with anti-CD3 plus anti-CD28 bead stimulation, in case of allogeneic APC stimulation of sorted CD25highCD27pos Tregs, we typically found increased IL-1β, IL-6, and G-CSF levels (Figure 5C).
The IL-1/IL-1Ra system controls Treg differentiation into IL-17–producing cells
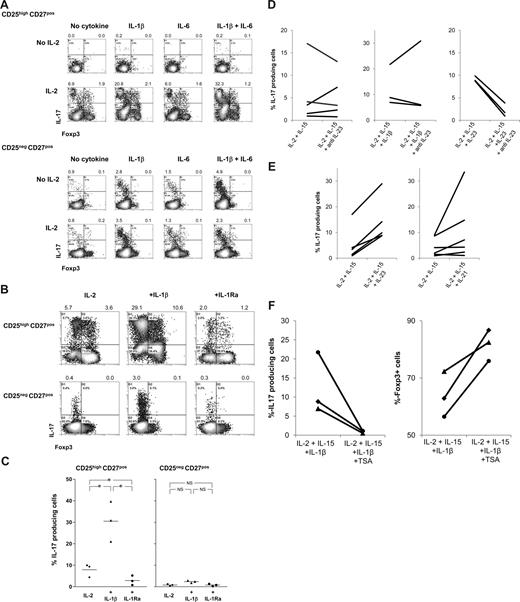
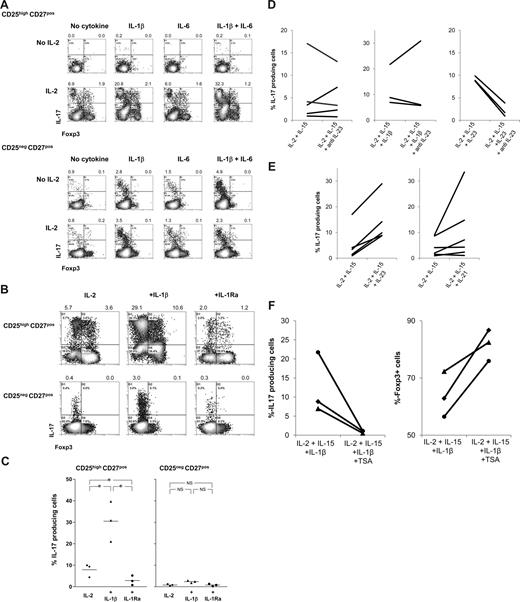
These findings prompted us to analyze whether the addition of exogenously added rIL-1β, rIL-6, or rG-CSF to cultures of APC-stimulated CD25highCD27pos Tregs in the presence of rIL-2/rIL-15 enhanced the generation of IL-17–producing cells. Again, the presence of rIL-2/rIL-15 appeared a prerequisite for the emergence of IL-17–producing cells (Figure 4), as in their absence neither rIL-1β, rIL-6 alone, nor both in combination had any effect (Figure 6A; Figure S1). This is probably due to the lack of proper blast formation and subsequent proliferation (Figure S1). In addition, addition of G-CSF had no effect (not shown). In sharp contrast, the addition of rIL-1β together with rIL-2/rIL-15 resulted in a firm increase in the number of IL-17–producing cells. This effect was not the result of increased proliferation, as rIL-1β did not further promote Treg proliferation, such as observed upon stimulation with PBMCs and rIL-2/rIL-15 (data not shown). rIL-6 alone was not effective, but in individual cases IL-6 did enhance the effect of IL-1β. The observed effect of IL-1β was far more pronounced for CD25highCD27pos Tregs than for CD25negCD27pos Teffs. To determine the direct contribution of IL-1β on the differentiation of Tregs into IL-17–producing cells, rIL-1 receptor antagonist (IL-1Ra) was added to the cultures. The addition of rIL-1Ra did lead to a significant reduction in the number of IL-17–producing cells (Figure 6B, and summarized in 6C). In addition, based on results obtained in the mouse, we analyzed the effect of TGFβ supplementation. We observed no enhancing effect of the addition of TGFβ to the cultures (Figure S2).
IL-1β, IL-21, and IL-23 boost differentiation of CD25highCD27pos Tregs into IL-17–producing cells in the obligatory presence of IL-2/IL-15; differentiation is regulated by histone deacetylases. Flow cytometry of sorted CD25highCD27posCD45RAnegCD4pos (CD25highCD27pos) Tregs and CD25negCD27posCD45RAnegCD4pos (CD25negCD27pos) Teffs that were stimulated with allogeneic PBMCs in the absence or presence of rIL-2, rIL-1β, rIL-6, or combinations thereof (A) or in the presence of rIL-1β or rIL-1 receptor antagonist (IL-1Ra) (B) or anti–IL-23 (D), IL-21, IL-23 (E), or the HDAC inhibitor trichostatin A (TSA) (F). Density plots show intracellular IL-17 and Foxp3 expression at day 8 of the cultures after restimulation of the cells with PMA plus ionomycin in the presence of Brefeldin A. Forward side scatter plots for panel A are shown in Figure S1. Data are representative of 4 (A) or 3 (B) separate experiments conducted with cells obtained from different blood donors. (C) Summary figure of 3 different experiments, using cells from 3 different blood donors, showing the percentages of IL-17–producing cells (y-axis) after culture of CD25highCD27pos Tregs using the indicated conditions (x-axis). Individual measurements and mean are indicated. (D) Anti–IL-23 did not hamper the differentiation of these cells into IL-17–producing cells. (E) IL-21 and IL-23 promote Treg differentiation into IL-17 cells. (F) TSA prevents Treg differentiation into IL-17 cells and promotes Foxp3 expression. Figures in panels D through F show cumulative data obtained from 3 or more experiments performed with cells obtained from different donor.
IL-1β, IL-21, and IL-23 boost differentiation of CD25highCD27pos Tregs into IL-17–producing cells in the obligatory presence of IL-2/IL-15; differentiation is regulated by histone deacetylases. Flow cytometry of sorted CD25highCD27posCD45RAnegCD4pos (CD25highCD27pos) Tregs and CD25negCD27posCD45RAnegCD4pos (CD25negCD27pos) Teffs that were stimulated with allogeneic PBMCs in the absence or presence of rIL-2, rIL-1β, rIL-6, or combinations thereof (A) or in the presence of rIL-1β or rIL-1 receptor antagonist (IL-1Ra) (B) or anti–IL-23 (D), IL-21, IL-23 (E), or the HDAC inhibitor trichostatin A (TSA) (F). Density plots show intracellular IL-17 and Foxp3 expression at day 8 of the cultures after restimulation of the cells with PMA plus ionomycin in the presence of Brefeldin A. Forward side scatter plots for panel A are shown in Figure S1. Data are representative of 4 (A) or 3 (B) separate experiments conducted with cells obtained from different blood donors. (C) Summary figure of 3 different experiments, using cells from 3 different blood donors, showing the percentages of IL-17–producing cells (y-axis) after culture of CD25highCD27pos Tregs using the indicated conditions (x-axis). Individual measurements and mean are indicated. (D) Anti–IL-23 did not hamper the differentiation of these cells into IL-17–producing cells. (E) IL-21 and IL-23 promote Treg differentiation into IL-17 cells. (F) TSA prevents Treg differentiation into IL-17 cells and promotes Foxp3 expression. Figures in panels D through F show cumulative data obtained from 3 or more experiments performed with cells obtained from different donor.
Thus, Treg signaling via IL-2 or IL-15 appears a prerequisite to induce differentiation of regulatory T cells into IL-17–producing cells. Once IL-2/IL-15 are present, the local cytokine microenvironments may then fine-tune the effector fate of the Treg population, as is clearly demonstrated by the opposite effect of IL-1 and IL-1Ra.
Both rIL-23 and rIL-21 enhance Treg differentiation into IL-17–producing cells
Next to IL-1β, IL-23 has been reported to induce IL-17 production in human conventional T cells.18,19 To address the role of IL-23 in our experimental system, we used neutralizing anti–IL-23 mAb. The addition of anti–IL-23 mAb to Tregs stimulated with allogeneic PBMCs in the presence of IL-2/15 or IL-2/IL-15/IL-1β did not hamper the differentiation of Tregs into IL-17–producing cells (Figure 6D). The neutralizing capacity of the anti–IL-23 mAb was demonstrated by preventing rIL-23–enhanced IL-17 induction (Figure 6D). Second, we analyzed whether rIL-23 or rIL-21, the latter was effective in generation of Th17 cells in mice,31,32 had the potential to enhance Treg differentiation into IL-17–producing cells. Upon Treg stimulation with PBMCs and IL-2 plus IL-15, the coaddition of rIL-23 or rIL-21 (IL-21 was effective in 50% of our experiments) led to an increased production of IL-17–producing cells (Figure 6E). In the absence of IL-2 plus IL-15, rIL-23 and rIL-21 were not effective (data not shown).
Deacetylase inhibition prevents Treg differentiation into IL-17–producing cells and sustains Foxp3 expression
Histone/protein deacetylases (HDACs) regulate chromatin remodeling, gene expression, and the functions of many transcription factors and nonhistone proteins. Optimal Treg function required acetylation of the forkhead domain of Foxp3.33 The HDAC inhibitor (HDACi) trichostatin A (TSA) increased Foxp3 gene expression, as well as the production and suppressive function of regulatory T cells.33 We thus hypothesized that inhibition of HDAC activity might lead to reduced differentiation of Tregs into IL-17–producing cells, thus favoring maintenance of Foxp3-expressing cells. To examine this, sorted Tregs were stimulated with allogeneic PBMCs in the presence of IL-2 plus IL-15 and IL-1β to optimally stimulate differentiation of Tregs into IL-17–producing cells, with and without HDACi. HDAC inhibition almost completely prevented the differentiation of Tregs into IL-17–producing cells (Figure 6F), while sustaining numbers of Foxp3-expressing cells (Figure 6F). This occurred irrespective of the effect of the HDACi on proliferation (data not shown). Thus, the data imply that the mechanism of Treg differentiation into IL-17–producing cells in our system is dependent on epigenetic modification.
CCR6 identifies IL-17–producing cells derived from CD25highCD27pos Tregs
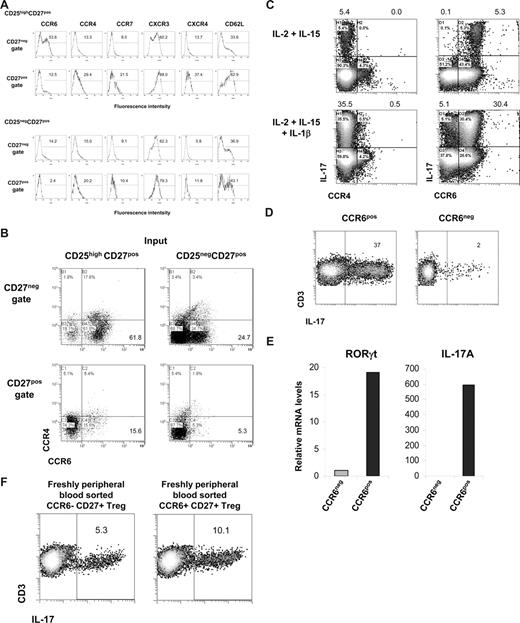
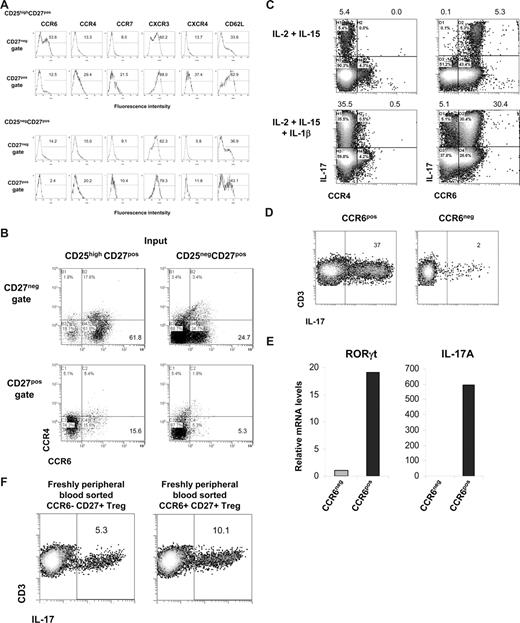
As shown in Figure 3, after the differentiation of CD25highCD27pos Tregs into IL-17–producing cells, these cells were found to reside within the emerging CD27neg population. Here, we sought to determine which cell surface marker positively identifies this IL-17–producing population. First, we measured expression of the homing/chemokine receptors CCR6, CCR4, CCR7, CXCR3, CXCR4, and CD62L upon allogeneic stimulation of CD25highCD27pos Tregs and, for comparison, of CD25negCD27pos Teffs. The CD27neg T cells that differentiated from CD25highCD27pos Tregs clearly showed a high number of CCR6-expressing cells (> 50%; Figure 7A). This was distinct from both CD27pos cells that differentiated from CD25highCD27pos Tregs, and CD27pos and CD27neg cells differentiating from the CD25negCD27pos Teffs. The majority of CCR6-expressing CD27neg cells lacked expression of CCR4 (Figure 7B). Indeed, this CD27negCCR4negCCR6pos cell fraction, obtained after allogeneic stimulation of CD25highCD27pos, produced IL-17, especially after addition of IL-1β (Figure 7C), which was confirmed after sorting of the CCR6pos cells (Figure 7D). These CCR6pos cells showed high expression of the Th17-associated transcription factor RORγt mRNA that was paralleled by high IL-17mRNA levels (Figure 7E). This was in contrast to the CCR6neg population that revealed low amounts of RORγt and an absence of IL-17 mRNA (Figure 7E).
Differentiated IL-17–producing CD25highCD27pos Tregs are characterized by the expression of CCR6. Sorted CD25highCD27posCD45RAnegCD4pos (CD25highCD27pos) Tregs and CD25negCD27pos CD45RAnegCD4pos (CD25negCD27pos) Teffs that were stimulated with allogeneic PBMCs and rIL-2 plus rIL-15 for 8 days. (A) Cell surface analysis of the indicated receptors (top) at day 8 of culture in the CD27neg and CD27pos cell gates (indicated at the left) after stimulation of CD25highCD27pos Tregs (top 2 rows) and CD25negCD27pos Teffs (bottom 2 rows). Histograms show forward scatter (FSC; y-axis) and fluorescence intensity (x-axis); numbers indicated percentage of positive cells. (B) Dot plots show combined CCR6 and CCR4 expression of the cells as described in panel A. (C) Sorted CD25highCD27pos Tregs were cultured for 8 days with allogeneic PBMCs in the presence of the indicated recombinant cytokines (left). After restimulation with PMA plus ionomycin in the presence of Brefeldin A intracellular IL-17 expression in CCR4- (left) and CCR6- (right) expressing cells was analyzed in the CD27neg cell gate. (D) Sorted CD25highCD27pos Tregs were cultured with allogeneic PBMCs in the presence of rIL-2, rIL-15, and rIL-1β. At day 8 of the culture the cells were stained with anti–CD27-FITC plus anti–CCR6-PE mAb, and subsequently the CD27negCCR6pos (CCR6pos) and CD27negCCR6neg (CCR6neg) cell populations were sorted by high-purity flow cytometric cell sorting. IL-17 production was measured as described in panel C. Density plots show IL-17 production (x-axis) and CD3 expression (y-axis). Explanatory figures are provided in Figure S3. (E) Real-time quantitative RT-PCR of the mRNA expression of RORγt and IL-17 in sorted CD27negCCR6pos (CCR6pos) and CD27negCCR6neg (CCR6neg) cell populations. The RT-PCR data shown were normalized to human HPRT1 levels, and expression in sorted CD27negCCR6neg cells obtained after differentiation of CD25negCD27pos Teffs was set as 1.0. Data in panels A through E are representative of 3 separate experiments performed with cells obtained form different blood donors. (F) Freshly peripheral blood sorted CD25highCD27posCD45RAnegCCR6pos Tregs and CD25highCD27posCD45RAnegCCR6neg Tregs were stimulated and analyzed as described in panel C. One of 3 similar experiments is shown. (Explanatory figures are provided in Figure S3.)
Differentiated IL-17–producing CD25highCD27pos Tregs are characterized by the expression of CCR6. Sorted CD25highCD27posCD45RAnegCD4pos (CD25highCD27pos) Tregs and CD25negCD27pos CD45RAnegCD4pos (CD25negCD27pos) Teffs that were stimulated with allogeneic PBMCs and rIL-2 plus rIL-15 for 8 days. (A) Cell surface analysis of the indicated receptors (top) at day 8 of culture in the CD27neg and CD27pos cell gates (indicated at the left) after stimulation of CD25highCD27pos Tregs (top 2 rows) and CD25negCD27pos Teffs (bottom 2 rows). Histograms show forward scatter (FSC; y-axis) and fluorescence intensity (x-axis); numbers indicated percentage of positive cells. (B) Dot plots show combined CCR6 and CCR4 expression of the cells as described in panel A. (C) Sorted CD25highCD27pos Tregs were cultured for 8 days with allogeneic PBMCs in the presence of the indicated recombinant cytokines (left). After restimulation with PMA plus ionomycin in the presence of Brefeldin A intracellular IL-17 expression in CCR4- (left) and CCR6- (right) expressing cells was analyzed in the CD27neg cell gate. (D) Sorted CD25highCD27pos Tregs were cultured with allogeneic PBMCs in the presence of rIL-2, rIL-15, and rIL-1β. At day 8 of the culture the cells were stained with anti–CD27-FITC plus anti–CCR6-PE mAb, and subsequently the CD27negCCR6pos (CCR6pos) and CD27negCCR6neg (CCR6neg) cell populations were sorted by high-purity flow cytometric cell sorting. IL-17 production was measured as described in panel C. Density plots show IL-17 production (x-axis) and CD3 expression (y-axis). Explanatory figures are provided in Figure S3. (E) Real-time quantitative RT-PCR of the mRNA expression of RORγt and IL-17 in sorted CD27negCCR6pos (CCR6pos) and CD27negCCR6neg (CCR6neg) cell populations. The RT-PCR data shown were normalized to human HPRT1 levels, and expression in sorted CD27negCCR6neg cells obtained after differentiation of CD25negCD27pos Teffs was set as 1.0. Data in panels A through E are representative of 3 separate experiments performed with cells obtained form different blood donors. (F) Freshly peripheral blood sorted CD25highCD27posCD45RAnegCCR6pos Tregs and CD25highCD27posCD45RAnegCCR6neg Tregs were stimulated and analyzed as described in panel C. One of 3 similar experiments is shown. (Explanatory figures are provided in Figure S3.)
Given the fact that previously CCR6 has been associated with proinflammatory Th17 cells, we set out to exclude that our finding was not so much a result of outgrowth of preexisting Th17 CCR6pos cells, but indeed a result of differentiating Tregs. Thus, we performed CCR6 subsorting of freshly isolated Tregs. We provided evidence that CCR6pos, and more importantly, that CCR6neg cells differentiated into IL-17–producing cells (Figure 7F), thereby further substantiating our findings on Treg plasticity.
Discussion
Like Th1 and Th2, it is now generally assumed that Th17 cells evolved to provide adaptive immunity to encounter specific classes of pathogens.6 In mice, differentiation of naive CD4pos T cells into Th17 cells is controlled by the presence of the cytokines TGFβ and IL-6 in the microenvironment.7-9 Of note, Th17 development from naive CD4 T cells is clearly different in the human system18,19,34 where IL-1, IL-6, and IL-23 were found to be key in this process. In contrast to the latest studies, describing Th17 differentiation from the naive T-cell pool, we have focused our studies on the plasticity of the T regulatory arm of the immune system, and analyzed differentiation of human CD4+Foxp3+ Tregs into IL-17–producing cells.
Our main finding, as summarized in Figure S4, is that stimulation of highly purified human CD4posCD25highCD27posCD45RAnegFoxp3pos Tregs with allogeneic PBMCs in the presence of exogenous r-IL2/rIL-15 led to a subset of IL-17–producing cells. IL-2 and/or IL-15 appeared obligatory for this differentiation process, which was most salient in the presence of APCs such as monocytes. Induction of IL-17 production by CD4posCD25highCD27posCD45RAnegFoxp3pos Tregs required cell division that was accompanied by the loss of CD27 and Foxp3 protein expression. Single-cell analysis of differentiated Tregs indicated that the IL-17–producing cells expressed CCR6 and the IL-17–associated transcription factor RORγt mRNA. Cells still demonstrated suppressive capacity, albeit to a lesser extent than freshly isolated Tregs. Coexpression of IL-17 and IL-21, IL-22, and IFNγ (∼ 10%, ∼ 47%, and ∼ 37% of IL-17–producing cells, respectively) was observed (H.J.P.M.K. and I.J., unpublished observations, February 2008). Finally, given that IL-2 or IL-15 is present, the IL-1/IL-1R antagonist system was found to control this Treg differentiation program. We demonstrated that the differentiation of Tregs into IL-17–producing cells depends on histone/protein deacetylase (HDAC) activity. Inhibition of HDAC activity prevented differentiation into IL-17–producing cells and resulted in sustained Foxp3 expression. Support for this latter observation came from a recent study demonstrating that optimal Treg function requires acetylation of the forkhead domain of Foxp3, leading to increased Foxp3 gene expression and the production of regulatory cells with suppressive function.33 Our findings indicate that human CD45RA− Tregs (and CD45RA+ Tregs; data not shown) differentiate into IL-17–producing T cells, thereby revealing a high plasticity of Tregs, which is controlled by cytokines in the local microenvironment and as our data suggest is regulated by epigenetic remodeling.
We have thoroughly examined the possibility that the IL-17–producing cells in our cultures arose from contaminating CD4posCD25pos effector, memory cells or CD4posCD25neg T cells. First of all, the acquisition of the IL-17 phenotype that we describe in Tregs was conducted using a well-defined population of highly purified CD4posCD25highCD27posCD45RAneg peripheral Tregs. These cells expressed the transcription factor Foxp3 and lacked expression of the IL-7 receptor (CD127), both of which are considered as hallmarks of true Tregs.35,36 Moreover, given that effector/memory cells express CD127,37,38 this clearly differentiates these cells from Tregs. Second, both Tregs and activated (effector/memory) T cells express CD25. However, they do differ in expression level; Tregs express high levels of CD25, whereas activated CD4pos T cells express intermediate levels of CD25.35,36,39 In our culture system, we readily found IL-17 production in the sorted CD25highCD27pos Treg population, but it was virtually absent in the CD25intermediateCD27pos T cells (data not shown). Third, for comparison, memory CD4posCD25negCD27posCD45RAneg T cells that were Foxp3neg and CD127pos were included throughout our experiments. These cells, compared with CD4posCD25high Tregs, always responded in a completely different fashion with respect to cytokine production profile (almost no IL-17 production), cell surface marker expression, and the presence of transcription factors (Figures 1,2). Importantly, IL-17–producing cells were not simply the result of outgrowth of already differentiated CCR6pos Th17 cells, since they emerged from both purified CCR6pos and CCR6neg Treg subsets (Figure 7F).
To further substantiate our finding that bona fide Tregs can acquire an IL-17 phenotype, we showed that a highly dedicated Treg subset (CD25highFoxp3highCD27posCD62LposCTLA4high; revealing 50% inhibition at Treg/Teff ratios of at least 1:100)24 was still capable of differentiating toward the IL-17 phenotype (data not shown). Together this implies that it is highly unlikely that in our experimental system the IL-17–producing cells were a result of contaminating outgrowth.
The expression of chemokine receptors has been instrumental in the characterization of T-cell subsets.40 We found that the IL-17–producing cells that differentiated from Tregs were contained within the CD27neg cell population, expressed CCR6, and showed expression of RORγt mRNA. Strikingly, others have recently reported that under physiologic conditions and at inflamed sites, human IL-17–producing cells were contained within the CCR6posCD4pos memory T-cell population,15,16 which gives rise to questions on the origin of these tissue-infiltrating cells, which are so far unresolved. The expression of CCR6 enables migration induced by the ligands CCL20 and β-defensin, which are associated mainly with inflamed sites,41,42 as well as in peripheral tissues such as the skin.43 The latter adds to the tissue-infiltrating and injurious properties assigned to Th17 cells.
In the current study, we show that Treg differentiation into IL-17–producing cells is cell division–dependent. In accordance, we demonstrate that IL-2 or IL-15, which share common β and γ chains, are obligatory in this differentiation process. Indeed, Tregs strongly depend on growth factors (in particular IL-2) that are crucial for their development, survival, and proliferation.44-46 Of note, Th17 differentiation from naive T cells in the mouse was antagonized by IL-2 signaling.47,48 Thus, the acquisition of IL-17 phenotype within the T-regulatory arm of the immune system may require additional control mechanisms distinct from the factors regulating the naive T-cell developmental pathways.
We here report that the proinflammatory cytokine IL-1β, in the presence of IL-2 and/or IL-15, enhanced IL-17 production in human Tregs, a process that was counteracted by its natural antagonist IL-1Ra. Although endogenous IL-6 was produced in our experimental setup, IL-6 mAb-neutralizing experiments did not prevent the emergence of IL-17–producing cells (data not shown), and exogenously added rIL-6 did not enhance IL-17. Addition of rIL-6 to exogenously added rIL-1β provided inconsistent results in terms of IL-17 enhancement (variation between individuals). Neutralizing IL-23 mAbs did not prevent Treg differentiation into IL-17 cells, suggesting a limited role for IL-23 in our experimental setup of PBMC stimulation in the presence of IL-2 + IL-15. The addition of TGFβ, associated with the induction of Th17 cells in mice, had no enhancing effect. Only very recently, it was shown that the differentiation of human naive CD4pos T cells into Th17 effector cells is governed by IL-1β, IL-6, and IL-23, but not TGFβ.18,19 Interestingly, in our hands, IL-1β, but also IL-23, had major effects on the induction of IL-17 in Tregs, whereas this effect on the similarly treated Teff population was much less outspoken. The biologic implication of the IL-1/IL-1Ra control system has been made explicit in both mice and humans. Abnormal T-cell activation caused by the imbalance of the IL-1/IL-1Ra system was responsible for the development of experimental autoimmune encephalomyelitis,49 and in IL-1Ra knockout mice IL-17 production was increased and associated with increased arthritis severity.50 In line with this, the blocking of IL-17 suppressed inflammation at the level of the joint in experimental arthritis.51
In human autoimmune disease, in MS patients, IL-1β was present in lesions, and patients with a high IL-1β to IL-1Ra production ratio were at a greater risk of having a family member with relapse-onset MS than those with a low ratio.52 Indeed, IL-1 has been reported to break tolerance by promoting both proliferation and cytokine production of CD4pos effector/memory T cells, and by attenuating Treg suppressor function.53 Our data suggest that the latter may be explained by induction of IL-17–producing cells from Tregs. Whether these Treg-derived IL-17–producing cells indeed have tissue-injurious properties remains to be established.
To date, information on human Treg development and differentiation is limited. Importantly, we now demonstrate that human Foxp3+ Treg also possess an effector differentiation program resulting in IL-17 production. Our data suggest that epigenetic modification underlies this phenomenon. This flexibility in Treg differentiation programming may have evolved to anticipate local microenvironmental needs and serves to control the wide variety of immune responses that take place at distinct anatomic sites. In addition, because thymic egress of naive cells is rapidly lost with age, this type of plasticity, whereby predefined lineage barriers are crossed, may in fact serve a more general phenomenon enabling homeostatic maintenance and optimal immune surveillance.
This feature of Treg development can be exploited to facilitate vaccination strategies and tumor immunotherapy. However, on the downside, it may have implications for the clinical application of ex vivo–expanded Tregs as part of tolerance induction strategies.
The online version of this article contains a data supplement.
The publication costs of this article were defrayed in part by page charge payment. Therefore, and solely to indicate this fact, this article is hereby marked “advertisement” in accordance with 18 USC section 1734.
Acknowledgments
We thank R. Woestenenk and J. van Velzen, Central Hematology Laboratory (CHL), Radboud University Nijmegen Medical Centre (RUNMC) for expert cell sorting, and H. Tijssen and E. Fasse, Department of Blood Transfusion and Transplantation Immunology (ABTI), RUNMC for RT-PCR analysis and technical assistance.
Authorship
Contribution: H.J.P.M.K., R.L.S., P.M.V., A.M.H.B., and I.J. designed research; H.J.P.M.K., R.L.S., P.M.V., and E.R. performed research; H.J.P.M.K., R.L.S., P.M.V., E.R., A.M.H.B., and I.J. analyzed data; and H.J.P.M.K., A.M.H.B., and I.J. wrote the paper.
Conflict-of-interest disclosure: The authors declare no competing financial interests.
Correspondence: H. Koenen, Radboud University Nijmegen Medical Centre, Department of Blood Transfusion and Transplantation Immunology (Route 469), Postbox 9101, 6500 HB Nijmegen, The Netherlands; e-mail: h.koenen@abti.umcn.nl.

