Abstract
Our recent studies have shown that immune cell–produced complement provides costimulatory and survival signals to naive CD4+ T cells. Whether these signals are similarly required during effector cell expansion and what molecular pathways link locally produced complement to T-cell survival were not clarified. To address this, we stimulated monoclonal and polyclonal T cells in vitro and in vivo with antigen-presenting cells (APCs) deficient in the complement regulatory protein, decay accelerating factor (DAF), and/or the complement component C3. We found that T-cell expansion induced by DAF-deficient APCs was augmented with diminished T-cell apoptosis, whereas T-cell expansion induced by C3−/− APCs was reduced because of enhanced T-cell apoptosis. These effects were traced to locally produced C5a, which through binding to T cell–expressed C5aR, enhanced expression of Bcl-2 and prevented Fas up-regulation. The results show that C5aR signal transduction in T cells is important to allow optimal T-cell expansion, as well as to maintain naive cell viability, and does so by suppressing programmed cell death.
Introduction
Immunogenic stimuli induce T lymphocytes to proliferate and differentiate, but to maintain homeostasis as the immune response wanes, the majority of effector T cells must die. This tightly controlled contraction phase is mediated by Bcl-2–regulated, Bim-dependent, programmed T-cell death,1,2 although evidence also suggests a role for Fas/FasL interactions.3,4 The molecular signals that trigger these proapoptotic pathways at the peak of the effector T-cell repertoire expansion are not fully delineated.
In prior reports by our joint group, we showed that upon cognate interactions, T cells and antigen-presenting cells (APCs) produce complement proteins and that the locally secreted and activated components are intimately involved in T-cell activation and proliferation.5-7 We provided additional mechanistic insights into the effects of complement on T-cell immunity by showing that the absence or blockade of C5, or the anaphylatoxin receptors C5aR and C3aR, prevents APC activation and impairs the survival of naive T cells.7
Herein we demonstrate that locally produced C5a through ligating T cell–expressed C5aR signals to control effector T-cell apoptosis via regulating T-cell expression of Bcl-2 and Fas (CD95). Together with our previous findings that complement confers T-cell costimulation and activates APCs,6,7 this documentation that C5a mediates effector T-cell apoptosis underscores complement's fundamental role as a regulator of T-cell immune responses.
Methods
Mice
C57BL/6 (B6), Thy1.1, B6.MRLlpr, wild-type (WT) C57BL/6xBalb/c F1 (H-2bxd), and B6.C3−/− mice (all H-2b) were purchased from The Jackson Laboratory (Bar Harbor, ME) and backcrossed more than 6 generations onto the Balb/c (H-2d) background. Mice deficient in the daf1 gene (Daf1−/−) were produced as described8 and backcrossed for more than 10 generations to B6. B6 mice do not reject Daf1−/− skin (not shown) confirming congenicity. Mar T-cell receptor (TCR) transgenic mice (CD4+, RAG2−/−, anti-HYDby + I-Ab) were a gift from Polly Matzinger (National Institutes of Health). H-2bDaf1−/− mice were crossed to H-2bC3−/− mice in our animal facility. C5aR−/− mice (H-2b) were obtained as a gift from Craig Gerard (Boston Children's Hospital, Boston, MA). All mice were housed in the Cleveland Clinic or Mount Sinai School of Medicine Biologic Resources Units in accordance with guidelines of the American Association for Accreditation of Laboratory Animal Care. All studies were performed under the approval of the animal care committees at Mount Sinai or the Cleveland Clinic.
Antibodies and reagents
Anti–mouse CD4 phycoerythrin (PE)-Cy5, CD11b PerCP-Cy5.5, Fas (CD95) PE, FasL (CD178) PE, anti–interferon-γ PE, anti–Bcl-2 PE, antiactive caspase-3-fluorescein isothiocyanate monoclonal antibody (mAb) apoptosis kit (intracellular staining kits), and annexin V–PE for flow cytometry, and blocking anti-FasL (clone MFL3) were purchased from BD Biosciences PharMingen (San Diego, CA). Carboxy-fluorescein diacetate succinimydyl ester (CFSE) was obtained from Invitrogen (Carlsbad, CA). The PI-3Kγ–specific inhibitor AS252424 was purchased from Cayman Chemical (Ann Arbor, MI).
Real-time polymerase chain reaction
Cellular RNA was prepared using a Qiagen RNeasy Mini kit (Qiagen, Valencia, CA) and reverse-transcribed to cDNA using a High Capacity cDNA Archive Kit (Applied Biosystems, Foster City, CA). Expression levels for mouse Bcl-2 were compared with mouse MRPL32 using TaqMan Gene Expression assays on an Applied Biosystems 7500 Fast system with TaqMan Fast Universal Master Mix.
Cell isolation, labeling, and culture
T cells were isolated from spleen and lymph nodes of naive mice and isolated using a negative T-cell selection kit (StemCell Technologies, Vancouver, BC) according to manufacturer's specification (purity, 93%–98% CD3+). CFSE-labeled cells were cultured with thioglycollate-induced peritoneal macrophages5,6 derived from WT, Daf1−/−, C3−/−, and Daf1/C3−/− mice. T cells were activated in 48-well plates in serum-free HL-1 media (Invitrogen) supplemented with 1% l-glutamine and 1% penicillin/streptomycin in a 2:1 T-cell/APC ratio with 0.1 μM HYDby for 24 to 120 hours; 10 μg/mL of anti-FasL (clone MFL3) or isotype control was added to selected cultures.
Bone marrow chimeras
Male WT Thy1.1+, Daf1−/−, and C3−/− mice were irradiated (1200 cGy) and injected with 10 × 106 WT Thy1.2+, Daf1−/−, or C3−/− bone marrow cells, treated with gentamicin for 10 days, and used as recipients for cell transfers more than 21 days after reconstitution. Donor BM chimerism was verified by flow cytometry.
Flow cytometry
Cell surface and intracellular staining was performed as described.5,6 Samples were collected using a FACScan, FACSCalibur, or Canto II (BD Biosciences PharMingen) and analyzed using WinList (Verity Software House, Topsham, ME) or FlowJo (TreeStar, Ashland, OR). For in vivo mixed lymphocyte response (MLR), CFSE-labeled T cells were injected intravenously into WT, Daf1−/−, and C3−/−. Spleens from injected mice were harvested at 60 hours and stained for Fas, FasL, annexin V, and intracellular interferon-γ.
Serum C3 uptake assay
C3 uptake assays were performed as described in our previous work.5 Freshly isolated serum from bone marrow chimeric mice was incubated at 37°C for 1 hour with zymosan A (Sigma-Aldrich, St Louis, MO), which was then stained for C3 deposition using fluorescein isothiocyanate-labeled polyclonal goat anti-C3 mAb (MP Biomedicals, Irvine, CA) and assayed by flow cytometry.
Statistical analysis
To determine whether groups were statistically different, results were compared using the Student t test. A P value less than .05 was considered significant.
Results
Locally activated complement enhances T-cell expansion
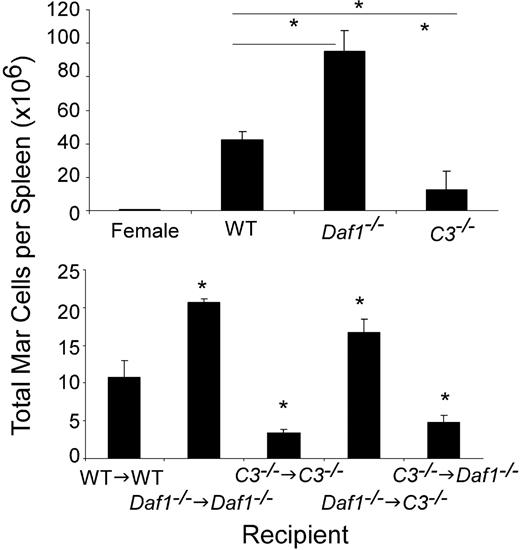
To determine whether, in addition to sustaining the viability of naive T cells,7 local complement production by T-cell/APC partners is essential for sustaining the viability of activated effector T cells, we injected equal numbers of GFP-transgenic, major histocompatibility complex class II–restricted Mar T cells (specific for HYDby plus I-Ab) into WT male (or control female) or into Daf1−/− or C3−/− recipients and assessed the number of GFP+ Mar cells in the spleen by flow cytometry (Figure 1 top). We detected significantly more (∼2-fold) Mar T cells in the spleens of Daf1−/− than WT males and approximately 3-fold less Mar cells in the spleens of C3−/− males. In a parallel set of studies, we transferred equal numbers (5 million) of H-2k T cells into allogeneic H-2d WT or C3−/− hosts and after 7 days determined the number of donor-derived T cells in the spleens. As found for the peptide-specific T cells, we detected markedly fewer T cells in the C3−/− recipients (0.19 × 10⁶/spleen in C3−/− vs 5.1 × 10⁶/spleen in WT, P < .05, representative of 2 experiments, 2-3 animals per group, data not shown). These data show that the effects of complement on T-cell immunity are sustained during activation and are robust in vivo.
APC-expressed C3 and DAF influence in vivo T-cell expansion. (Top) Absolute number of splenic GFP Mar T cells (percentage of GFP+CD4+ cells in the spleen multiplied by the total number of spleen cells) on day 4 after injection of 10 × 106 GFP+ Mar T cells into groups of male WT, Daf1−/−, or C3−/− or female control recipients (means ± SD of 3 or 4 animals/group). *P < .05. The total numbers of spleen cells in the male Daf1−/− mice (445 million) were significantly more than in the WT (252 million) or C3−/− (127 million) mice. (Bottom) Groups of male bone marrow chimeric mice (n = 3/group) were injected with 5 × 10⁶ CFSE-labeled Mar T cells, and total numbers of Mar cells in the spleen were quantified by flow cytometry (CFSE+/Vβ6+) on day 4. *P < .05 versus WT→WT control, n = 3 or 4 per group.
APC-expressed C3 and DAF influence in vivo T-cell expansion. (Top) Absolute number of splenic GFP Mar T cells (percentage of GFP+CD4+ cells in the spleen multiplied by the total number of spleen cells) on day 4 after injection of 10 × 106 GFP+ Mar T cells into groups of male WT, Daf1−/−, or C3−/− or female control recipients (means ± SD of 3 or 4 animals/group). *P < .05. The total numbers of spleen cells in the male Daf1−/− mice (445 million) were significantly more than in the WT (252 million) or C3−/− (127 million) mice. (Bottom) Groups of male bone marrow chimeric mice (n = 3/group) were injected with 5 × 10⁶ CFSE-labeled Mar T cells, and total numbers of Mar cells in the spleen were quantified by flow cytometry (CFSE+/Vβ6+) on day 4. *P < .05 versus WT→WT control, n = 3 or 4 per group.
To document that the in vivo effects of C3 and DAF on T-cell expansion (Figure 1 top) relate to local (immune cell–produced) as opposed to systemic (liver-derived/serum) complement, we produced chimeras of Daf1−/− BM → C3−/− male recipients (no C3 in serum, BM cells produce C3 without DAF-regulation), C3−/− BM → Daf1−/− recipients (serum C3 present, BM cells C3-deficient, no DAF regulation on non-BM cells), and syngeneic controls (C3−/− BM → C3−/−, Daf1−/− BM → Daf1−/−). A zymosan C3 uptake assay performed 3 weeks later documented that serum C3 was present in the C3−/− BM → Daf1−/− and Daf1−/− BM → Daf1−/− recipients and absent in the Daf1−/− BM → C3−/− and C3−/− BM → C3−/− recipients (Figure S1, available on the Blood website; see the Supplemental Materials link at the top of the online article). When we injected WT Mar T cells into the chimeric animals and determined the number of splenic Mar T cells on day 4, we found that Mar T cells expanded more in recipients with Daf1−/− BM and less in recipients with C3−/− BM, irrespective of serum C3 or C3 expression by non–BM-derived cells. These results formally verify that, during cognate T-cell/APC interactions, the in vivo effects of C3 and DAF on T-cell activation are the result of APC- and T cell–produced complement.
Locally produced and activated complement regulates T-cell apoptosis
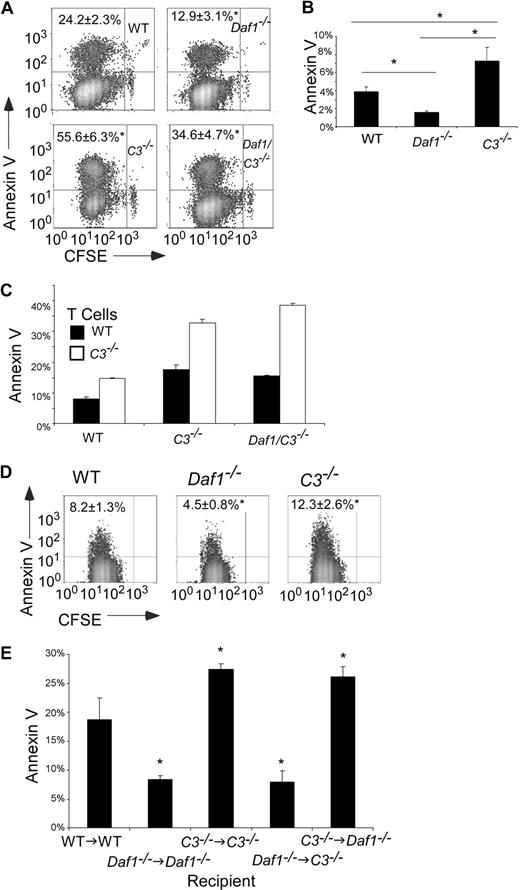
Our previous studies showed that local complement activation enhances T-cell proliferation and differentiation.5-7 Because expansion of effector T cells after antigen stimulation is controlled by the rate of cell death as well as the rate of proliferation,9,10 we tested the effects of APC-derived C3 and DAF on apoptosis of effector T cells. When we mixed CFSE-labeled T cells with antigen-loaded WT, Daf1−/−, C3−/−, or Daf1/C3−/− APCs and examined dividing, effector T cells for annexin V expression by flow cytometry (Figure 2A), we found significantly fewer annexin V+ Mar cells after stimulation with Daf1−/− APCs than after stimulation with WT APCs. Consistent with the effect being the result of augmented activation of APC-produced complement, annexin V staining of antigen-stimulated Mar T cells was higher (more apoptosis) in response to Daf1/C3−/− APCs than in response to Daf1−/− or WT APCs. In further support of this, when we stimulated T cells with C3−/− APCs, we observed significantly more annexin V positivity (Figure 2A). As an alternate readout, we performed TdT-mediated dUTP nick end labeling (TUNEL) assays. The use of Daf1−/− macrophages led to 15% plus or minus 5% TUNEL+ Mar T cells, whereas the use of C3−/− macrophages led to 50% plus or minus 8% TUNEL+ Mar T cells (n = 3 per group, Figure S2), compared with the use of WT macrophages, which led to 42% plus or minus 2% TUNEL+ Mar T cells. Comparable effects on apoptosis were observed with polyclonal alloreactive T cells as fewer C57BL/6 (H-2b) T cells were annexin V+ after stimulation with H-2dDaf1−/− than WT or C3−/− APCs (Figure 2B).
APC-expressed C3 and DAF influence T-cell apoptosis after antigen stimulation. (A) Flow cytometry plots showing annexin V staining of CFSE-labeled Mar T cells on day 3 after stimulation with WT, Daf1−/−, C3−/−, or Daf1/C3−/− macrophages plus HYDby peptide. Percentages of annexin V+ cells are given in the upper left. Data are representative of 4 individual experiments. *P < .05 versus WT APCs. Similar results were found when TUNEL staining was used as a readout (Figure S2). (B) Percentage of annexin V+ polyclonal H-2b T cells on day 4 of in vitro culture with allogeneic H-2d WT, Daf1−/−, or C3−/− macrophages. Values are means plus or minus SD of 3 individual experiments. *P < .05. (C) CFSE-labeled WT or C3−/− H-2d T cells were stimulated in vitro with WT, C3−/−, or Daf1/C3−/− allogeneic H-2b macrophages for 4 days and stained with annexin V. Values are means plus or minus SD of 3 individual experiments. *P < .05 versus WT T cells. (D) Flow cytometry plots depicting annexin V+ Mar T cells in the spleens of recipient mice on day 3 after adoptive transfer (10 × 106 Mar T cells per mouse) into groups of male WT, Daf1−/−, or C3−/− recipients (n = 3 per group). *P < .05 versus WT APCs. (E) Groups of male bone marrow chimeric mice (n = 3) were injected with 5 × 10⁶ CFSE-labeled Mar T cells and Vβ6+ splenic Mar cells were assayed for apoptosis by annexin V staining on day 3. *P < .05 versus WT→WT controls.
APC-expressed C3 and DAF influence T-cell apoptosis after antigen stimulation. (A) Flow cytometry plots showing annexin V staining of CFSE-labeled Mar T cells on day 3 after stimulation with WT, Daf1−/−, C3−/−, or Daf1/C3−/− macrophages plus HYDby peptide. Percentages of annexin V+ cells are given in the upper left. Data are representative of 4 individual experiments. *P < .05 versus WT APCs. Similar results were found when TUNEL staining was used as a readout (Figure S2). (B) Percentage of annexin V+ polyclonal H-2b T cells on day 4 of in vitro culture with allogeneic H-2d WT, Daf1−/−, or C3−/− macrophages. Values are means plus or minus SD of 3 individual experiments. *P < .05. (C) CFSE-labeled WT or C3−/− H-2d T cells were stimulated in vitro with WT, C3−/−, or Daf1/C3−/− allogeneic H-2b macrophages for 4 days and stained with annexin V. Values are means plus or minus SD of 3 individual experiments. *P < .05 versus WT T cells. (D) Flow cytometry plots depicting annexin V+ Mar T cells in the spleens of recipient mice on day 3 after adoptive transfer (10 × 106 Mar T cells per mouse) into groups of male WT, Daf1−/−, or C3−/− recipients (n = 3 per group). *P < .05 versus WT APCs. (E) Groups of male bone marrow chimeric mice (n = 3) were injected with 5 × 10⁶ CFSE-labeled Mar T cells and Vβ6+ splenic Mar cells were assayed for apoptosis by annexin V staining on day 3. *P < .05 versus WT→WT controls.
Because during APC/T-cell interactions, T cells locally produce complement,5 albeit approximately 1000-fold less than the amount produced by APCs,7 we tested whether T cell–derived C3 also limits apoptosis of T cells after T-cell activation. To do this, we performed allogeneic proliferation assays using WT and C3−/− T cells on the H-2d background and WT and C3−/− APCs on the H-2b background. We observed that, after stimulation with H-2bC3−/− APCs, annexin V expression was significantly higher on C3−/− H-2d T cells compared with WT H-2d T cells (Figure 2C), confirming that C3 derived from both T cells and APCs contributes to effector T-cell survival.
We next performed studies to confirm that the results apply in vivo (Figure 2D). Despite injection of equal numbers of naive Mar T cells (> 92% CD62Lhi, CD44lo) into each male animal, we observed fewer annexin V+ Mar T cells on day 3 in Daf1−/− mice (4.5% ± 0.8%) compared with C3−/− (12.3% ± 2.6%) or WT control (8.2% ± 1.3%) animals. When we used chimeric mice as recipients of Mar transfers, the in vivo effects on T-cell annexin V expression (apoptosis) again were completely independent of serum (liver-produced) C3 (Figure 2E).
Locally produced C5a/T cell-expressed C5aR prevents T-cell apoptosis
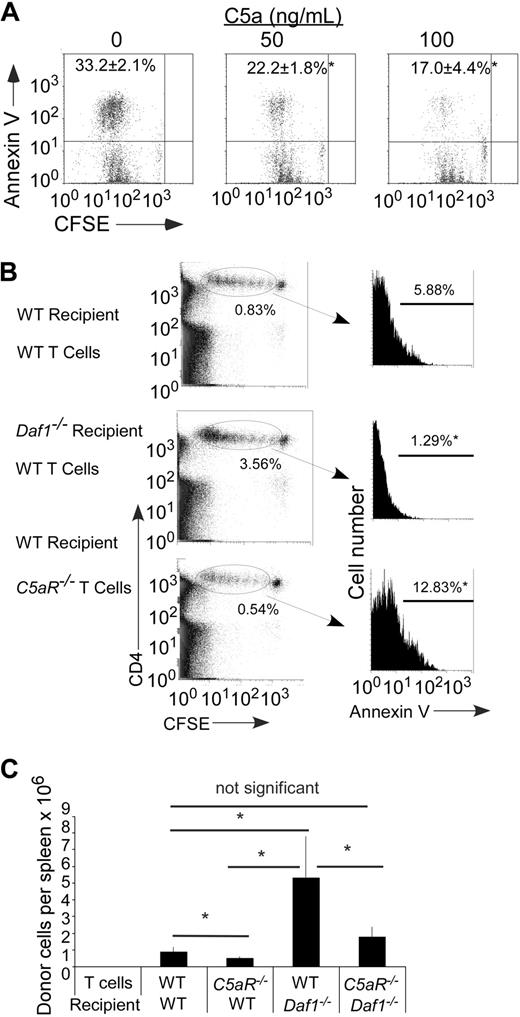
Because (1) DAF inactivates C5 convertases that generate C5a,11,12 (2) C5a regulates T-cell immunity,5,7,13,14 and (3) purified T cells express C5aR,7,15 we next tested whether the effects on T-cell apoptosis/survival are C5a-dependent. To do this, we added recombinant C5a to cultures of Mar T cells stimulated with Dby-loaded WT APCs. As shown in Figure 3A, these studies showed a dose-dependent effect of C5a in limiting T-cell apoptosis.
C5a binding to T cell–expressed C5aR regulates T-cell apoptosis and expansion. (A) Representative flow plots of annexin V+ Mar T cells after in vitro stimulation with H-2b bone marrow dendritic cells plus HYDby peptide+ recombinant mouse C5a. The experiment was repeated with similar results. Numbers in upper left quadrant represent percentage annexin V+ (n = 3 per group). *P < .05 versus no C5a control. (B) Left: Flow plots of polyclonal H-2b WT or C5aR−/− CD4 T cells (CFSE dilution) after injection into (B6xBalb/c) F1 WT or Daf1−/− recipients (day 3, n = 2 or 3/group). The percentages of injected cells per recipient spleen on day 3 are shown. Right: Annexin V expression on the injected cells within the gate. *P < .05 versus WT control. (C) Polyclonal H-2b WT or C5aR−/− CD4 T cells were injected into (B6xBalb/c) F1 WT or Daf1−/− recipients. Total numbers of donor T cells in recipient spleens were determined on day 4 after injection. Data are representative of 2 experiments. *P < .05.
C5a binding to T cell–expressed C5aR regulates T-cell apoptosis and expansion. (A) Representative flow plots of annexin V+ Mar T cells after in vitro stimulation with H-2b bone marrow dendritic cells plus HYDby peptide+ recombinant mouse C5a. The experiment was repeated with similar results. Numbers in upper left quadrant represent percentage annexin V+ (n = 3 per group). *P < .05 versus no C5a control. (B) Left: Flow plots of polyclonal H-2b WT or C5aR−/− CD4 T cells (CFSE dilution) after injection into (B6xBalb/c) F1 WT or Daf1−/− recipients (day 3, n = 2 or 3/group). The percentages of injected cells per recipient spleen on day 3 are shown. Right: Annexin V expression on the injected cells within the gate. *P < .05 versus WT control. (C) Polyclonal H-2b WT or C5aR−/− CD4 T cells were injected into (B6xBalb/c) F1 WT or Daf1−/− recipients. Total numbers of donor T cells in recipient spleens were determined on day 4 after injection. Data are representative of 2 experiments. *P < .05.
To prove that T cell–expressed C5aR participates in preventing initiation of the apoptotic process, we evaluated annexin V staining on C5aR−/− T cells. Exploiting an in vivo MLR model, we injected CFSE-labeled H-2b CD4+C5aR−/− or WT T cells into allogeneic WT or Daf1−/− H-2d recipients and after 3 days assessed CSFE-labeled cells in the spleens by flow cytometry. The absence of T-cell C5aR expression significantly augmented annexin V staining on the proliferating T cells (Figure 3B), resulting in markedly fewer surviving T cells in the spleens of the recipients (Figure 3C). In confirmation of this, we detected similarly greater annexin V staining when C5aR−/− T cells were stimulated in an in vitro MLR (data not shown).
C5a enhances T-cell survival by increasing Bcl-2 expression and decreasing Fas expression
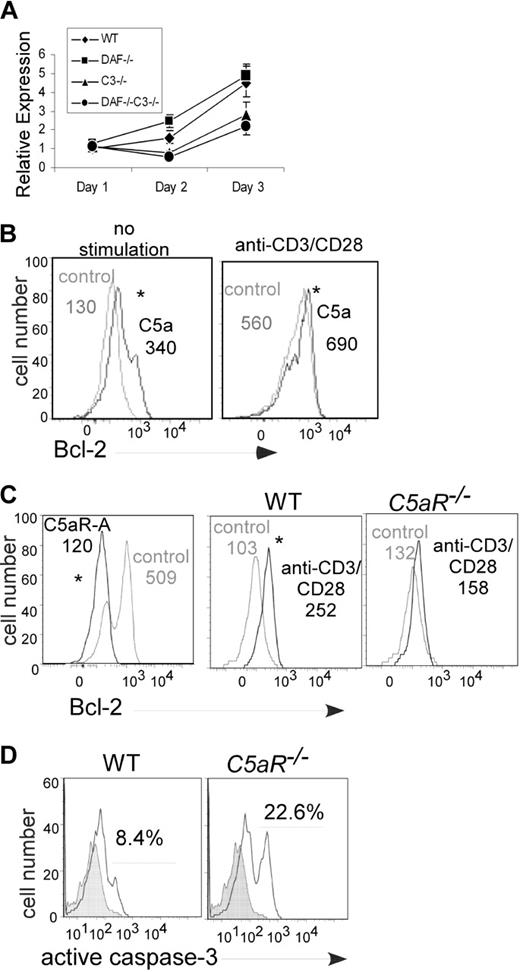
Control of T-cell expansion through regulation of apoptosis in vivo has largely been attributed to inhibiting intrinsic mitochondrial cell death pathways, in part through regulating the antiapoptotic gene Bcl-2.1,2,16,17 When we performed a kinetic analysis of Bcl-2 gene expression in Mar T cells stimulated with the various APCs (Figure 4A), at 48 hours we found 2-fold more Bcl-2 RNA in cells stimulated with Daf1−/− compared with WT APCs, and at both 48 and 72 hours we found 2-fold less Bcl-2 RNA in T cells stimulated with C3−/− or Daf1/C3−/− APCs. To confirm protein expression, we analyzed the cells at 24 hours by flow cytometry after intracellular staining for Bcl-2 protein. This revealed that Bcl-2 protein expression was higher in TCR transgenic CD4+ T cells stimulated with Daf1−/− APCs than WT controls (mean fluorescence intensity (MFI) with Daf1−/− APCs 363, with WT 255, P < .05, data not shown). Addition of C5a up-regulated Bcl-2 in unstimulated splenic T cells and augmented Bcl-2 expression levels after stimulation with anti-CD3/CD28 (Figure 4B). T-cell Bcl-2 up-regulation did not occur in the absence of T-cell C5aR (Figure 4C).
T-cell Bcl-2 and caspase-3 expression are regulated by locally produced C5a binding to T cell–expressed C5aR. (A) Expression of message for Bcl-2 in responding Mar T cells after stimulation with Dby-loaded WT, Daf1−/−, C3−/−, or Daf1/C3−/− APCs (quantitative RT-PCR). Data are representative of 2 individual experiments. Error bars represent SD. (B) Flow cytometric analysis of intracellular Bcl-2 expression in unstimulated (left) or anti-CD3/CD28 stimulated (right) WT T cells plus recombinant C5a (50 ng/mL). Assays were performed at 72 hours. Data are representative replicates of 3 individual experiments. (C) Bcl-2 expression in anti-CD3/CD28-stimulated WT T cells plus or minus C5aR antagonist (C5aR-A, 0.1 μM, 72 hours) or vehicle control (left) and in anti-CD3/CD28–stimulated C5aR−/− T cells (right, 48 hours). Data are representative replicates of at least 2 or 3 individual experiments per group. Numbers in each panel depict the mean fluorescence intensity. *P < .05. (D) Caspase-3 expression in anti-CD3/CD28–stimulated WT or C5aR−/− T cells (120 hours). Analogous results were detected at 72 hours (2.1% caspase-3+ WT T cells vs 5.1% C5aR−/− T cells, not shown). Data are representative replicates of 3 individual experiments.
T-cell Bcl-2 and caspase-3 expression are regulated by locally produced C5a binding to T cell–expressed C5aR. (A) Expression of message for Bcl-2 in responding Mar T cells after stimulation with Dby-loaded WT, Daf1−/−, C3−/−, or Daf1/C3−/− APCs (quantitative RT-PCR). Data are representative of 2 individual experiments. Error bars represent SD. (B) Flow cytometric analysis of intracellular Bcl-2 expression in unstimulated (left) or anti-CD3/CD28 stimulated (right) WT T cells plus recombinant C5a (50 ng/mL). Assays were performed at 72 hours. Data are representative replicates of 3 individual experiments. (C) Bcl-2 expression in anti-CD3/CD28-stimulated WT T cells plus or minus C5aR antagonist (C5aR-A, 0.1 μM, 72 hours) or vehicle control (left) and in anti-CD3/CD28–stimulated C5aR−/− T cells (right, 48 hours). Data are representative replicates of at least 2 or 3 individual experiments per group. Numbers in each panel depict the mean fluorescence intensity. *P < .05. (D) Caspase-3 expression in anti-CD3/CD28–stimulated WT or C5aR−/− T cells (120 hours). Analogous results were detected at 72 hours (2.1% caspase-3+ WT T cells vs 5.1% C5aR−/− T cells, not shown). Data are representative replicates of 3 individual experiments.
As Bcl-2 expression prevents activation of caspase-3, one of the key execution molecules that mediate apoptotic cell death,18 we next assessed the impact of C5aR on T-cell expression of activated caspase-3 by intracellular staining and flow cytometry. As shown in Figure 4D, caspase-3 expression was significantly higher in anti-CD3/CD28 stimulated C5aR−/− T cells compared with WT T cells.
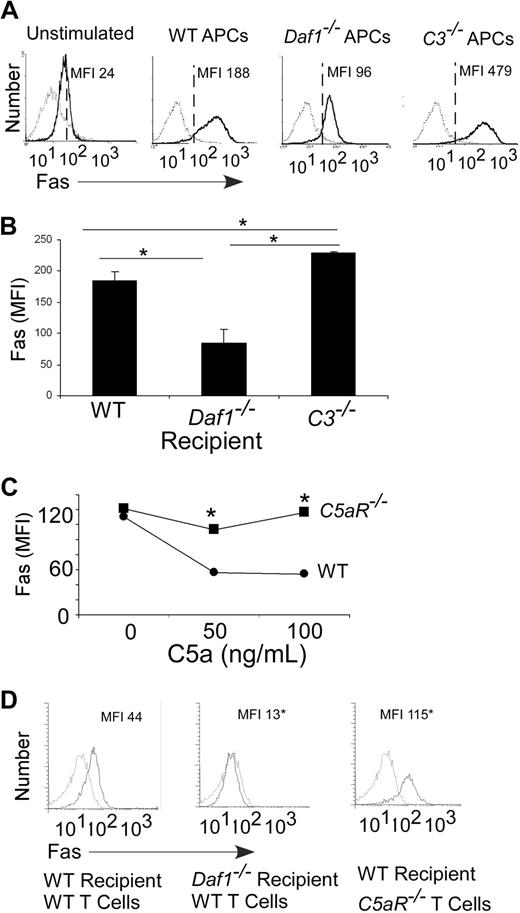
Because apoptosis of effector T cells can also occur via Fas/FasL interactions,3 we examined the effects of local complement synthesis and DAF expression on expression of these molecules. In comparison to WTs, we observed higher levels of Fas on Mar T cells stimulated with C3−/− macrophages and lower levels on Mar T cells stimulated with Daf1−/− macrophages (Figure 5A). We detected similar changes in Fas expression on in vitro–stimulated alloreactive T cells (Figure S3A) and on Mar T cells injected into congenic male mice (Figure 5B). We observed FasL on the surface of a small percentage (∼4%) of the responding T cells stimulated with WT, Daf1−/−, or C3−/− APCs (no difference among groups, Figure S3B). We did not detect FasL on any of the APCs (not shown).
Local complement activation regulates T-cell Fas expression after antigen stimulation. (A) Flow cytometric plots of Fas expression on CFSE-labeled Mar T cells stimulated in vitro (3 days) with WT, Daf1−/−, or C3−/− macrophages plus HYDby peptide (MFI, isotype control-, anti-Fas-). Results are means of triplicate wells. Data are representative of 4 individual experiments. (B) Fas expression on Mar T cells in spleens (gated on Mar TCR Vβ6+ cells) of recipient male WT, Daf1−/−, or C3−/− mice 3 days after adoptive transfer (10 × 106 cells/mouse). Results are depicted as means plus or minus SD of n = 3 or 4 per group. (C) Mean fluorescent intensities of anti-CD3/CD28–stimulated WT or C5aR−/− T-cell surface Fas levels on addition of recombinant C5a after 72 hours. *P < .05 versus WT. Fas levels (MFI) on unstimulated WT was 25 and on C5aR−/− T cells was 28 (not shown). (D) Flow plots of polyclonal H-2b WT or C5aR−/− CD4 T cells after injection into B6xBalb/c F1 WT or Daf1−/− recipients (day 3) depicting surface Fas MFI. The experiment was repeated twice with similar results. *P < .05 versus WT.
Local complement activation regulates T-cell Fas expression after antigen stimulation. (A) Flow cytometric plots of Fas expression on CFSE-labeled Mar T cells stimulated in vitro (3 days) with WT, Daf1−/−, or C3−/− macrophages plus HYDby peptide (MFI, isotype control-, anti-Fas-). Results are means of triplicate wells. Data are representative of 4 individual experiments. (B) Fas expression on Mar T cells in spleens (gated on Mar TCR Vβ6+ cells) of recipient male WT, Daf1−/−, or C3−/− mice 3 days after adoptive transfer (10 × 106 cells/mouse). Results are depicted as means plus or minus SD of n = 3 or 4 per group. (C) Mean fluorescent intensities of anti-CD3/CD28–stimulated WT or C5aR−/− T-cell surface Fas levels on addition of recombinant C5a after 72 hours. *P < .05 versus WT. Fas levels (MFI) on unstimulated WT was 25 and on C5aR−/− T cells was 28 (not shown). (D) Flow plots of polyclonal H-2b WT or C5aR−/− CD4 T cells after injection into B6xBalb/c F1 WT or Daf1−/− recipients (day 3) depicting surface Fas MFI. The experiment was repeated twice with similar results. *P < .05 versus WT.
Analogous to the effects of C5a on up-regulation of T-cell Bcl-2 (Figure 4), when we added C5a to anti-CD3/CD28–stimulated WT T cells, it down-regulated T-cell Fas surface expression (Figure 5C). C5a had no effect on Fas expressed by anti-CD3/CD28–stimulated C5aR−/− T cells (Figure 5C), confirming that the effect was C5aR dependent. Addition of recombinant C5a similarly diminished Fas expression on Mar T cells stimulated with Dby-loaded WT APCs (Fas MFI: C5a 0 ng/mL, 155; C5a 50 ng/mL, 82; C5a 100 ng/mL, 47; data not shown).
To test the relationship between local APC/T-cell complement synthesis and T-cell expression of Fas in vivo, we injected H-2b CD4+C5aR−/− T cells or H-2b CD4+ WT cells into allogeneic hosts and measured Fas expression on the responding T cells. We found that Fas expression was markedly higher on the proliferating C5aR−/− T cells than on the WT T cells (Figure 5D).
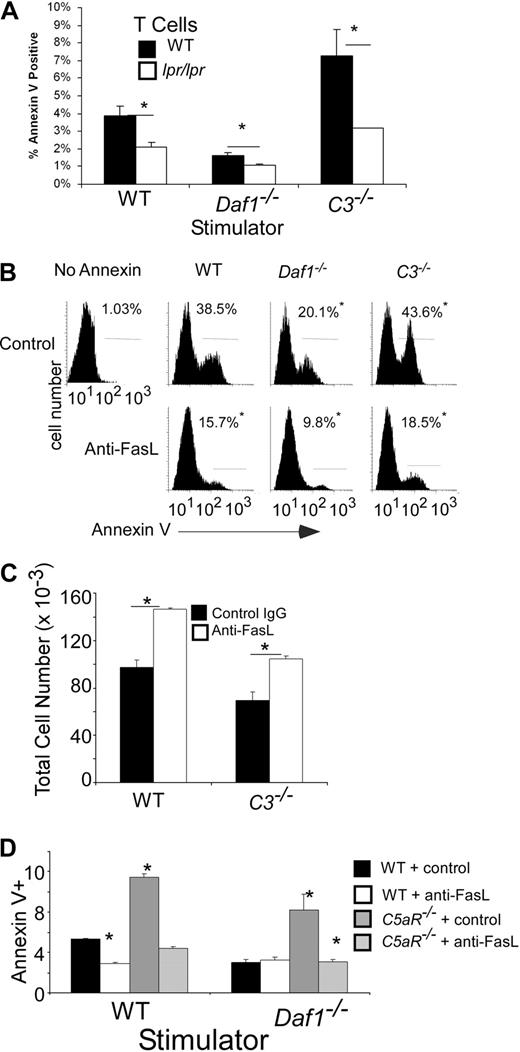
To test the functional significance of the local complement synthesis on T-cell Fas expression, we stimulated naive (> 90% CD62Lhi, CD44lo) polyclonal CD4+ B6 lpr/lpr T cells, which express nonfunctional Fas, with allogeneic H-2d WT, Daf1−/−, or C3−/− APCs (Figure 6A). These studies showed that after stimulation the absence of functional Fas on T cells diminished annexin V. The reduction was greatest in cultures containing C3−/− APCs. B6 lpr/lpr T cells did not respond to syngeneic APCs (not shown), confirming that the effects were alloantigen-induced. Blocking Fas/FasL interactions with an anti-FasL mAb diminished apoptosis of Mar cells (Figure 6B), resulting in higher numbers of surviving cells (Figure 6C). The blockade limited apoptosis of C5aR−/− T cells (Figure 6D), confirming the link between C5a, T-cell C5aR, and Fas-induced T-cell death.
Local complement activation regulates Fas-mediated T-cell apoptosis. (A) Polyclonal naive (> 90% CD62Lhi, CD44lo, not shown) CD4+ H-2b WT or B6.MRLlpr T cells were stimulated in vitro with allogeneic H-2d WT, Daf1−/−, or C3−/− macrophages and stained for annexin V on day 4. Results are means plus or minus SD of triplicate wells. The experiment was repeated with identical results. *P < .05. Data are representative of 3 individual experiments. (B) Representative flow plots of annexin V+ Mar T cells after stimulation for 3 days with WT, Daf1−/−, or C3−/− macrophages and HYDby peptide plus 10 μg/mL anti-FasL antibody or control. The percentage of cells within the gated region is listed in each panel. *P < .05 versus controls. (C) Total live (annexin V−) Mar T cells after 3 days in culture with WT or C3−/− macrophages and HYDby peptide plus 10 μg/mL anti-FasL antibody or control. Results are means plus or minus SD of 2 experiments. *P < .05 versus control antibody. (D) Percentage annexin V+ polyclonal H-2b WT or C5aR−/− CD4 T cells after 4 days stimulation with allogeneic WT or Daf1−/− H-2d macrophages in the presence or absence of 10 μg/mL of anti-FasL antibody. Data are representative of 2 individual experiments. *P < .05 versus WT controls.
Local complement activation regulates Fas-mediated T-cell apoptosis. (A) Polyclonal naive (> 90% CD62Lhi, CD44lo, not shown) CD4+ H-2b WT or B6.MRLlpr T cells were stimulated in vitro with allogeneic H-2d WT, Daf1−/−, or C3−/− macrophages and stained for annexin V on day 4. Results are means plus or minus SD of triplicate wells. The experiment was repeated with identical results. *P < .05. Data are representative of 3 individual experiments. (B) Representative flow plots of annexin V+ Mar T cells after stimulation for 3 days with WT, Daf1−/−, or C3−/− macrophages and HYDby peptide plus 10 μg/mL anti-FasL antibody or control. The percentage of cells within the gated region is listed in each panel. *P < .05 versus controls. (C) Total live (annexin V−) Mar T cells after 3 days in culture with WT or C3−/− macrophages and HYDby peptide plus 10 μg/mL anti-FasL antibody or control. Results are means plus or minus SD of 2 experiments. *P < .05 versus control antibody. (D) Percentage annexin V+ polyclonal H-2b WT or C5aR−/− CD4 T cells after 4 days stimulation with allogeneic WT or Daf1−/− H-2d macrophages in the presence or absence of 10 μg/mL of anti-FasL antibody. Data are representative of 2 individual experiments. *P < .05 versus WT controls.
Molecular signals linking C5aR and Fas/Bcl-2 include PI-3Kγ
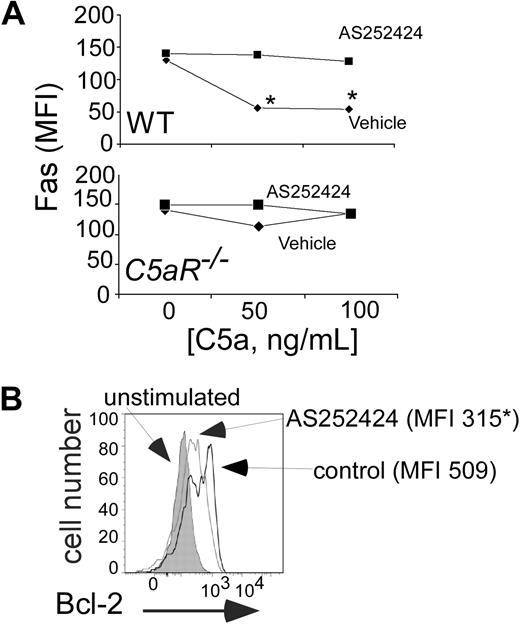
In previous work,7 we demonstrated that naive T-cell activation requires C5a/C3a binding to T cell–expressed C5aR and C3aR and that this G-protein–coupled receptor signal transduction activates phosphatidyl inositol-3 kinase p101γp110γ (PI-3Kγ). As a further test of whether C5a/C5aR interactions on T cells mediate effector T-cell apoptosis, we determined whether antigen-induced, C5a/C5aR-mediated effects on T-cell Bcl-2 and Fas expression, as well as on apoptosis, were PI-3Kγ–dependent. Pharmacologic inhibition of PI-3Kγ prevented the previously observed effects of recombinant C5a, augmenting activation-induced up-regulation of T-cell annexin V and Fas expression and impairing T-cell expansion (Figures 7A, S4). PI-3Kγ blockade also abrogated anti-CD3/CD28 induced up-regulation of T-cell Bcl-2 (Figure 7B).
Complement-regulated Fas and Bcl-2 involves PI-3Kγ. (A) Mean fluorescent intensities for T-cell surface Fas expression on WT (top) or C5aR−/− (bottom) B6 T cells stimulated with anti-CD3/CD28 plus or minus recombinant C5a plus or minus 0.1 μM AS25242 (72 hours). *P < .05 versus control. The experiment was repeated with identical results. (B) Flow cytometry plot demonstrating Bcl-2 expression in anti-CD3/CD28-stimulated B6 T cells (gated on CD4+ cells) plus or minus 0.1 μM AS252424. Numbers in each panel depict the mean fluorescence intensity. Bcl-2 MFI in unstimulated cells was 130. Assay was performed at 72 hours. Data are representative of at least 2 independent experiments. P < .05.
Complement-regulated Fas and Bcl-2 involves PI-3Kγ. (A) Mean fluorescent intensities for T-cell surface Fas expression on WT (top) or C5aR−/− (bottom) B6 T cells stimulated with anti-CD3/CD28 plus or minus recombinant C5a plus or minus 0.1 μM AS25242 (72 hours). *P < .05 versus control. The experiment was repeated with identical results. (B) Flow cytometry plot demonstrating Bcl-2 expression in anti-CD3/CD28-stimulated B6 T cells (gated on CD4+ cells) plus or minus 0.1 μM AS252424. Numbers in each panel depict the mean fluorescence intensity. Bcl-2 MFI in unstimulated cells was 130. Assay was performed at 72 hours. Data are representative of at least 2 independent experiments. P < .05.
Discussion
We have previously shown that T cells and APCs produce and activate complement during cognate interactions and that the complement activation products are essential intermediaries for optimal activation of naive T cells.6,7 The results in this study build on our previous work. Through the use of bone marrow chimera experiments (Figure 1), we formally demonstrated that in vivo T-cell expansion is controlled by a complement-dependent mechanism that is intrinsic to immune cells and is unaffected by serum complement. We further showed that the local complement-dependent expansion of the effector repertoire is the result of C5a/C5aR-induced suppression of effector T-cell apoptosis (Figures 2,3) and that, as previously documented for viability of naive T cells, these antiapoptotic effects are mediated through PI-3Kγ–dependent alterations in Bcl-2 and Fas expression (Figures 4,Figure 5,Figure 6–7).
Apoptosis after T-cell activation controls the size of the effector T-cell response.1,9,10 Our findings show that binding of locally produced C5a to T cell–expressed C5aR after T-cell activation is necessary to prevent apoptosis during T-cell expansion. Together with our previously documented effects of local complement on activation of naive T cells and APCs,7 the combined work accounts for diminished T-cell responses to auto- and viral antigens in C3−/−19-24 and factor D−/− mice.5,7 Because the number of induced effector T cells also influences the strength of subsequent T-cell memory,25,26 our findings explain the observed augmented memory T-cell responses in DAF-deficient animals,14 which were shown to be C5aR-dependent.14
The biochemistry underlying T-cell apoptosis is complex and involves extrinsic and intrinsic pathways (reviewed by Krammer et al18 ). Current models suggest that Fas/FasL (CD95/CD95L) interactions (extrinsic pathway) lead to formation of the death-inducing signaling complex in which caspase-8 and -10 are activated. These molecules cleave the effector pro-caspases (including pro-caspase-3) and BH3-interacting domain death agonist to their activated forms (capase-3 and truncated BH3-interacting domain death agonist, respectively). The former “executioners” cleave essential downstream substrates that directly trigger apoptosis, whereas the latter, through permitting aggregation of Bax and Bak, cause release of cytochrome C from mitochondria. Downstream effects of released cytochrome C include activation of caspase-9, which in turn amplifies activation of the effector caspases. This pathway can be blocked by FLIP (caspase-8–like inhibitory protein), which works at the death-inducing signaling complex by inhibiting cell death receptor signaling. It can also be inhibited by Bcl-2 and Bcl-xL, which by sequestering Bax and Bak to the outer surface of the mitochondrion, indirectly inhibit mitochondrial cytochrome C release. In the intrinsic pathway, signals transmitted via the TCR (among other stimuli) are thought to activate Bcl-2–interacting mediator (BIM), which displaces Bcl-2, leading to mitochondrial cytochrome C release and subsequent execution of cell death via caspase activation.
Our data demonstrate that locally produced C5a/C5aR interactions on T cells need to be considered as unanticipated components/regulators of these biochemical pathways. We showed that, in the absence of C5aR-transmitted signals, augmented T-cell apoptosis is accompanied by up-regulated Fas expression, diminished intracellular Bcl-2, and augmented caspase-3 activation (Figures 4,Figure 5–6). Whether locally produced complement influences other apoptotic regulators (eg, Bcl-xL, FLIP) and/or proapoptotic molecules (eg, Bax, Bak, BIM, Bad, and other caspases) will require further investigation, as will deciphering the molecular signals that link complement to these molecules.
Whereas the biochemistry of effector cell apoptosis has been increasingly characterized, the specific signals that determine the kinetic expression of Bcl-2 and Fas/FasL have not.25 Evidence suggests that effector T-cell survival is a random event influenced by sensitivity to limiting amounts of IL-7 (potentially via altering receptor expression levels).26 However, IL-7Rαlo T cells survive in vivo27 and IL-7 neutralization does not exacerbate effector T-cell contraction,28 suggesting alternative mechanisms. Our previous studies, combined with the data in this paper, that PI-3Kγ activation resulting from C5a binding to the T cell–expressed C5aR7 augments Bcl-2 expression and prevents caspase-3 and Fas up-regulation, document that, analogous to recently described antiapoptotic effects of C5a on neutrophils,29 local complement activation is an important regulator of effector T-cell apoptosis.
In addition to the remarkable effects of T cell–expressed C5aR signaling on T-cell proliferation and survival, our joint work has previously shown that anaphylatoxin binding to APC-expressed receptors results in APC activation.6,7 Locally produced anaphylatoxins directly regulate production of cytokines, eg, IL-12, as well as costimulatory molecule expression (including CD80, CD86, and CD40) through binding to APC-expressed C5aR/C3aR.6,7 Whether locally produced complement also functions as a prosurvival signal for APCs in vivo deserves further study.
We have not yet fully delineated the intracellular signaling pathways linking PI-3Kγ to Bcl-2 and Fas, but our recent publication revealed that C5a/PI-3Kγ regulates AKT phosphorylation.7 Phosphorylated AKT is a central intermediary involved in T-cell activation and cell survival. Studies exploiting a constitutively active AKT transgenic, for example, showed that AKT prevents T-cell apoptosis, resulting in augmented in vivo immunity, in part via controlling intrinsic cell death pathways, further supporting the physiologic importance of our results.30
Collectively, our work delineates a novel and central role for complement in the expansion and maintenance of effector T-cell immunity. In addition to providing insight into mechanisms regulating survival of effector T-cell repertoires, our findings demonstrate that targeting C5a/C5aR could be exploited therapeutically to augment weak T-cell immune responses to viral or tumor antigens or prevent pathogenic autoimmunity or alloimmunity.
An Inside Blood analysis of this article appears at the front of this issue.
The online version of this article contains a data supplement.
The publication costs of this article were defrayed in part by page charge payment. Therefore, and solely to indicate this fact, this article is hereby marked “advertisement” in accordance with 18 USC section 1734.
Acknowledgments
This work was supported by the National Institutes of Health, Bethesda, MD, (grants AI43578 and AI071185, P.S.H.; and grants AI23598 and EY11288, M.E.M.) and a grant from the Roche Organ Transplant Research Foundation, Meggen, Switzerland (P.S.H.). P.N.L. received a fellowship grant from the Ohio Affiliate of the American Heart Association (Columbus, Ohio).
National Institutes of Health
Authorship
Contribution: P.N.L. performed experiments, analyzed the data, and contributed to writing and editing of the manuscript; M.G.S., M.Y., and F.L. performed research and analyzed data; M.E.M. designed studies and edited the manuscript; and P.S.H. designed the studies, analyzed data, and wrote the manuscript.
Conflict-of-interest disclosure: The authors declare no competing financial interests.
Correspondence: Peter S. Heeger, Mount Sinai School of Medicine, Department of Medicine, Division of Nephrology, Annenberg 23 66B Box 1243, One Gustave Levy Place, New York, NY 10029; e-mail: peter.heeger@mssm.edu.

