Abstract
Previous observations suggested that functional antagonism between FLI-1 and EKLF might be involved in the commitment toward erythrocytic or megakaryocytic differentiation. We show here, using inducible shRNA expression, that EKLF knockdown in mouse erythroleukemia (MEL) cells decreases erythrocytic and increases megakaryocytic as well as Fli-1 gene expression. Chromatin immunoprecipitation analyses revealed that the increase in megakaryocytic gene expression is associated with a marked increase in RNA pol II and FLI-1 occupancy at their promoters, albeit FLI-1 protein levels are only minimally affected. Similarly, we show that human CD34+ progenitors infected with shRNA lentivirus allowing EKLF knockdown generate an increased number of differentiated megakaryocytic cells associated with increased levels of megakaryocytic and Fli-1 gene transcripts. Single-cell progeny analysis of a cell population enriched in bipotent progenitors revealed that EKLF knockdown increases the number of megakaryocytic at the expense of erythrocytic colonies. Taken together, these data indicate that EKLF restricts megakaryocytic differentiation to the benefit of erythrocytic differentiation and suggest that this might be at least partially mediated by the inhibition of FLI-1 recruitment to megakaryocytic and Fli-1 gene promoters.
Introduction
Erythrocytic and megakaryocytic lineages derive from a common bipotent progenitor (megakaryocyte/erythroid progenitor, MEP) able to generate only erythrocytic or megakaryocytic progenitors.1,2 A common bipotent precursor, precursor for erythroid and megakaryocytic cells (PEM), has also been characterized in the spleen of anemic mice.3,4 Despite this very close proximity, the molecular mechanisms controlling commitment toward either one of these 2 lineages remain poorly understood.
Two main models have been proposed to explain the commitment of multipotent hematopoietic progenitors.5,6 According to the “instructive model,” lineage commitment is dictated by specific extracellular signals such as cytokines. Although erythropoietin and thrombopoietin enhance the proliferation, survival, and differentiation of already committed erythrocytic and megakaryocytic progenitors expressing erythropoietin- or thrombopoietin-specific receptors, it is now well established that they have no instructive role in the commitment.7,8
Available data are more compatible with a “stochastic model,” suggesting that commitment is dictated by the spontaneous formation of specific and mutually exclusive combinations of transcription factors.5,6 At least 10 different transcription factors involved in erythrocytic and/or megakaryocytic differentiation have been identified.9-12 Most of them, such as GATA-1, NF-E2, TAL-1, LMO2, FOG1, and GFI-1B, are involved in the regulation of both erythrocytic and megakaryocytic differentiation. However, there is no indication that differential expression of either one of these 6 factors might be involved in the commitment decision. Several transgenic mice carrying different knockdown mutations of c-myb gene display reduced levels of erythrocytic and increased levels of megakaryocytic differentiation,13,14 but the C-MYB target genes responsible for this differential effect remain largely unknown.15 Three other transcription factors, RUNX1, FLI-1, and EKLF, display clear differential expression, RUNX1 and FLI-1 being specifically expressed in megakaryocytic cells16 and EKLF in erythrocytic cells.17 Conditional inactivation of runx1 in adult mice inhibits megakaryocytic differentiation but does not increase erythrocytic differentiation.17-19 In contrast to RUNX1, several data points argue for a role of FLI-1 and EKLF in the commitment decision between erythrocytic versus megakaryocytic differentiation.20 Many megakaryocytic gene promoters are characterized by conserved functional GATA and ETS binding sites9 and most of them are directly activated by FLI-1.21-23 For example, FLI-1 and GATA-1 interact together and cooperate with FOG1 to activate the GpIX gene through their cooperative binding to its promoter.22,24 In agreement with these data, homozygous Fli-1 gene deletion leads to megakaryopoiesis defects in mice embryos,21,25,26 whereas hemizygous loss of Fli-1 is responsible for dysmegakaryopoiesis in the human Paris-Trousseau syndrome.27,28 Contrasting with this role of FLI-1 in the positive control of megakaryopoiesis, enforced expression of FLI-1 blocks the erythrocytic differentiation of normal avian progenitors as well as several human or murine erythroleukemic cells.29-32 Furthermore, a recent study showed that embryonic stem (ES) cell contribution to erythroid progenitors of chimeric mice is greatly enhanced when using Fli-1+/− instead of Fli-1+/+ cells.33
Reciprocally, several erythrocytic gene regulatory regions are characterized by tandem GATA-1 and EKLF binding sites. Knockout experiments have shown that EKLF is involved in the activation of many erythrocytic genes, although erythrocytic progenitors can be produced in the absence of EKLF.17,34-40 Contrasting with this positive role of EKLF in erythropoiesis, transgenic mice overexpressing EKLF under the control of LCR and β-globin gene promoter display an unexplained reduction of platelet number.41 Furthermore, transcriptome analyses of Eklf−/− mouse fetal livers revealed increased levels of several megakaryocytic gene transcripts.17 In that context, we recently demonstrated functional antagonism between FLI-1 and EKLF in transient expression assays.20,39 All these data led us to suggest that functional antagonism between FLI-1 and EKLF might be involved in the commitment toward erythrocytic or megakaryocytic differentiation, but this hypothesis still remained to be demonstrated.
The present study combined inducible and constitutive shRNA expression to knockdown EKLF in mouse erythroleukemia (MEL) cells and in normal human progenitors. Concordant results of these experiments demonstrate that EKLF actually restricts megakaryocytic at the benefit of erythrocytic gene transcription and differentiation and suggest that this negative effect of EKLF on megakaryocytic commitment is mediated at least partially through the inhibition of FLI-1 recruitment to megakaryocytic as well as to Fli-1 gene promoters.
Methods
Cell lines culture and transfection
All cell lines (MEL 745-A, K562) were grown in Iscove modified Dulbecco medium (Invitrogen, Cergy Pontoise, France) supplemented with 10% fetal calf serum (Biowest, Nuaillé, France) and penicillin-streptomycin. Clone 745/TR has been derived from 745-A cells after transfection with plasmid pEF1α-TetR expressing the bacterial repressor TetR and blasticidin resistance.42,43 Clones 4D7 and 2M12 were derived from 745/TR cells after transfection with pGJ10/shEKLF-1 or pGJ10/shEKLF-2 plasmids encoding 2 different shRNAs directed against Eklf mRNA under the control of a doxycycline-inducible H1 promoter42,44 and G418 resistance. Clone 745/TR was maintained under constant selection with blasticidin (20 μg/mL), whereas clones 4D7 and 2M12 were maintained in blasticidin (20 μg/mL; Cayla, Toulouse, France) and G418 (1 mg/mL; Invitrogen). Differentiation of 4D7 and 2M12 cells was induced by adding 5 mM HMBA (hexamethylenebisacetamide; Sigma, St Quentin Fallavier, France) and induction of shRNA production by adding 2 μg/mL doxycycline (Clontech, Saint-Germain-en-Laye, France). Transfection of K562 cells was performed by electroporation using Nucleofector kit V and program T-16 of the Amaxa Electroporator (Nucleofector; Amaxa, Cologne, Germany). Transfection of MEL cells was performed using DAC30 (Eurogentec, Herstal, Belgium) according to the manufacturer's instructions.
CD34+ purification and culture
Leukocytes were obtained from cord blood by ficoll gradient concentration. CD34+ cells were then selected using a magnetic cell sorting system (miniMACS; Miltenyi Biotec, Bergisch Gladbach, Germany) according to the manufacturer's recommendations. The purity of recovered cells was checked by fluorescence-activated cell sorting (FACS) analysis and always found superior to 80%. In most experiments, purified CD34+ cells were cultured in E/MK medium, consisting of serum-free medium45 supplemented with recombinant human thrombopoietin (r-huTPO, 10 ng/mL), stem cell factor (r-huSCF, 25 ng/mL), and erythropoietin (r-huEPO, 1 U/mL). Recombinant cytokines were obtained from Amgen (Thousand Oaks, CA) except for r-huTPO, which was a gift from Kirin Brewery (Tokyo, Japan).
Plasmid constructs
pSG5, pSG5 HA-EKLF,20 pEF, pEF FLI-1,20 pEF1α-TetR,42 pGJ10,43 pH1, and pRRL46 have been already described. p668 (kindly provided by Dr J. Bieker, Mount Sinai School of Medicine, New York, NY) has been generated by subcloning murine EKLF cDNA upstream of the IRES-GFP sequence of the MSCV-based MiG retrovirus.47 pSG5 HA-EKLF/M-Zn1-3 has been generated by subcloning the mutated EKLF region of pSG5 EKLF/M-Zn1-348 into pSG5 HA-EKLF. pGJ10/shEKLF-1 and pGJ10/shEKLF-2 were obtained by cloning double-stranded oligonucleotides encoding shRNA directed against 2 different target sites of the murine Eklf gene into BglII and NotI sites of pGJ10. Similarly, double-stranded oligonucleotides encoding scramble shRNA or shRNA directed against human Eklf mRNA were first cloned downstream to the H1 promoter of pH1 vector. The pH1 promoter and shRNA cassettes were then isolated by XhoI digestion and cloned into the single XhoI site of pRRL, leading to SCR shRNA and Eklf shRNA pRRL lentiviral vectors. Sequences of oligonucleotides used for these constructs are given in Table S1 (available on the Blood website; see the Supplemental Materials link at the top of the online article). Sequences of all shRNA coding regions were verified by direct sequencing of final DNA constructs.
Lentivirus production and cell infection
Lentivirus supernatants were prepared by cotransfection of 293-T cells with pRRL plasmids (pRRL SCR shRNA or pRRL Eklf shRNA), the packaging plasmid pCMV R874, and the VSV-G protein envelope plasmid pMDG as previously described.46 CD34+ cells (1 to 3 × 10⁵ cells/mL) were cultured up to 3 days in serum-free medium supplemented with TPO, EPO, and SCF (E/MK medium). On the third day, cells were centrifuged, resuspended (3 × 10⁶ cells/mL) in fresh cytokine-supplemented medium containing 2 μg/mL hexadimethrine bromide (Sigma), and exposed to lentiviral supernatants for 3 hours at 37°C. Immediately after infection, cells were washed in phosphate-buffered saline (PBS) and reseeded in E/MK medium, either directly or after sorting single CD36+CD31Med cells by FACS (Figure S1). To favor erythroid differentiation in the experiments presented in Figure 5, CD34+ cells were cultured in the same medium but with IL3 (r-huIL3, 100 U/mL) instead of TPO and supplemented with 20% fetal calf serum for 3 days, infected for 1 day, and reseeded for 2 days in the same medium and then for 1 day in medium supplemented with 30% fetal calf serum before the sorting of infected erythrocytic differentiated cells (GFP+CD36+, GPA+, CD41−).
Transcript analyses
Total cell RNA was prepared by RNA plus (Q-biogene, Illkirch, France). Total RNA (1 μg) was reverse transcribed using 200 U Moloney reverse transcriptase (Invitrogen) and random oligonucleotide hexamers in a final volume of 20 μL for 1 hour at 37°C. Reverse transcription reaction (1 μL) was then amplified by quantitative polymerase chain reaction (qPCR) using SYBR Green PCR kits (Qiagen, Courtaboeuf, France or Roche, Neuilly sur Seine, France) and a Lightcycler (Roche). Primers sequences used for qPCR are given in Table S1.
Western blot analyses
Western blot analyses were performed on total cell lysates as previously described20 using the following antibodies: anti-EKLF (Santa Cruz Biotechnology, Santa Cruz, CA; Figure 4), anti-EKLF monoclonal (clone 6B3,48 Figure 2), anti–GRB-2 (Santa Cruz Biotechnology), anti–FLI-1 (Santa Cruz Biotechnology or Abcam, Cambridge, United Kingdom), anti–GATA-1 (Santa Cruz Biotechnology), and anti-HSC70 (Stressgene, Victoria, BC).
Chromatin immunoprecipitation
Chromatin immunoprecipitation (ChIP) assays were performed following Upstate's protocol (Lake Placid, NY) with minor modifications. Briefly, 108 cells were fixed for 10 minutes at room temperature by adding 1/10th volume 10× fixation solution (PBS 1×, 11% formaldehyde, 0.1 M NaCl, 50 mM HEPES, pH 7.9) directly to the culture medium. Fixation was stopped by adding 0.125 M glycine followed by 2 washes in cold PBS. Chromatin was prepared by incubating fixed cells (5 × 10⁷ cells/mL) for 10 minutes on ice in lysis buffer (50 mM Tris, pH 8.1, 10 mM EDTA, 1% SDS, containing 1/25th volume of EDTA-free protease inhibitors cocktail [Roche]). Chromatin fragmentation was performed on ice by 5 to 10 pulses of sonication (Bioblock Vibra Cell 72405 sonicator, Illkirch, France). Aliquots of chromatin were taken at this step to control the mean length of fragmented DNA by agarose gel electrophoresis (less than 500 bp) and to quantify the DNA concentration by quantitative PCR. Sonicated chromatin preparations (corresponding to 2 × 10⁷ cells) were first diluted in 10 volumes ChIP IP buffer (16.7 mM Tris, pH 8, 1.2 mM EDTA, 167 mM NaCl, 1.1% Triton X100, 0.01% SDS containing 1/20th volume protease inhibitors cocktail [Roche]) and precleared by adding 100 μL protein G sepharose beads (Amersham, Arlington Heights, IL) for 4 hours at 4°C on a rolling wheel. Preclearing beads were eliminated by centrifugation and immunoprecipitations were performed overnight at 4°C on a rolling wheel by adding 2 μg antibody (anti–FLI-1, anti–GATA-1, anti–RNA-polymerase II [all from Santa Cruz Biotechnology], anti–acetylated Histone H3 [Upstate]). Protein G sepharose beads were added (10 μL for each milliliter of immunoprecipitation starting volume) and the samples incubated for 3 hours at 4°C. Beads were washed 5 times (5 minutes each at 4°C) in 1 mL of the following buffers: once in W1 (20 mM Tris, pH 8, 2 mM EDTA, 150 mM NaCl, 0.1% SDS, 1% Triton X100), once in W2 (20 mM Tris, pH 8, 2 mM EDTA, 500 mM NaCl, 0.1% SDS, 1% Triton X100), once in W3 (10 mM Tris, pH 8, 1 mM EDTA, 1% NP40, 1% sodium deoxycholate, 0.25 M LiCl), and twice in W4 (10 mM Tris, pH 8, 1 mM EDTA). Chromatins were eluted in a final volume of 500 μL by 2 successive incubations of the beads (15 minutes at room temperature) in 250 μL elution buffer (0.1 M NaHCO3, 1% SDS) and treated with proteinase K. Cross-link was reversed by overnight incubation at 65°C, and DNA was finally prepared by classical phenol/chloroform extraction and ethanol precipitation. Immunoprecipitated and input DNA (prepared from aliquots taken before the immunoprecipitation step) were quantified by real-time PCR using SYBR green PCR kits. Primer sequences used for qPCR are given in Table S1.
FACS analysis and sorting
Phycoerythrin (PE)–conjugated anti-CD31, anti-CD42, and anti-GPA; allophycocyanin (APC)–conjugated anti-CD41 and anti-CD36; and PE- and APC-conjugated IgG1 and IgG2a control monoclonal antibodies were from BD Biosciences (Le Pont de Claix, France). Cells were suspended in PBS, stained for 30 minutes at 4°C in accordance with manufacturer's recommendations, and either analyzed on a FACsort with the Cell Quest software package or sorted on a FacsDIVA flow cytometer equipped with an automatic cell deposition unit (BD Biosciences).
Results
Endogenous EKLF represses megakaryocytic gene expression during erythroid differentiation of MEL cells
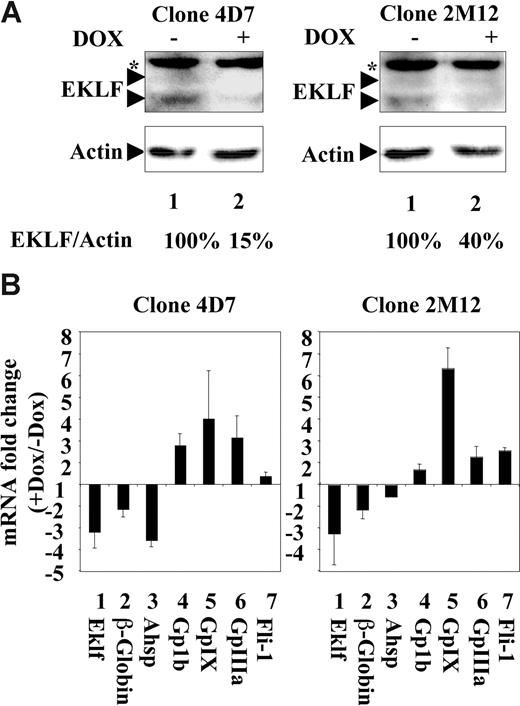
As it could be predicted from our previous studies,20 we found that enforced EKLF expression is indeed able to antagonize FLI-1–induced expression of endogenous GpIIIa and GpIX megakaryocytic genes in K562 cells (Figure S3). This prompted us to investigate whether endogenous EKLF could repress megakaryocytic genes during erythroid differentiation. For that purpose, we decided to knock down EKLF during terminal erythroid differentiation of MEL cells (clone 745-A) using inducible shRNA expression. We thus established several clones of 745-A cells allowing doxycycline-inducible production of shRNA directed against 2 different regions of Eklf mRNA. Clones 4D7 (target 1) and 2M12 (target 2), which displayed the highest reduction of EKLF protein in the presence of doxycycline, were selected for further analyses. In the experiments presented in Figure 1, 4D7 and 2M12 cells were grown for 2 days in the presence of doxycycline to induce EKLF knockdown and then for 2 days (still with or without doxycycline) in the presence of HMBA to induce erythroid differentiation. In both clones, clear reduction of EKLF protein was observed in the presence of doxycycline (Figure 1A lanes 1,2). As expected, β-globin and AHSP (alpha hemoglobin stabilizing protein) mRNA, 2 well-known erythroid direct target genes activated by EKLF,17,39,49 were significantly reduced when differentiation was induced in the presence of doxycycline (Figure 1B lanes 2,3). In marked contrast, doxycycline induced a significant increase in the mRNA levels of the 3 megakaryocytic genes, Gp1b, GpIX, and GpIIIa, as well as Fli-1 genes (Figure 1B lanes 4-7). These results thus established that endogenous EKLF actively contributes to repress megakaryocytic and Fli-1 gene expression during erythroid differentiation of MEL cells.
Endogenous EKLF activates erythrocytic and represses megakaryocytic gene expression in MEL cells. 4D7 and 2M12 are 2 different clones derived from MEL cells that have been engineered to allow inducible expression of 2 different shRNAs directed against Eklf mRNA (“Cell lines culture and transfection”). 4D7 and 2M12 cells were grown for 2 days in the presence of 2 μg/mL doxycycline to induce Eklf shRNA expression and then for 2 days in the presence of 5 mM HMBA (still in the presence of doxycycline) to induce their differentiation. 4D7 and 2M12 cells grown in the same conditions but without doxycycline were used as control. (A) Western blot analysis of EKLF protein in 4D7 (left panels) or 2M12 cells (right panels) treated in the presence (lane 2) or absence (lane 1) of doxycycline. Asterisk indicates unspecific band. Actin protein is shown as loading control. Percentages indicate relative levels of EKLF proteins (EKLF/actin ratios) estimated by densitometry. (B) Doxycycline-induced changes of erythrocytic (lanes 1-3) and megakaryocytic (lanes 4-7) mRNA gene levels in 4D7 cells and 2M12 cells. Relative levels of each mRNA have been determined by quantitative reverse-transcription (RT)–PCR using Hprt mRNA as a normalization reference. Final results are expressed as fold changes induced by doxycycline (means and SD from 4 independent experiments).
Endogenous EKLF activates erythrocytic and represses megakaryocytic gene expression in MEL cells. 4D7 and 2M12 are 2 different clones derived from MEL cells that have been engineered to allow inducible expression of 2 different shRNAs directed against Eklf mRNA (“Cell lines culture and transfection”). 4D7 and 2M12 cells were grown for 2 days in the presence of 2 μg/mL doxycycline to induce Eklf shRNA expression and then for 2 days in the presence of 5 mM HMBA (still in the presence of doxycycline) to induce their differentiation. 4D7 and 2M12 cells grown in the same conditions but without doxycycline were used as control. (A) Western blot analysis of EKLF protein in 4D7 (left panels) or 2M12 cells (right panels) treated in the presence (lane 2) or absence (lane 1) of doxycycline. Asterisk indicates unspecific band. Actin protein is shown as loading control. Percentages indicate relative levels of EKLF proteins (EKLF/actin ratios) estimated by densitometry. (B) Doxycycline-induced changes of erythrocytic (lanes 1-3) and megakaryocytic (lanes 4-7) mRNA gene levels in 4D7 cells and 2M12 cells. Relative levels of each mRNA have been determined by quantitative reverse-transcription (RT)–PCR using Hprt mRNA as a normalization reference. Final results are expressed as fold changes induced by doxycycline (means and SD from 4 independent experiments).
EKLF knockdown stimulates the recruitment of RNA polymerase II and FLI-1 to megakaryocytic and Fli-1 gene promoters
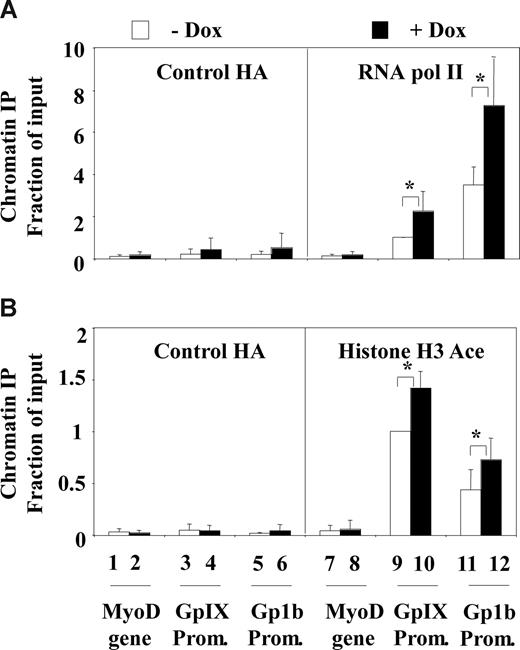
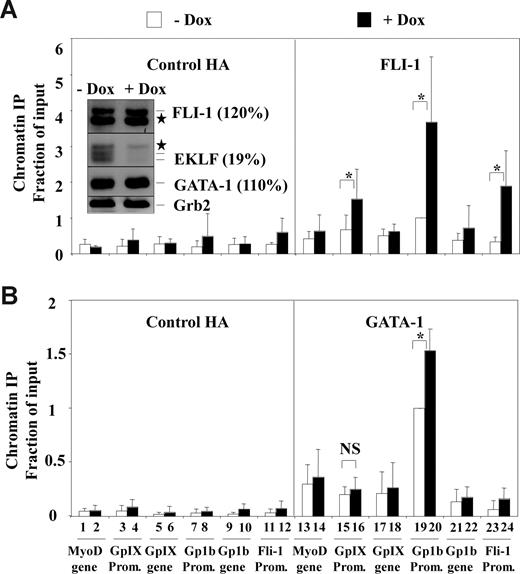
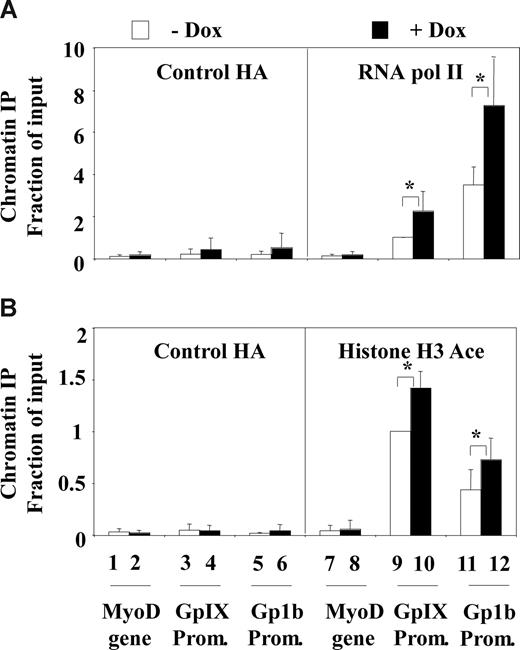
To determine the mechanisms that could explain megakaryocytic gene repression by endogenous EKLF in MEL cells, 4D7 cells were grown for 2 days with or without doxycycline and for further 2 days with HMBA as in Figure 1. Then, we used chromatin immunoprecipitation (ChIP) followed by quantitative PCR to determine RNA polymerase II occupancy at the Gp1b and GpIX gene promoters (Figure 2). ChIP experiments performed concurrently using anti-HA antibody and quantitative PCR of the silent myoD gene were used as negative controls. As expected, no significant RNA pol II occupancy was found at the silent myoD gene sequence (Figure 2A lanes 1,2 and 7,8). In contrast, significant RNA pol II occupancy was found at the GpIX and Gp1b promoters in the absence of doxycycline (Figure 2A, compare lanes 9 and 11 to lane 7). RNA pol II occupancy at the GpIX and Gp1b promoters increased by 2-fold in the presence of doxycycline, thus indicating enhanced transcription. Similarly, compared with myoD, the GpIX and Gp1b promoters already displayed high levels of acetylated histone H3, whereas these levels slightly increased after EKLF knockdown (Figure 2B). According to previous studies, the transcription of GpIX and Gp1b genes is critically dependent on FLI-1 and GATA-1 recruitment to their promoters.23,50 Intriguingly, however, FLI-1 and GATA-1 protein levels were only minimally increased by EKLF knockdown (+ 20% or + 10%, respectively; Figure 3A inset). This prompted us to investigate the effect of EKLF knockdown on FLI-1 and GATA-1 occupancy at the GpIX and Gp1b promoters. As in Figure 2, HA antibody and the myoD gene, which is devoid of GATA-1 and FLI-1 binding sites, were used as negative controls. In the absence of doxycycline, significant occupancy of both FLI-1 and GATA-1 (2- or 3-fold above background; compare lane 19 to lanes 13, 17, and 21 in Figure 3A,B) was already detected at the Gp1b promoter, whereas no significant occupancy was detected at the GpIX promoter (Figure 3A,B, compare lane 15 to lanes 13, 17, and 21). In the presence of doxycycline, both FLI-1 and GATA-1 occupancy increased at the Gp1b promoter (3- and 1.5-fold, respectively; Figure 3A,B, compare lanes 19 and 20), whereas FLI-1 occupancy increased by 2-fold and GATA-1 remained undetectable at the GpIX promoter (Figure 3A,B, compare lanes 15 and 16). These data thus indicate that transcriptional activation of GpIX and Gp1b genes induced by EKLF knockdown is associated with increased recruitment of FLI-1 to their promoters as well as with increased recruitment of GATA-1 to the Gp1b promoter. Interestingly enough, FLI-1 occupancy was also increased at the Fli-1 gene promoter itself (Figure 3A, compare lanes 23 and 24).
EKLF knockdown increases RNA polymerase II occupancy and acetylation of histone H3 at the Gp1b and GpIIIa megakaryocytic gene promoters. 4D7 cells were treated for 2 days with (■) or without doxycycline (□) to knock down EKLF followed by 2 days in presence of HMBA to induce their differentiation as described in Figure 1. Chromatin immunoprecipitation analyses were then performed using either control anti-HA antibody or specific antibodies directed against RNA-polymerase II (A) or acetylated histone H3 (B). Immunoprecipitated DNA was quantified by real-time PCR using specific primers corresponding to the promoters or an internal position of GpIX and Gp1b megakaryocytic genes as well as to the silent myoD gene. Results are expressed as relative proportions of immunoprecipitated DNA (ratios of immunoprecipitated versus input DNA) standardized to the ratio obtained for the GpIX promoter in untreated cells (means and standard deviations from 3 independent cultures). Significant (P < .05; paired Student test) doxycycline effects are indicated by asterisks.
EKLF knockdown increases RNA polymerase II occupancy and acetylation of histone H3 at the Gp1b and GpIIIa megakaryocytic gene promoters. 4D7 cells were treated for 2 days with (■) or without doxycycline (□) to knock down EKLF followed by 2 days in presence of HMBA to induce their differentiation as described in Figure 1. Chromatin immunoprecipitation analyses were then performed using either control anti-HA antibody or specific antibodies directed against RNA-polymerase II (A) or acetylated histone H3 (B). Immunoprecipitated DNA was quantified by real-time PCR using specific primers corresponding to the promoters or an internal position of GpIX and Gp1b megakaryocytic genes as well as to the silent myoD gene. Results are expressed as relative proportions of immunoprecipitated DNA (ratios of immunoprecipitated versus input DNA) standardized to the ratio obtained for the GpIX promoter in untreated cells (means and standard deviations from 3 independent cultures). Significant (P < .05; paired Student test) doxycycline effects are indicated by asterisks.
EKLF knockdown increases FLI-1 occupancy at the Gp1b, GpIX, and Fli-1 megakaryocytic gene promoters. ChIP experiments were performed as described in Figure 2 (the same chromatin samples were used) using either anti–FLI-1 (A) or anti–GATA-1 (B) antibodies. Results are expressed as relative proportions of immunoprecipitated DNA (ratios of immunoprecipitated versus input DNA) standardized to the ratio obtained for the Gp1b promoter in untreated cells (means and standard deviations from 3 independent cultures). Significant (P < .05; paired Student test) doxycycline effects are indicated by asterisks (NS indicates nonsignificant). Insert corresponds to the Western blot analysis of FLI-1, EKLF, GATA-1, and GRB2 present in total protein extracts from the 4D7 cells used for the ChIP experiments (stars correspond to unspecific bands). Percentages in brackets indicate the change of FLI-1, EKLF, and GATA-1 levels induced by doxycycline as estimated by densitometry (relative values standardized to GRB2 and expressed as percentage of values without doxycycline).
EKLF knockdown increases FLI-1 occupancy at the Gp1b, GpIX, and Fli-1 megakaryocytic gene promoters. ChIP experiments were performed as described in Figure 2 (the same chromatin samples were used) using either anti–FLI-1 (A) or anti–GATA-1 (B) antibodies. Results are expressed as relative proportions of immunoprecipitated DNA (ratios of immunoprecipitated versus input DNA) standardized to the ratio obtained for the Gp1b promoter in untreated cells (means and standard deviations from 3 independent cultures). Significant (P < .05; paired Student test) doxycycline effects are indicated by asterisks (NS indicates nonsignificant). Insert corresponds to the Western blot analysis of FLI-1, EKLF, GATA-1, and GRB2 present in total protein extracts from the 4D7 cells used for the ChIP experiments (stars correspond to unspecific bands). Percentages in brackets indicate the change of FLI-1, EKLF, and GATA-1 levels induced by doxycycline as estimated by densitometry (relative values standardized to GRB2 and expressed as percentage of values without doxycycline).
EKLF knockdown in human cord blood progenitors favors their megakaryocytic differentiation at the expense of erythrocytic differentiation
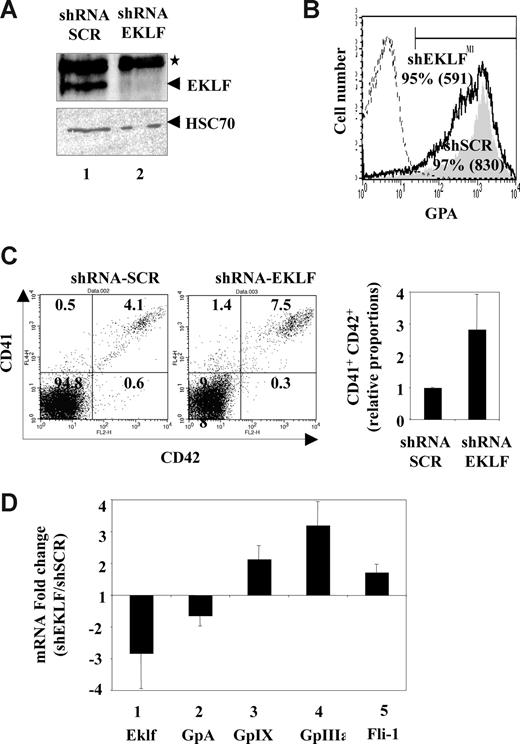
These results indicating that EKLF represses megakaryocytic gene expression in MEL cells prompted us to investigate the effect of EKLF knockdown on the in vitro differentiation of normal human primary progenitors. For that purpose, purified CD34+ human cord blood progenitors were first amplified in serum-free medium containing EPO, TPO, and SCF (E/MK medium) favoring the growth and differentiation of erythrocytic and megakaryocytic progenitors for 3 days and infected for 3 hours with lentiviruses allowing constitutive expression of GFP and shRNA directed against Eklf mRNA or control shRNA of scrambled sequence (SCR). Infected progenitors were then reseeded in E/MK medium and their cell progeny was analyzed 7 days later. In 3 independent experiments, unsorted progenitors transduced with Eklf or control shRNA lentiviruses always generated the same number of cells and the same high percentage of GFP+ cells (> 80%), thus indicating high and similar infection efficiencies. In these studies, Eklf shRNA reduced EKLF protein expression by more than 85% in GFP+ cells (Figure 4A). Most of the GFP+ cell population remained composed mainly of erythrocytic GPA+ cells, but these erythrocytic cells expressed lower levels of GPA (Figure 4B). A similar decrease in GPA expression was observed at the transcriptional level in previous studies of murine Eklf−/− fetal liver cells.17 The percentages of GFP+CD41+CD42+ megakaryocytic cells were found to vary between different preparations of CD34+ progenitors. However, for each given experiment performed with the same batch of CD34+ cells, the percentage of GFP+CD41+CD42+ megakaryocytic cells was systematically and significantly increased (mean fold increase: 2.8; P = .05) in cells transduced with the Eklf shRNA lentivirus (Figure 4C). In agreement with these data, cells transduced with the Eklf shRNA lentivirus displayed a marked decrease in Eklf and Gpa mRNA levels and a reciprocal increase in GpIX and GpIIIa mRNA (Figure 4D). Moreover, Fli-1 mRNA level was also increased by EKLF knockdown. Taken together, these results indicated that EKLF knockdown led a 2- to 3-fold increase in the megakaryocytic differentiation output of cord blood progenitors associated with increased expression of megakaryocytic and Fli-1 genes and decreased expression of the known EKLF target gene Gpa in erythroid cells.
EKLF knockdown enhances the megakaryocytic differentiation output of human CD34+ progenitors and decreases their expression of the known erythrocytic target gene Gpa. Human cord blood CD34+ cells were amplified for 3 days in E/MK medium, infected for 3 hours with either Eklf shRNA or control SCR shRNA lentivirus, and grown for further 7 days in E/MK medium as described in “Lentivirus production and cell infection.” Figure shows the analysis of GFP-positive cells performed 7 days after infection (typical results from 3 independent experiments). (A) Western blot analysis showing the drastic reduction of EKLF protein level in purified GFP+ cells infected with Eklf shRNA lentivirus (lane 2) compared with control shRNA lentivirus (lane 1). HSC70 protein is shown as loading control. (B) FACS analysis of GPA expression in GFP+ cells. Histograms show that most of the GFP+ cells infected with Eklf shRNA lentivirus still express GPA (black line, gate M1) but at lower level than cells infected with control shRNA lentivirus (filled histogram, gate M1). Control isotype histogram is shown as dotted line. The percentages of GPA-positive cells as well as the mean geometric fluorescence of GPA (in brackets) for each population are indicated. (C) Typical FACS analysis showing a 2-fold increase in the percentage of CD41+CD42+ differentiated megakaryocytic cells among GFP+ cells infected with the Eklf shRNA lentivirus compared with that infected with the control shRNA lentivirus (left panel). Numbers on plot are the percentages of total cells in the gate. Histogram (right panel) shows the mean and SD of the fold increase in megakaryocytic cells obtained in 3 independent experiments (P value of .05 in paired Student test). (D) Comparison of erythrocytic (lanes 1,2) and megakaryocytic (lanes 3-5) gene mRNA levels in GFP+ cells infected with Eklf or control shRNA lentivirus. Relative levels of each mRNA have been determined by quantitative RT-PCR using Hprt as a normalization reference. Final results are expressed as fold changes induced by EKLF knockdown (shEKLF/shSCR ratios; means and SD from 3 independent experiments).
EKLF knockdown enhances the megakaryocytic differentiation output of human CD34+ progenitors and decreases their expression of the known erythrocytic target gene Gpa. Human cord blood CD34+ cells were amplified for 3 days in E/MK medium, infected for 3 hours with either Eklf shRNA or control SCR shRNA lentivirus, and grown for further 7 days in E/MK medium as described in “Lentivirus production and cell infection.” Figure shows the analysis of GFP-positive cells performed 7 days after infection (typical results from 3 independent experiments). (A) Western blot analysis showing the drastic reduction of EKLF protein level in purified GFP+ cells infected with Eklf shRNA lentivirus (lane 2) compared with control shRNA lentivirus (lane 1). HSC70 protein is shown as loading control. (B) FACS analysis of GPA expression in GFP+ cells. Histograms show that most of the GFP+ cells infected with Eklf shRNA lentivirus still express GPA (black line, gate M1) but at lower level than cells infected with control shRNA lentivirus (filled histogram, gate M1). Control isotype histogram is shown as dotted line. The percentages of GPA-positive cells as well as the mean geometric fluorescence of GPA (in brackets) for each population are indicated. (C) Typical FACS analysis showing a 2-fold increase in the percentage of CD41+CD42+ differentiated megakaryocytic cells among GFP+ cells infected with the Eklf shRNA lentivirus compared with that infected with the control shRNA lentivirus (left panel). Numbers on plot are the percentages of total cells in the gate. Histogram (right panel) shows the mean and SD of the fold increase in megakaryocytic cells obtained in 3 independent experiments (P value of .05 in paired Student test). (D) Comparison of erythrocytic (lanes 1,2) and megakaryocytic (lanes 3-5) gene mRNA levels in GFP+ cells infected with Eklf or control shRNA lentivirus. Relative levels of each mRNA have been determined by quantitative RT-PCR using Hprt as a normalization reference. Final results are expressed as fold changes induced by EKLF knockdown (shEKLF/shSCR ratios; means and SD from 3 independent experiments).
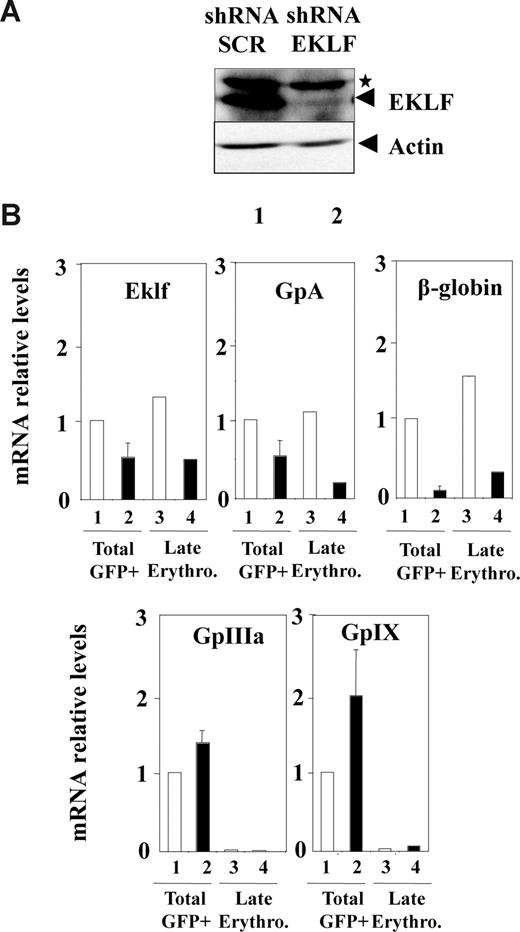
Although the increase in megakaryocytic gene expression roughly corresponded to the increase in megakaryocytic cell number, we wanted to determine whether EKLF knockdown could also induce megakaryocytic gene expression in already committed erythrocytic cells. To address this question directly, CD34+ progenitors were grown for 3 days in conditions favoring erythroid differentiation (EPO, IL3, SCF) and infected with either control or Eklf shRNA lentivirus. Infected late erythrocytic cells (GFP+CD36+GPA+CD41−) were then purified by FACS for transcript analyses 3 days later. As in previous experiments (Figure 4A), analysis of the whole cell population transduced with Eklf shRNA lentivirus revealed a marked decrease in EKLF protein (Figure 5A) as well as, Eklf, Gpa, and β-globin mRNA (Figure 5B lanes 1,2). A concomitant increase in megakaryocytic GpIIIa and GpIX mRNA levels was also observed, but these levels were at least 10-fold lower than that observed in the previous experiments performed in culture conditions favoring both erythrocytic and megakaryocytic differentiation (Figure 5B lanes 1,2). As expected, a similar reduction of Eklf, Gpa, and β-globin mRNA was observed in late erythrocytic cells (Figure 5B lanes 3,4). In contrast, GpIIIa and GpIX mRNA in late erythrocytic cells remained almost undetectable even after infection with Eklf shRNA lentivirus. Taken together, these results indicated that EKLF knockdown led a 2- to 3-fold increase in the megakaryocytic differentiation output of cord blood progenitors without inducing any detectable reactivation of megakaryocytic genes in fully committed erythrocytic cells.
EKLF knockdown in normal human CD34+ progenitors does not induce megakaryocytic gene expression in late differentiated erythrocytic cells. Human cord blood CD34+ cells were amplified for 3 days in medium favoring erythrocytic progenitor amplification, infected with either Eklf shRNA (■) or control SCR shRNA lentivirus (□), and grown for further 3 days in medium favoring terminal erythroid differentiation as described in “Lentivirus production and cell infection.” (A) Western blot analysis of EKLF performed on the whole GFP+ infected cell population. (B) Quantitative RT-PCR analyses of erythrocytic (Eklf, Gpa, and β-globin) and megakaryocytic (GpIIIa and GpIX) mRNA levels in total GFP+ infected cells (lanes 1-2) and in purified late erythrocytic GPA+CD36+GFP+ infected cells (lanes 3-4). Results are expressed as relative levels (normalized to Hprt mRNA) after standardization to the level determined in the whole cell population infected with control lentivirus (lane 1). Note that the levels of GpIIIa and GpIX mRNA observed in the whole cell population (lanes 1,2) were at least 10-fold lower than that observed in the whole cell population obtained in the culture conditions favoring both erythrocytic and megakaryocytic differentiation in Figure 4. Error bars represent SD.
EKLF knockdown in normal human CD34+ progenitors does not induce megakaryocytic gene expression in late differentiated erythrocytic cells. Human cord blood CD34+ cells were amplified for 3 days in medium favoring erythrocytic progenitor amplification, infected with either Eklf shRNA (■) or control SCR shRNA lentivirus (□), and grown for further 3 days in medium favoring terminal erythroid differentiation as described in “Lentivirus production and cell infection.” (A) Western blot analysis of EKLF performed on the whole GFP+ infected cell population. (B) Quantitative RT-PCR analyses of erythrocytic (Eklf, Gpa, and β-globin) and megakaryocytic (GpIIIa and GpIX) mRNA levels in total GFP+ infected cells (lanes 1-2) and in purified late erythrocytic GPA+CD36+GFP+ infected cells (lanes 3-4). Results are expressed as relative levels (normalized to Hprt mRNA) after standardization to the level determined in the whole cell population infected with control lentivirus (lane 1). Note that the levels of GpIIIa and GpIX mRNA observed in the whole cell population (lanes 1,2) were at least 10-fold lower than that observed in the whole cell population obtained in the culture conditions favoring both erythrocytic and megakaryocytic differentiation in Figure 4. Error bars represent SD.
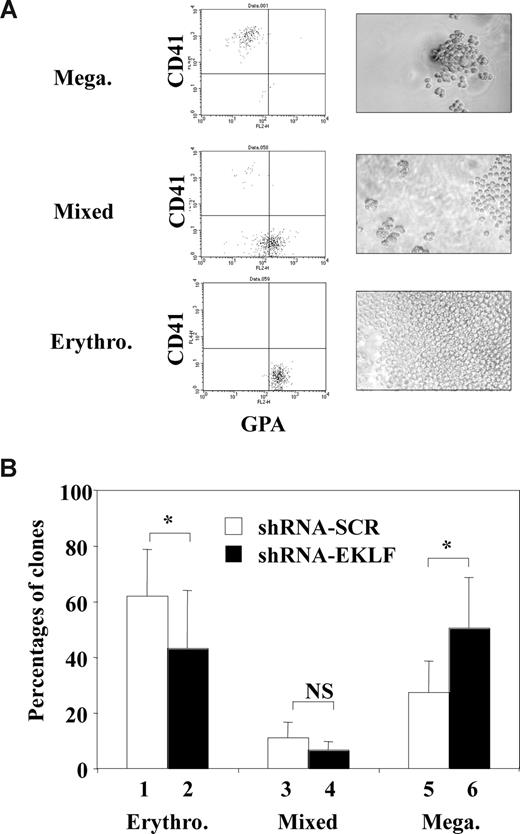
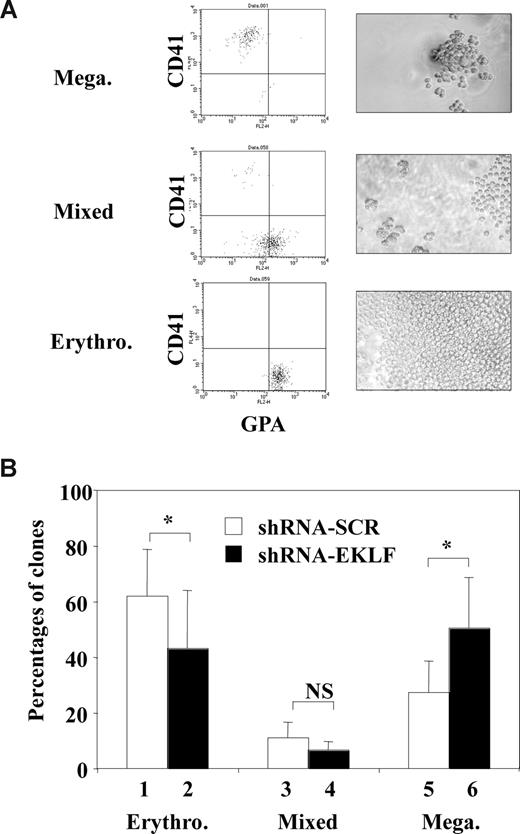
Several mechanisms could explain the increase in megakaryocytic output of CD34+ progenitors after EKLF knockdown, including selective outgrowth of megakaryocytic progenitors, selective loss of erythrocytic progenitors, or redirection of more immature erythrocytic and/or bipotent progenitors toward megakaryocytic differentiation. To distinguish among these possibilities, we decided to analyze the single-cell progeny of a sorted infected cell population enriched in bipotent progenitors. As in Figure 4, purified CD34+ human cord blood progenitors were first amplified for 3 days in E/MK medium, infected for 3 hours with Eklf or control shRNA lentiviruses. Immediately after infection, CD31MedCD36+ cells that were found to be enriched in erythromegakaryocytic bipotent progenitors (Figure S1) were sorted by FACS and reseeded at one cell per well for 7 days in E/MK medium. The use of short infection time was justified to minimize any bias due to preferential cell proliferation, survival, or death that could occur before the sorting of single CD31MedCD36+ cells. Because this infection time was too short to allow detectable expression of GFP for the sorting of infected cells, infected GFP+ cells were identified a posteriori at the time of the phenotypic analyses 7 days after infection. Three clearly distinct types of GFP+ clones could be identified: erythrocytic clones (containing large number of small cells expressing GPA), megakaryocytic clones (containing small numbers of large cells expressing CD41), and mixed erythromegakaryocytic clones (containing intermediate numbers of small and large cells expressing GPA or CD41; Figure 6A). The presence of mixed clones as well as the high cloning efficiency of this CD31MedCD36+ population attested to its enrichment in erythromegakaryocytic bipotent progenitors. Interestingly, the percentage of GFP+ megakaryocytic clones derived from cells infected with Eklf shRNA lentivirus was significantly increased and that of erythrocytic clones was significantly decreased compared with cells infected with control shRNA lentivirus. Concomitantly, the percentage of mixed clones also decreased, although the decrease was not statistically significant (Figure 6B). Importantly, the overall cloning efficiency in each experiment did not differ between cells infected with Eklf or control shRNA lentivirus (54% vs 55%, 88% vs 84%, and 82% vs 84% for the 3 experiments performed). Altogether, these results indicated that the enhanced megakaryocytic differentiation output induced by EKLF knockdown occurred at the expense of erythrocytic differentiation without selective outgrowth or loss of initial clonogenic progenitors. This in turn strongly suggested that EKLF knock-down increased the commitment of bipotent progenitors toward megakaryocytic differentiation at the expense of erythrocytic differentiation.
EKLF knockdown in normal human progenitors enhances megakaryocytic differentiation at the expense of erythrocytic differentiation. Human cord blood CD34+ cells were amplified for 3 days in E/MK medium, infected for 3 hours with either Eklf shRNA or control SCR shRNA lentiviruses. Immediately after infection, CD36+CD31Med cells enriched in bipotent progenitors were sorted by FACS and reseeded for 7 days in E/MK as described in “Lentivirus production and cell infection” and Figure S1. Each well was inspected under fluorescent microscope to identify clones containing GFP+ cells attesting successful infection and classified as megakaryocytic, erythrocytic, or mixed clones based on light-microscope observation, FACS analysis of the expression of GPA and CD41, and benzidine staining. Erythrocytic clones were identified by a large number of small cells expressing GPA but not CD41 and containing benzidine-positive cells; megakaryocytic clones were identified by a small number of large cells expressing CD41 but not GPA and containing no benzidine-positive cells; mixed clones were identified by an intermediate number of both types of cells. (A) Typical FACS diagrams and light-microscope fields illustrating erythrocytic, megakaryocytic, and mixed clones obtained. (B) Histogram shows the percentages of these 3 different types of GFP+ clones derived from cells infected with either Eklf shRNA (■) or control shRNA virus (□) (means and SD from 3 independent experiments with 60-92 GFP+ clones recorded for each condition). Statistically significant differences (P < .05; paired Student test) are indicated by asterisks (NS indicates nonsignificant).
EKLF knockdown in normal human progenitors enhances megakaryocytic differentiation at the expense of erythrocytic differentiation. Human cord blood CD34+ cells were amplified for 3 days in E/MK medium, infected for 3 hours with either Eklf shRNA or control SCR shRNA lentiviruses. Immediately after infection, CD36+CD31Med cells enriched in bipotent progenitors were sorted by FACS and reseeded for 7 days in E/MK as described in “Lentivirus production and cell infection” and Figure S1. Each well was inspected under fluorescent microscope to identify clones containing GFP+ cells attesting successful infection and classified as megakaryocytic, erythrocytic, or mixed clones based on light-microscope observation, FACS analysis of the expression of GPA and CD41, and benzidine staining. Erythrocytic clones were identified by a large number of small cells expressing GPA but not CD41 and containing benzidine-positive cells; megakaryocytic clones were identified by a small number of large cells expressing CD41 but not GPA and containing no benzidine-positive cells; mixed clones were identified by an intermediate number of both types of cells. (A) Typical FACS diagrams and light-microscope fields illustrating erythrocytic, megakaryocytic, and mixed clones obtained. (B) Histogram shows the percentages of these 3 different types of GFP+ clones derived from cells infected with either Eklf shRNA (■) or control shRNA virus (□) (means and SD from 3 independent experiments with 60-92 GFP+ clones recorded for each condition). Statistically significant differences (P < .05; paired Student test) are indicated by asterisks (NS indicates nonsignificant).
Discussion
One of the main conclusion of this study is that endogenous EKLF restricts the commitment of human bipotent progenitors toward megakaryocytic differentiation at the benefit of erythrocytic differentiation. This conclusion is supported by concordant observations showing that shRNA-mediated EKLF knockdown increases the in vitro production of megakaryocytic cells by CD34+ multipotent progenitors and most importantly increases the relative proportion of megakaryocytic versus erythrocytic colonies generated by bipotent progenitors. Two crucial points must be taken into account in the interpretation of these results. First, single-cell sorting of the CD31MedCD36+ bipotent population has been done only 3 hours after the beginning of the infection with lentivirus expressing shRNA. This very short time excludes any bias that could be due to differential growth of erythrocytic or megakaryocytic progenitors during infection. Furthermore, the cells infected with either Eklf or control shRNA lentivirus displayed the same cloning efficiency, thus excluding any bias that could be due to preferential death of erythrocytic progenitors and/or preferential survival of megakaryocytic progenitors with reduced EKLF.
This study also shows that EKLF displays the interesting property to repress FLI-1–dependent endogenous megakaryocytic gene transcription. Indeed, enforced expression of EKLF represses FLI-1–induced expression of endogenous megakaryocytic genes in K562 cells (Figure S3). Reciprocally, in both MEL cells and human CD34+ progenitors, EKLF knockdown not only leads to an expected decrease in the expression of its known target genes (such as Gpa, Ahsp, or β-globin) but also to a concomitant increase in the expression of several megakaryocytic genes (GpIX, Gp1b, or GpIIIa) already known as direct target genes of FLI-1, including the Fli-1 gene itself. Most importantly, the increase in megakaryocytic and Fli-1 gene expression in MEL cells is associated with a marked increase in FLI-1 protein occupancy at their promoters. These observations strongly suggest that the repression of megakaryocytic genes by endogenous EKLF is at least partially dependent on the direct or indirect repression of Fli-1 gene expression and autoactivation. This interpretation is in agreement with our failure to get any evidence for a role of endogenous EKLF in the repression of megakaryocytic genes in fully committed erythrocytic cells that do not express FLI-1. Indeed, we did not find any re-expression of megakaryocytic genes in purified erythrocytic cells generated from CD34+ progenitors after EKLF knockdown, although, in the same experiment, EKLF knockdown was clearly sufficient to decrease the expression of EKLF target genes (Gpa and β-globin). This suggests in turn that endogenous EKLF most probably initiates the repression of megakaryocytic genes only in bipotent progenitors still expressing FLI-1. In that respect, it would be interesting to know whether the lack of megakaryocytic gene expression in fully committed erythrocytic cells is due to only the loss of FLI-1 expression or whether other mechanisms (such as chromatin condensation for example) are also involved. Interestingly enough, we recently found, using transgenic mice allowing inducible deletion of the Fli-1 gene, that FLI-1 is absolutely required for the megakaryocytic commitment of bipotent MEP (Joëlle Starck and F.M., unpublished results, October 2007). Altogether, these data strongly favor the interpretation that the contribution of EKLF in the inhibition of megakaryocytic differentiation is at least partially dependent on the repression of the Fli-1 gene expression.
While this article was under revision, a very interesting study51 based on inducible EKLF overexpression in ES cells and analysis of Eklf−/− ES cells also concluded that EKLF represses megakaryocytic differentiation. The present study not only strengthens this conclusion but further establishes that this negative control of megakaryopoietic differentiation occurs at the benefit of erythropoietic differentiation. Both studies demonstrate that, in normal progenitors, the negative control of megakaryocytic differentiation occurs at least in part through the Fli-1 gene repression. Understanding how EKLF represses the expression of the Fli-1 gene is thus of crucial importance.
Previous studies have shown that EKLF displays 2 different repressor domains: the zinc fingers domain, which can recruit Sin3A and HDAC1,48,52 and more recently lysine 74, which when sumoylated can recruit the Mi-2β component of the NuRD repressor.53 Interestingly, unlike wild-type EKLF, a K74R EKLF mutant that cannot be sumoylated cannot inhibit megakaryocytic differentiation when it is overexpressed under the control of the PF4-gene promoter in transgenic mice.53 Based on the detection of small amounts of EKLF on the Fli-1 gene promoter in embryonic bodies derived from ES cells, a simple model could be proposed by which EKLF would bind to conserved EKLF putative DNA binding elements and then recruit the Sin3A or NuRD repressor complexes.51,53 Several new results obtained in the present study question this simple model. First, we found that the activation of Fli-1 gene and FLI-1 target genes induced by EKLF knockdown in MEL cells is associated with a much stronger increase in FLI-1 occupancy at their promoters than that expected from the very slight increase of FLI-1 protein levels in the nucleus (Figure 3; Figure S2). This thus indicates that EKLF may be also involved in inhibition of FLI-1 recruitment to its target promoters. Furthermore, we found that a zinc finger mutant of EKLF that is unable to bind DNA48 is still able to repress FLI-1–dependent activation of megakaryocytic genes in K562 cells (Figure S3), thus implying that if EKLF recruitment is involved in the repression of FLI-1 target genes this recruitment should be indirect. It is known that FLI-1 directly interacts with GATA-1, allowing their cooperative DNA binding and synergistic activation of megakaryocytic genes.24,54 Symmetrically, EKLF has also been shown to interact and to cooperate with GATA-1 in the synergistic activation of some erythrocytic promoters.55 Taking into account the striking opposite regulation of erythrocytic versus megakaryocytic genes in response to EKLF knockdown, it is tempting to speculate that FLI-1 and EKLF might compete with limiting amounts of common cofactors such as GATA-1 for the formation of mutually exclusive multiprotein complexes able to activate either erythrocytic or megakaryocytic promoters. Our finding that EKLF knockdown is associated with a concomitant increase of both FLI-1 and GATA-1 recruitment at the Gp1bα promoter would be in agreement with this possibility. Another alternative but nonexclusive possibility could be that physical association between Fli-1 and EKLF20 precludes the formation of these mutually exclusive positive complexes. Whatever are the exact mechanisms by which EKLF represses the commitment toward megakaryocytic lineage, this study already strongly suggests that this repression is mediated at least partially by the inhibition of FLI-1 protein function.
The online version of this article contains a data supplement.
The publication costs of this article were defrayed in part by page charge payment. Therefore, and solely to indicate this fact, this article is hereby marked “advertisement” in accordance with 18 USC section 1734.
Acknowledgments
We are very grateful to C. Gonnet and M. Weiss for their expert technical assistance in recombinant DNA cloning and FACS analyses, respectively; to M. Peretti for advice on ChIP experiments; and to J. Starck and members of the Centre de Génétique Moléculaire et Cellulaire for helpful discussion. We also greatly acknowledge M. Van de Wetering (University Medical Center, Utrecht, The Netherlands) for providing his pTer vector before publication and J. Bieker (Mount Sinai School of Medicine, New York, NY) for EKLF monoclonal antibody and EKLF mutant.
This study was supported by grants from the CNRS, the Université Lyon 1, the Fondation de France (Paris, France) (grant no. 2003005020), and the Ligue Nationale Contre le Cancer (Paris, France) (Equipe labellisée 2005-2007; 3-year salary to F.B. and 6-month salary to G.J.). G.J. was also supported by 3-year salary from the French Ministère de l'Education Nationale et de la Recherche (Paris, France).
Authorship
Contribution: F.B. designed and performed the experiments, interpreted the data, and assisted with the paper; G.J. and N.C. performed experiments and interpreted the data; D.B. assisted with experiments on human progenitors; F.L. designed and assisted with experiments on human progenitors and interpreted the data; B.G. interpreted the data and assisted with the writing of the paper; W.V. made valuable suggestions on the design of experiments; F.M. designed the experiments, interpreted the data, and wrote the paper.
Conflict-of-interest disclosure: The authors declare no competing financial interests.
Correspondence: François Morlé, CNRS UMR5534, Centre de Génétique Moléculaire et Cellulaire, 16 rue Dubois, Université Lyon 1, Villeurbanne, F-69622, France; e-mail: morle@univ-lyon1.fr.

