Abstract
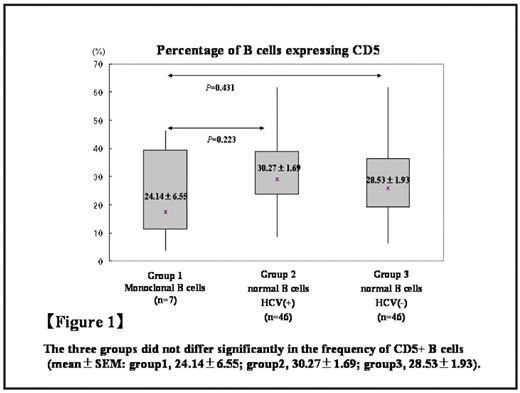
Hepatitis C virus (HCV), being lymphotrophic as well as hepatotrophic, has been reported to induce B-cell proliferative disorders such as mixed cryoglobulinemia and B-cell lymphoma. To investigate the association between HCV and B-cell proliferation, we evaluated the incidence and characteristics of monoclonal B cells in the circulating blood of HCV-infected cases relative to controls with non-HCV hepatic diseases. We first evaluated the surface immunoglobulin κ:λ light-chain ratios of the circulating B (CD19+) cells in 240 HCV-infected cases and 150 controls. Light chain restriction (κ:λ ratio >3:1 or < 1:2) was detected in 7 cases with HCV (2.9%) (Table 1), but was never detected in the controls (p<0.05). As these monoclonal B cells were not identified morphologically, they were analyzed for CD5/CD20 expression. None of them showed the so-called chronic lymphocytic leukemia (CLL)-phenotype cells. The clonal and normal B cells did not differ significantly in their intensity of CD5 expression (Figure 1). The B-cell clonality was confirmed in all 7 cases by polymerase chain reaction (PCR) analysis of the immunoglobulin heavy-chain (IgH) gene rearrangements and the t(14;18) fusion gene was detected in one case. The loss of clonality was observed in 2 cases treated with interferon and in one case treated with splenectomy. The longitudinal study is required to determine whether these circulating monoclonal B cells progress to lymphoproliferative disorders or not.
Table 1. The clinical data of the 7 HCV-infected cases with monoclonal H cells
| Case No . | Age . | Sex . | WBC count./ul . | Lymphocyte count./ul . | CD19+ cells in lymphocytes. % . | Light chain . | κ/λ. . | CD5+B cell. % . | Cryoglobulin . | IFN therapy . |
|---|---|---|---|---|---|---|---|---|---|---|
| 1 | 78 | M | 2,800 | 710 | 26.46 | κ | 33.59 | 17.45 | (+) | (−) |
| 2 | 65 | M | 3,400 | 720 | 5.41 | λ | 0.23 | 15.93 | (−) | (+) |
| 3 | 84 | M | 5,700 | 3,520 | 46.68 | κ | 11.31 | 6.8 | (+) | (−) |
| 4 | 74 | F | 3,300 | 1,750 | 15.01 | λ | 0.037 | 46.31 | (−) | (−) |
| 5 | 65 | F | 2,500 | 580 | 34.46 | κ | 8.07 | 40.17 | (+) | (−) |
| 6 | 72 | F | 2,000 | 940 | 25.4 | λ | 0.198 | 38.77 | (−) | + |
| 7 | 66 | M | 4,200 | 1,380 | 9.73 | λ | 0.41 | 3.53 | (+) | (−) |
The three groups did not differ significantly in the frequency of CD5+ B cells (mean±SEM: group1, 24.14±6.55; group2, 30.27±1.69; group3, 28.53±1.93).
The three groups did not differ significantly in the frequency of CD5+ B cells (mean±SEM: group1, 24.14±6.55; group2, 30.27±1.69; group3, 28.53±1.93).
Disclosures: No relevant conflicts of interest to declare.
Author notes
Corresponding author


