Abstract
Erythroblasts adhere to central macrophages forming erythroblastic islands in hematopoietic tissues, but the function of these islands is not understood. Murine erythroblastic islands were reconstituted in vitro with macrophages and developmentally synchronous proerythroblasts. Erythroblasts cocultured with macrophages proliferated 3-fold greater than erythroblasts cultured alone. Direct contact with the macrophages was necessary for this enhanced erythroblast proliferation, which resulted from decreased transit time in the G0/G1 phase of cell cycle. Increased erythroblast proliferation in erythroblastic islands occurred over a wide range of erythropoietin concentrations and was the result of a mechanism different from the antiapoptotic effect of erythropoietin. Erythroblasts adherent to macrophages had slightly delayed enucleation, but otherwise differentiation was similar to erythroblasts cultured alone or those that became nonadherent in cocultures. These results suggest a mechanism for the development of anemias associated with abnormal macrophage function and for reduced responsiveness of those anemias to erythropoietin therapy.
Introduction
In hematopoietic tissues, the hematopoietic progenitor and precursor cells are in close contact with various nonhematopoietic stromal cells. Potential roles of these interactions include modulation of hematopoietic cell survival, proliferation, and differentiation. During late stages of erythropoiesis, the hematopoietic–stromal cell interaction has been identified in a specific structure termed the erythroblastic island, which is composed of erythroid progenitor and precursor cells surrounding a single macrophage.1 Erythroblastic islands are increased in patients with hemolytic anemias and decreased in hypertransfused animals.2 Bessis et al3 proposed that an erythroblastic island forms when a single macrophage and colony forming unit-erythroid (CFU-E) associate and the CFU-E undergoes 4 to 5 divisions, producing 16 or 32 erythroblasts bound to each macrophage. Hematopoietic cells proliferated more in clusters with macrophages than when they were dissociated from stromal macrophages and cultured alone.4 A specific proliferative effect of macrophages on erythroid cells was not demonstrated because these clusters of hematopoietic cells contained other cell types in addition to erythroid cells. Using human blood-derived macrophages and erythroid cells to reconstitute erythroblastic islands, Hanspal and Hanspal5 demonstrated increased accumulation of cultured erythroid cells that had direct contact with macrophages, but it was not determined whether this increase was the result of decreased apoptosis, increased proliferation, or both.
Erythropoietin (EPO) is the hormone that permits survival of erythroid progenitors from CFU-E through early proerythroblast stages of differentiation by preventing their apoptosis.6 EPO is produced by the kidneys in response to hypoxia, and the circulating EPO concentration is the main regulator of erythroid pro-genitor numbers. How this regulatory function of EPO relates to macrophage-erythroid cell interactions during the same period of erythropoiesis is unknown.
Splenic erythroid progenitor cells of mice infected with the anemia-inducing strain of Friend leukemia virus (FVA cells) have been used to develop an in vitro system of terminal erythropoiesis.7 This system provides a purified population of developmentally synchronous late CFU-E/early proerythroblasts that can be studied under controlled conditions through the stage of enucleation. In most of the present studies, FVA cells were the source of erythroid cells for reconstitution of erythroblastic islands in vitro. Spleens of FVA-infected mice were also the source of macrophages for these reconstituted erythroblastic islands. Interaction with macrophages in erythroblastic islands enhanced erythroid cell proliferation 3-fold over erythroid cells cultured alone. The enhanced erythroid cell proliferation was found at all EPO concentrations and was the result of reduced transit time of the G0/G1 phase of cell cycle. Suppression of macrophage-enhanced proliferation of late stage erythroid cells may be relevant to anemias associated with abnormal macrophage function and for reduced responsiveness of those anemias to EPO therapy.
Methods
Mice
All experiments were approved by the Vanderbilt University Animal Care Committee. Female CD2F1 mice between 6 and 8 weeks old were infected with the anemia-inducing strain of Friend virus (FVA) by tail-vein injection and subsequently developed splenic erythroblastosis.7 They were killed, and their spleens harvested 2 weeks after infection. Uninfected mice were made anemic by bleeding 0.4 mL followed by intraperitoneal injections of an equal volume of normal saline at 4, 3, and 2 days before death. These phlebotomized, anemic mice had increased splenic erythropoiesis because of increased endogenous EPO production.8
Isolation and culture of macrophages
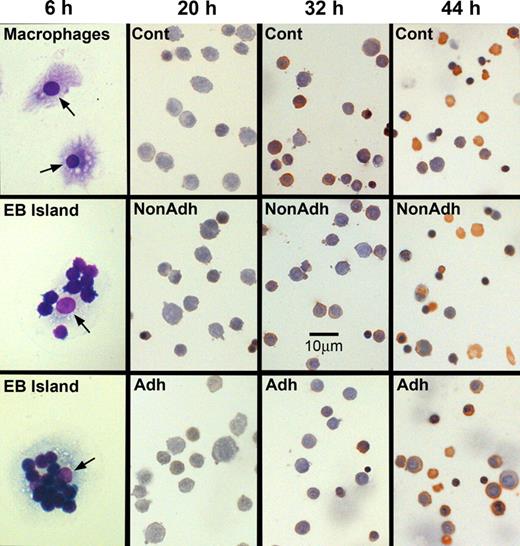
The method of Crocker and Gordon9 was slightly modified to obtain purified macrophages for reconstitution of erythroblastic islands. Spleens from FVA-infected or bled mice were minced, and resultant cells and cell clusters were suspended in 25 mL Iscove modified Delbecco medium (IMDM). The suspension was placed for 1 minute in a test tube, and debris and large clumps that settled to the bottom were discarded. Then, 5 mL aliquots of the suspension were each layered onto 10 mL of IMDM with 30% fetal bovine serum (Hyclone, Logan, UT) in 50 mL test tubes. After 1 hour, the upper 13 mL of each aliquot was discarded, and the lower 2 mL was combined and gently suspended in IMDM containing 1% deionized bovine serum albumin (Intergen, Purchase, NY), 30% fetal bovine serum, 100 μg/mL of streptomycin, 100 U/mL penicillin G, 0.1 mM α-thioglycerol, and 4 U/mL recombinant human EPO (OrthoBiotech, Bridgewater, NJ). This medium is our standard erythroid culture medium (ECM), and final suspensions were 40 mL for each gram of FVA spleen or 15 mL for each gram of phlebotomized spleen. The cells and cell cluster suspensions were plated at 5 mL per 30-mm-diameter tissue culture dish and incubated at 37°C, in humidified air with 4.5% CO2, which permitted attachment of macrophages to the tissue culture plates. After 8 hours, the medium was removed and the plates were rinsed with ice-cold phosphate buffered saline (PBS) to remove all unattached cells. Erythroid cells adherent to attached macrophages were detached by adding ice-cold 0.5 mM EDTA (ethylenediaminetetraacetic acid) in PBS, removing it 1 hour later by repeated pipetting and rinsing twice with ice-cold PBS. The remaining isolated macrophages were incubated for 16 hours, in fresh ECM without EPO. Figure 1 (6 hours, top panel) shows a photomicrograph of Wright-stained attached macrophages that were fixed in 50% methanol in PBS followed by 100% methanol.
Erythroblastic islands can be reconstituted with splenic macrophages and developmentally synchronized CFU-E/proerythroblasts from the spleens of Friend virus-infected mice. (Left) Photomicrographs of cultures fixed in situ at 6 hours of coculture. (Top panel) Purified, Wright-stained splenic macrophages attached to tissue culture plates. These macrophages did not receive erythroblasts for coculture. The lower 2 panels in the left column show adherent erythroblasts that reconstituted erythroblastic islands at 6 hours of coculture. Arrows point to macrophage nuclei. The remaining columns show photomicrographs of 3,3′-dimethoxybenzidine and hematoxylin-stained cytocentrifuge preparations of control erythroblasts cultured without macrophages (Cont), nonadherent erythroblasts from cocultures with macrophages (NonAdh), and erythroblasts that were adherent to macrophages (Adh) at 20, 32, and 44 hours of culture. At 20 hours, almost all cells are proerythroblasts, which accumulate heme (amber stain) by 32 hours. At 44 hours, control and nonadherent cultures have numerous reticulocytes (enucleated, amber cells) and extruded nuclei (dense, round, purple bodies). Slightly fewer adherent cells have enucleated at this time. Bar represents 10 μm.
Erythroblastic islands can be reconstituted with splenic macrophages and developmentally synchronized CFU-E/proerythroblasts from the spleens of Friend virus-infected mice. (Left) Photomicrographs of cultures fixed in situ at 6 hours of coculture. (Top panel) Purified, Wright-stained splenic macrophages attached to tissue culture plates. These macrophages did not receive erythroblasts for coculture. The lower 2 panels in the left column show adherent erythroblasts that reconstituted erythroblastic islands at 6 hours of coculture. Arrows point to macrophage nuclei. The remaining columns show photomicrographs of 3,3′-dimethoxybenzidine and hematoxylin-stained cytocentrifuge preparations of control erythroblasts cultured without macrophages (Cont), nonadherent erythroblasts from cocultures with macrophages (NonAdh), and erythroblasts that were adherent to macrophages (Adh) at 20, 32, and 44 hours of culture. At 20 hours, almost all cells are proerythroblasts, which accumulate heme (amber stain) by 32 hours. At 44 hours, control and nonadherent cultures have numerous reticulocytes (enucleated, amber cells) and extruded nuclei (dense, round, purple bodies). Slightly fewer adherent cells have enucleated at this time. Bar represents 10 μm.
Isolation and culture of erythroblasts
Spleen erythroid cells from one FVA-infected mouse or 4 bled mice were separated at 4°C by velocity sedimentation at unit gravity on continuous gradients of 1% to 2% bovine serum albumin in PBS.7 Rapidly sedimenting cells that were highly enriched for late CFU-E/proerythroblasts were cultured in ECM as previously described except that the numbers of cells were reduced to 5 × 10⁵ cells/mL. Erythroblasts were plated alone (control cultures) or with the previously isolated macrophages (cocultures). In some experiments, EPO varied from no added EPO to 4 U/mL. After 6 hours, nonadherent erythroblasts were removed from cocultures by pipetting with the medium in the cultures, followed by rinsing with an additional 3 mL of medium. The remaining erythroblasts in the cocultures were attached to macrophages that adhered to the tissue culture plates. Thus, erythroblastic islands had been reconstituted with developmentally homogeneous CFU-E/proerythroblasts at 6 hours of coculture. Fresh ECM was added, and the cocultures were continued for as long as 72 hours. For all experiments, the first analyses were at 6 hours, immediately after the cocultures had the excess erythroid cells removed. The lower 2 panels in the 6-hour column in Figure 1 show Wright-stained reconstituted islands. In some experiments, culture medium conditioned for 24 hours by macrophages cultured alone or by cocultures of macrophages and erythroblasts was collected and stored at −80°C.
Quantification of erythroblasts
Erythroid cells were harvested from cultures at 6, 20, 32, 44, and 72 hours. Control cultures were collected by pipetting and rinsing with 3 mL ice-cold PBS. Cocultures were harvested in a similar manner but in 2 separate fractions: nonadherent and adherent. Preliminary experiments showed that the population of erythroid cells that was adherent to macrophages in the cocultures at 6 hours produced a nonadherent population during subsequent hours of coculture. Nonadherent erythroblasts were those cells collected from cocultures by pipetting followed by brief rinsing with 3 mL ice-cold PBS. Adherent erythroblasts were collected using ice-cold 0.5 mM EDTA in PBS and repeated ice-cold PBS rinsing described in the previous section for isolation and culture of macrophages. Harvested erythroblasts were stained with methylene blue and counted using a hemocytometer, with a minimum of 100 erythroblasts counted per collected culture dish.7 Numbers of erythroblasts in the control and cocultures for each experiment were determined by counts of triplicate cultures at 6 hours, when cocultures had only adherent erythroblasts because the nonadherent population had not yet been generated. Two to 4 culture plates were counted at subsequent times to decrease the effects of interplate variability.
Assessment of differentiation and enucleation
Cytocentrifuge preparations of erythroblasts collected from cocultures and control cultures were stained with 3,3′-dimethoxybenzidine and hematoxylin. To measure enucleation in the cultures at 44 hours and 72 hours of culture, 500 erythroid cell elements (erythroblasts + reti-culocytes + extruded nuclei) in consecutive oil immersion fields were counted and expressed as a percentage of total erythroid cell elements.
Measurements of apoptosis and cell-cycle phase
Control, nonadherent, and adherent erythroblasts were harvested, counted, rinsed in PBS, fixed in 1% paraformaldehyde in PBS, and permeabilized in 70% ethanol in PBS.10 For analyses, 2 × 10⁶ cells were aliquoted and centrifuged, washed in PBS, then fluorescently labeled by terminal deoxynucleotidyl transferase-deoxyuridine triphosphate (dUTP) nick-end labeling (TUNEL) using fluoroscein isothiocyanate (FITC) conjugated to dUTP (Boehringer Mannheim, Indianapolis, IN). Labeled cells were washed, resuspended in 200 μg/mL RNAase A (Sigma-Aldrich, St Louis, MO) and 40 μg/mL propidium iodide (Sigma-Aldrich) in PBS to determine total DNA content for cell-cycle phase. Two-color flow cytometry was used to assess the percentage of apoptotic cells (TUNEL-positive) and to determine the cell cycle phase of nonapoptotic cells. Data were analyzed using ModFit DNA modeling software linked to Winlist (both from Verity Software House, Topsham, ME).
Measurement of cell cycle with pulse-chase of bromodeoxyuridine
Cocultured and control erythroblasts were pulse-chase labeled at 6 hours with bromodeoxyuridine (BrdU) by a slight modification of the method of Dolbeare et al.11 Briefly, 25 μg/mL BrdU was added to the culture plates. After 30 minutes, control erythroblasts and nonadherent erythroblasts were collected, centrifuged, washed twice with room temperature ECM, and recultured. Adherent erythroblasts remaining attached to the macrophages were rinsed twice with room temperature ECM and recultured. BrdU-pulsed erythroblasts were collected from control and cocultures every 2 hours during the chase period, rinsed with PBS, and suspended in 70% ethanol in PBS. For analysis, 2 × 10⁶ cells per sample were centrifuged, rinsed in PBS, and suspended for 10 minutes in 1 mL of ice-cold 10 mM HCl. After 3 mL distilled water was added, the cells were centrifuged, resuspended in 1 mL distilled water, and heated to 95°C for 10 minutes to denature DNA. After heating, the cells were placed in ice-water for 5 minutes for rapid DNA reannealing. Samples were then centrifuged, resuspended in 100 μL PBS with 0.5% Triton X-100, and incubated with 5 μL FITC-conjugated anti-BrdU (Roche, Indianapolis, IN) for 30 minutes at room temperature. The cells were centrifuged, resuspended in 200 μg/mL RNAase A and 40 μg/mL propidium iodide in PBS, and analyzed by 2-color flow cytometry for FITC fluorescence to determine BrdU incorporation and propidium iodide fluorescence to determine cell cycle phase.
Photomicroscopy
Stained cytospin preparations and macrophages or reconstituted erythroblastic islands fixed in situ were photographed with an Axio Microscope, using a 63× oil immersion, Plan-Apochromat objective, numeric aperture 1.4 (Zeiss, Thornwood, NY). Images were recorded with a digital AxioCam MRc5 camera/Axiovision Product Suite CD21 (Zeiss). Digital images were processed with Adobe Photoshop CS2 (version 9.0.2) software (Adobe Systems, San Jose, CA).
Data analysis
Data were analyzed using Student 2-tailed, paired t test. Data with P less than .05 were considered significant.
Results
Erythroblastic islands can be reconstituted with macrophages and CFU-E/proerythroblasts from spleens of FVA-infected and bled mice
Splenic cell clusters containing macrophages and attached erythroblasts were suspended in ECM such that each gram of spleen tissue was suspended in 40 mL and distributed equally in 5-mL aliquots into eight 30-mm-diameter tissue culture dishes. Up to 4 g of spleen tissue was plated in some experiments. By distributing these suspensions of splenic macrophage clusters in equal amounts, each tissue culture dish within an individual experiment had the capacity to bind equal numbers of CFU-E/proerythroblasts. After stripping of endogenous erythroblasts, culturing isolated macrophages, and 6-hour initial binding period for the added CFU-E/proerythroblasts, the total numbers of CFU-E/proerythroblasts that adhered to macrophages varied little from experiment to experiment with a mean of 4.5 plus or minus 0.2 × 10⁵ adherent erythroblasts per tissue culture dish (± SE for 40 experiments). The number of CFU-E/proerythroblasts that adhered to macrophages remained the same when initial concentrations of CFU-E/proerythroblasts added to the isolated macrophages were varied from 1.2 to 5 × 10⁵ CFU-E/proerythroblasts per milliliter. This result indi-cated that adherent CFU-E/proerythroblasts at 6 hours were at maximal plateau level when added at the standard condition of 5 × 10⁵ per mL.
CFU-E/proerythroblasts cocultured with macrophages accumulate 3-fold more cells during differentiation than when cultured alone
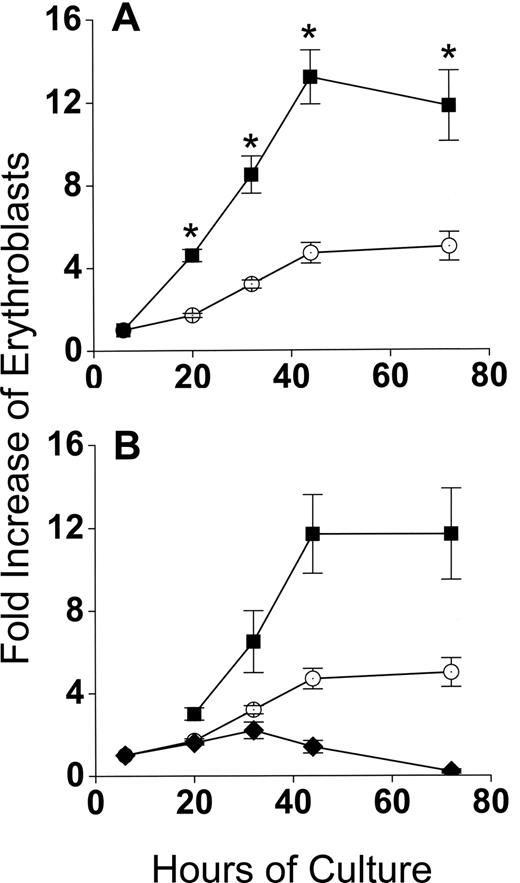
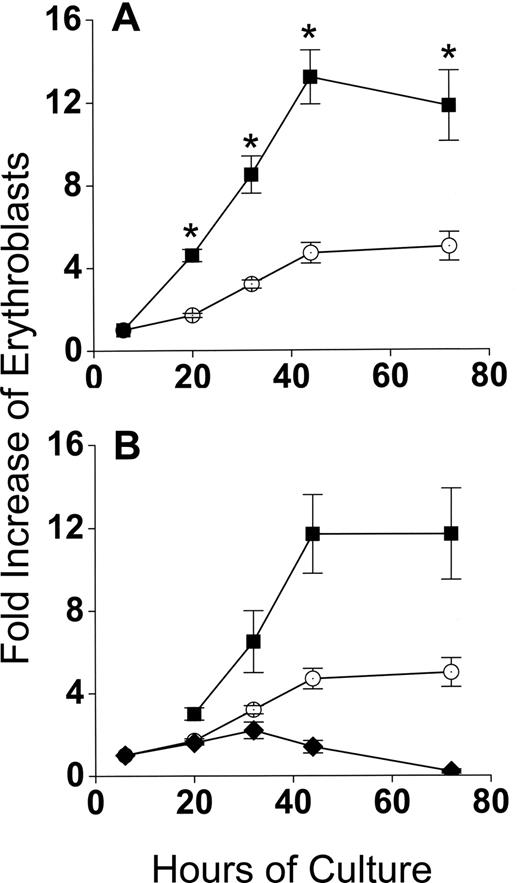
Developmentally synchronous CFU-E/proerythroblasts from FVA-infected mice proliferate when cultured with EPO, such that by 44 hours cell numbers increase 4- to 5-fold.12 As expected, CFU-E/proerythroblasts cultured alone (control cultures) had between a 4- and 5-fold increase in cell number by 44 hours, from 5 × 10⁵/mL to 2.3 × 10⁶/mL (Figure 2A). However, when CFU-E/proerythroblasts were cocultured with macrophages, their mean numbers increased approximately 13-fold, from 0.9 × 10⁵/mL to 1.2 × 10⁶/mL (Figure 2A). When erythroblasts in cocultures were analyzed according to their adherence to macrophages, the adherent erythroid population means increased only 1.7- to 2.2-fold to 1.5 × 10⁵/mL and 2 × 10⁵/mL at 20 hours and 32 hours, respectively, and then decreased to baseline at 44 hours (Figure 2B). The adherent layer, however, generated a much larger nonadherent erythroid cell population that resulted in a significantly greater fold increase (P < .001) than the controls at all times (Figure 2B).
Coculture with macrophages in reconstituted erythroblastic islands increases proliferation of FVA erythroblasts. (A) Fold increase in total numbers of FVA erythroblasts cocultured with macrophages in reconstituted erythroblastic islands (■) and in control cultures without macrophages (○). Control cultures increased from 5 × 10⁵ erythroblasts/mL at 6 hours to 2.3 × 10⁶ erythroblasts/mL at 44 hours. Cocultures increased from 0.9 × 10⁵ erythroblasts/mL to 1.2 × 10⁶ erythroblasts/mL. (B) Fold increase in FVA erythroblasts of adherent erythroblasts in cocultures ( ), nonadherent erythroblasts in cocultures (■), and in control cultures (○). Results are the means plus or minus SE from 24 separate experiments; increased accumulations of erythroblasts in cocultures compared with control cultures were significant (*P < .001) at all times after 6 hours.
Coculture with macrophages in reconstituted erythroblastic islands increases proliferation of FVA erythroblasts. (A) Fold increase in total numbers of FVA erythroblasts cocultured with macrophages in reconstituted erythroblastic islands (■) and in control cultures without macrophages (○). Control cultures increased from 5 × 10⁵ erythroblasts/mL at 6 hours to 2.3 × 10⁶ erythroblasts/mL at 44 hours. Cocultures increased from 0.9 × 10⁵ erythroblasts/mL to 1.2 × 10⁶ erythroblasts/mL. (B) Fold increase in FVA erythroblasts of adherent erythroblasts in cocultures ( ), nonadherent erythroblasts in cocultures (■), and in control cultures (○). Results are the means plus or minus SE from 24 separate experiments; increased accumulations of erythroblasts in cocultures compared with control cultures were significant (*P < .001) at all times after 6 hours.
Increased accumulation of erythroid cells during differentiation in cocultures requires direct interaction between macrophages and erythroid cells
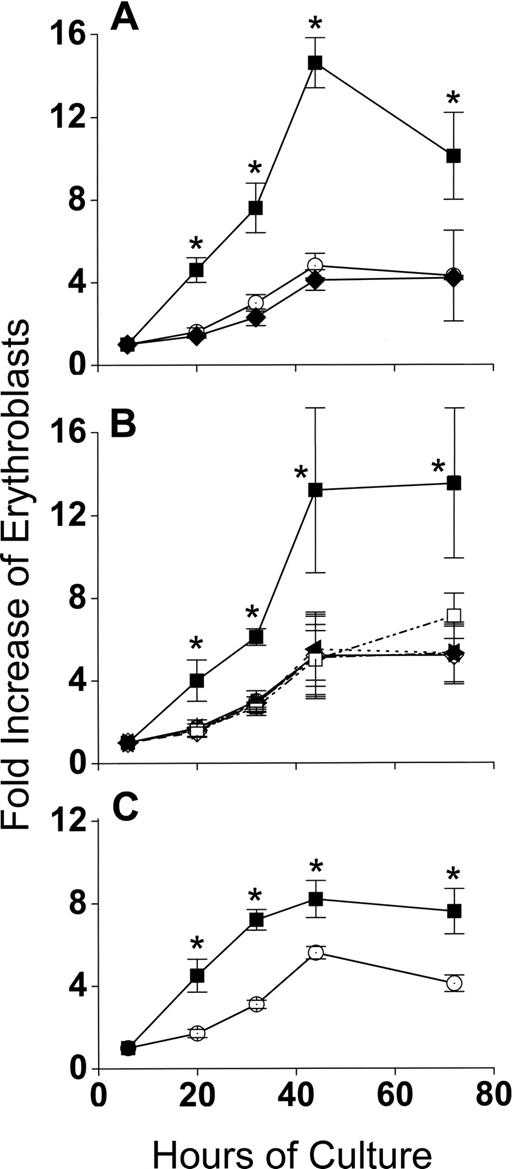
Production of 3-fold more cells in cocultures compared with control cultures during 44 hours of erythroid differentiation had at least 3 possible causes other than a direct interaction between macrophages and erythroblasts: (1) binding to macrophages selected for a subset of CFU-E/proerythroblasts that could increase their numbers more readily during differentiation, irrespective of whether they remained adherent to macrophages, (2) a cytokine(s) secreted by the macrophages enhanced erythroblast accumulation in cocultures, and (3) FVA infection somehow enhanced accumulation of erythroblasts in cocultures. Figure 3 shows that none of these possibilities accounted for the increased accumulation of erythroid cells in cocultures. In Figure 3A, 6-hour adherent erythroblasts were detached by ice-cold PBS-EDTA and ice-cold PBS washing. These previously adherent CFU-E/proerythroblasts were then cultured alone as described for control erythroblasts that had never been exposed to macrophages. In Figure 3A, erythroblast accumulations in cultures of formerly adherent erythroblasts were the same as erythroblasts in control cultures (P = .1-.47), rather than the increased accumulations of adherent erythroblasts that remained in cocultures (P < .001-.002). In Figure 3B, addition of various concentrations of medium conditioned by macrophages cultured alone did not increase accumulation of erythroid cells compared with the same cells in coculture (P = .25-.5). Similar results were found with various concentrations of medium conditioned by cocultures of macrophages and erythroblasts (data not shown). In Figure 3C, cocultures of splenic macrophages and erythroblasts from bled mice had 2-fold increased accumulations of erythroblasts compared with erythroblasts cultured alone. These results were less dramatic than those found with macrophages and erythroblasts from FVA-infected spleens. This difference results from phlebotomy inducing a high EPO state8 that yields a less homogeneous proerythroblast population containing more mature cells with less proliferative potential than the more homogeneous CFU-E/proerythroblasts with higher proliferative potential that are isolated from FVA-infected mice with their normal EPO levels.6 Despite this decreased proliferative potential, erythroblasts from bled mice had significantly greater accumulation of cells in cocultures than in erythroblasts cultured alone (P < .05 at all times), indicating that FVA infection was not responsible for increased accumulation of erythroblasts found in cocultures with macrophages.
The enhanced proliferation of erythroblasts in cocultures requires direct contact with macrophages and is unrelated to FVA infection. (A) Effect of removing adherent erythroblasts from macrophages on their fold increase in subsequent culture. indicates adherent erythroblasts cultured in cocultures; , control erythroblasts cultured alone; , adherent erythroblasts removed from macrophages and recultured alone. Adherent erythroblast accumulations in coculture were significantly greater at all times than control erythroblasts or formerly adherent erythroblasts that were cultured alone (*P < .002). (B) Effect of macrophage-conditioned medium at various concentrations (○, 0%; ◇, 8%; ◀, 16%; ▶, 30%; □, 60%) on fold increase in total erythroblasts cultured alone; erythroblasts cocultured with macrophages (■). Erythroblasts in cocultures accumulated to significantly greater numbers than in any concentration of conditioned medium (*P < .05). (C) Fold increase in splenic erythroblasts of bled mice, cocultured with splenic macrophages (■), and cultured alone as controls (○). Data are means plus or minus SE of 3 separate experiments for each part; no significant increases above controls were found for formerly adherent erythroblasts cultured alone (P < .1-.47) or erythroblasts cultured with any concentration of macrophage-conditioned medium (P < .25-.5), whereas erythroblasts from bled mice were always increased significantly in cocultures compared with controls (*P < .004-.4).
The enhanced proliferation of erythroblasts in cocultures requires direct contact with macrophages and is unrelated to FVA infection. (A) Effect of removing adherent erythroblasts from macrophages on their fold increase in subsequent culture. indicates adherent erythroblasts cultured in cocultures; , control erythroblasts cultured alone; , adherent erythroblasts removed from macrophages and recultured alone. Adherent erythroblast accumulations in coculture were significantly greater at all times than control erythroblasts or formerly adherent erythroblasts that were cultured alone (*P < .002). (B) Effect of macrophage-conditioned medium at various concentrations (○, 0%; ◇, 8%; ◀, 16%; ▶, 30%; □, 60%) on fold increase in total erythroblasts cultured alone; erythroblasts cocultured with macrophages (■). Erythroblasts in cocultures accumulated to significantly greater numbers than in any concentration of conditioned medium (*P < .05). (C) Fold increase in splenic erythroblasts of bled mice, cocultured with splenic macrophages (■), and cultured alone as controls (○). Data are means plus or minus SE of 3 separate experiments for each part; no significant increases above controls were found for formerly adherent erythroblasts cultured alone (P < .1-.47) or erythroblasts cultured with any concentration of macrophage-conditioned medium (P < .25-.5), whereas erythroblasts from bled mice were always increased significantly in cocultures compared with controls (*P < .004-.4).
Accumulation of erythroblasts in cocultures with macrophages is increased at all EPO concentrations
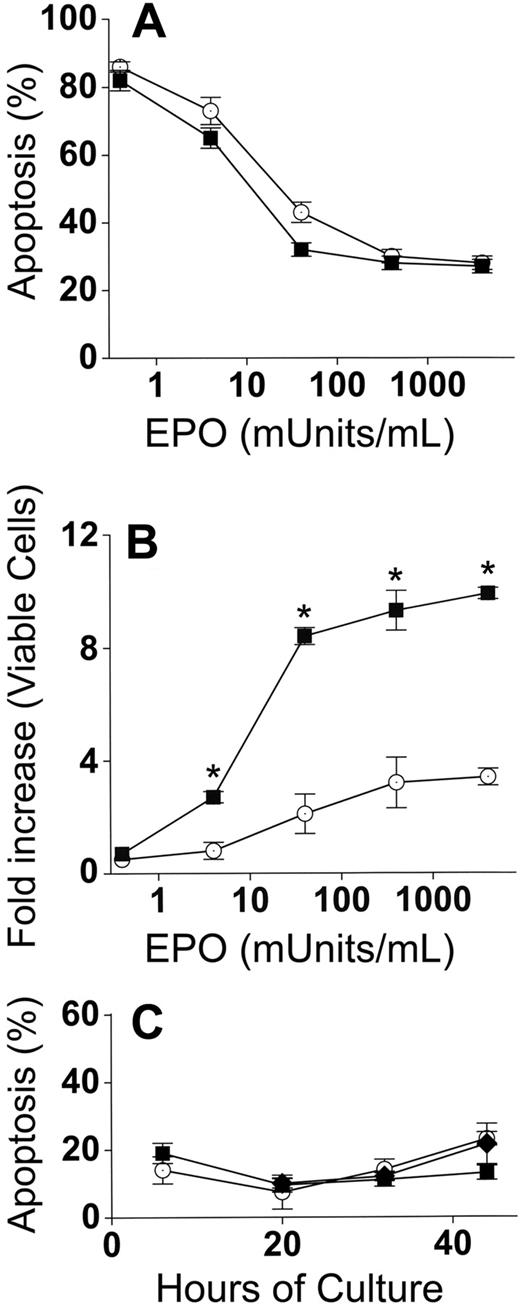
Because EPO is the major determinant of erythroblast numbers during differentiation in vivo, control and cocultures were performed with EPO concentrations ranging from no added EPO to 4000 mU/mL EPO. These EPO concentrations essentially cover the entire range found in physiologic and pathologic conditions in vivo. EPO deprivation leads to erythroblast death by apoptosis, and apoptosis percentages were similar (P = .2-.9) for both adherent and nonadherent erythroblasts in cocultures with macrophages and control erythroblasts (Figure 4A). Increased accumulation of erythroblasts in coculture with macrophages compared with control cultures was maintained (P < .05) at all concentrations of EPO except for the lowest concentration (no added EPO, P = .2) at which apoptosis was extremely prevalent and allowed for very little accumulation of erythroblasts (Figure 4B).
Increased accumulation of erythroblasts in cocultures with macrophages occurs at all EPO concentrations. (A) Percentages of apoptotic (TUNEL-positive) cells at 44 hours after culture in various concentrations of EPO. In cocultures, apoptosis percentages for adherent and nonadherent erythroblasts were the same at all concentrations of EPO, and totals of both populations (■) are shown; control erythroblasts (○). (B) Fold increases of total viable erythroblasts in cocultures (adherent + nonadherent) (■) and viable control erythroblasts (○) from 6 hours to 44 hours at various EPO concentrations. Increased erythroblast accumulations in cocultures compared with controls were significant at all added EPO concentrations (*P < .05). (C) Erythroblasts at various times of culture were analyzed by TUNEL assays for percentage of apoptotic cells: adherent erythroblasts (■), nonadherent erythroblasts (♦), control erythroblasts (○). Results are the means plus or minus SE from 3 separate experiments in each part.
Increased accumulation of erythroblasts in cocultures with macrophages occurs at all EPO concentrations. (A) Percentages of apoptotic (TUNEL-positive) cells at 44 hours after culture in various concentrations of EPO. In cocultures, apoptosis percentages for adherent and nonadherent erythroblasts were the same at all concentrations of EPO, and totals of both populations (■) are shown; control erythroblasts (○). (B) Fold increases of total viable erythroblasts in cocultures (adherent + nonadherent) (■) and viable control erythroblasts (○) from 6 hours to 44 hours at various EPO concentrations. Increased erythroblast accumulations in cocultures compared with controls were significant at all added EPO concentrations (*P < .05). (C) Erythroblasts at various times of culture were analyzed by TUNEL assays for percentage of apoptotic cells: adherent erythroblasts (■), nonadherent erythroblasts (♦), control erythroblasts (○). Results are the means plus or minus SE from 3 separate experiments in each part.
The results in Figure 4A,B were all performed at 44 hours of culture. A significant proportion of the 20% apoptosis as measured by TUNEL assay at 44 hours is largely the result of disintegration of DNA in the small percentages of nuclei that were extruded at earlier times of culture (36-40 hours). To ensure that coculture with macrophages did not prevent apoptosis of adherent erythroblasts at earlier times of culture, TUNEL assays were performed at 6, 20, 32, and 44 hours of culture with 4000 mU/mL of EPO (Figure 4C). No significant differences in apoptosis percentages were found between control erythroblasts and cocultures at any time of culture (P = .1-.5).
Erythroblasts cocultured with macrophages have higher percentages of cells in active cell cycle
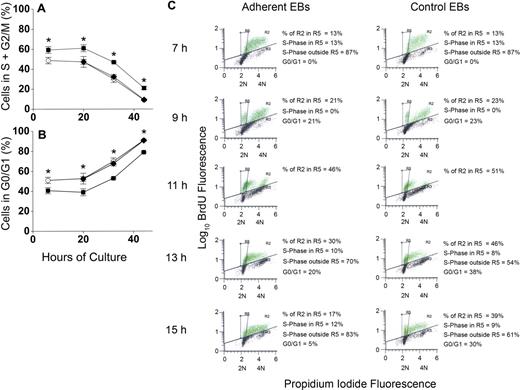
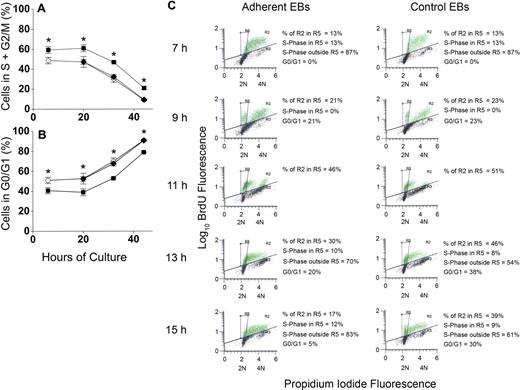
To determine whether increased percentages of erythroblasts in proliferative phases of the cell cycle could account for increased accumulation of erythroblasts in macrophage cocultures, erythroblasts were analyzed for apoptosis by TUNEL staining and for cell- cycle phase by propidium iodide staining for total DNA content. This dual staining technique permitted evaluation of cell cycle of the viable cells. At 6 hours and through 20 hours of coculture, approximately 60% of viable adherent erythroblasts were in the S + G2/M phases of cell cycle, whereas only 45% of viable control erythroblasts were in these proliferative phases (Figure 5A). At later times of coculture and control culture, percentages of S + G2/M phase cells decreased for both adherent erythroblasts and control erythroblasts, but the adherent percentages were always approximately 15% higher than controls (P < .007 at all times). Nonadherent erythroblasts generated in cocultures had similar percentages as control cells (P = .1-.4) at each time examined (Figure 5A). Figure 5B shows percentages of viable cells in the G0/G1 phase of cell cycle. After 20 hours of culture, the proportion of erythroblasts in the G0/G1 phase increases in both cocultures and control cultures. At these later times, the orthochromatic erythroblasts do not enter S-phase because they stop dividing.10,13
Adherence to macrophages in coculture increases proliferation of erythroblasts by decreasing G0/G1 transit time. (A) Percentages of nonapoptotic erythroblasts in the S + G2/M phases of cell cycle and (B) percentages of nonapoptotic erythroblasts in the G0/G1 phases of cell cycle; adherent erythroblasts (■), nonadherent erythroblasts (♦), control erythroblasts (○). Results are the means plus or minus SE of 3 separate experiments; increased adherent erythroblasts in S + G2/M and decreased adherent erythroblasts in G0/G1 compared with controls and nonadherent erythroblasts were significant at all times (*P < .007). (C) BrdU pulse-chase labeling for determination of cell cycle phases. From 6 hours to 7 hours of incubation, cocultured and control erythroblasts (EBs) were pulse-labeled with 25 μg/mL of BrdU, washed with ECM, and “chased” with normal medium. Green dots indicate BrdU-labeled erythroblasts; black dots, unlabeled erythroblasts. Incorporated BrdU was detected by fluorescein isothiocyanate-conjugated antibodies and total DNA content detected by propidium iodide staining (2N and 4N DNA content are shown on x-axes). In the experiment shown, 63% of adherent erythroblasts and 49% of control erythroblasts labeled with BrdU. The box designated R5 was constructed to demarcate the BrdU-labeled erythroblasts in G0/G1 phase of cell cycle as described in the text.
Adherence to macrophages in coculture increases proliferation of erythroblasts by decreasing G0/G1 transit time. (A) Percentages of nonapoptotic erythroblasts in the S + G2/M phases of cell cycle and (B) percentages of nonapoptotic erythroblasts in the G0/G1 phases of cell cycle; adherent erythroblasts (■), nonadherent erythroblasts (♦), control erythroblasts (○). Results are the means plus or minus SE of 3 separate experiments; increased adherent erythroblasts in S + G2/M and decreased adherent erythroblasts in G0/G1 compared with controls and nonadherent erythroblasts were significant at all times (*P < .007). (C) BrdU pulse-chase labeling for determination of cell cycle phases. From 6 hours to 7 hours of incubation, cocultured and control erythroblasts (EBs) were pulse-labeled with 25 μg/mL of BrdU, washed with ECM, and “chased” with normal medium. Green dots indicate BrdU-labeled erythroblasts; black dots, unlabeled erythroblasts. Incorporated BrdU was detected by fluorescein isothiocyanate-conjugated antibodies and total DNA content detected by propidium iodide staining (2N and 4N DNA content are shown on x-axes). In the experiment shown, 63% of adherent erythroblasts and 49% of control erythroblasts labeled with BrdU. The box designated R5 was constructed to demarcate the BrdU-labeled erythroblasts in G0/G1 phase of cell cycle as described in the text.
To determine how adherent cells achieved increased proliferation, BrdU pulse-chase experiments were performed. Adherent and control erythroblast populations were pulse-chase labeled at 6 hours as described under “Measurement of cell cycle with pulse-chase of bromodeoxyuridine.” Aliquots of erythroblasts were examined by flow cytometry at 7 hours and at 2-hour intervals thereafter for BrdU fluorescence to detect erythroblasts in S-phase during the pulse and for propidium iodide fluorescence to determine cell-cycle phase at the time each aliquot was taken.
Figure 5C shows a representative pulse-chase experiment for the period 7 hours to 15 hours in adherent erythroblasts from cocultures and control erythroblasts. Because pulsing, washing, and reculturing at 6 hours required approximately 1 hour, the 7-hour time point represented “pulsed” erythroblasts without any chase. Those 7-hour erythroblasts with BrdU fluorescence (green dots in Figure 5C histograms) were all in S-phase because BrdU incorporation during the pulse period is restricted to cells in DNA synthesis. The distribution of total DNA in BrdU-labeled 7-hour erythroblasts extended between 2N and 4N. However, because of the Gaussian nature of these distributions, the total DNA distribution of some erythroblasts in the earliest stages of S-phase slightly overlapped with the Gaussian distribution of 2N erythroblasts in G0/G1 phase seen in later samples of the chase period. Therefore, overlap between G0/G1 phase and S-phase erythroblasts was determined. By 9 hours (2 hours of chase), some erythroblasts had undergone mitosis, yielding distinct G0/G1 populations (Figure 5C). The 2 sets of BrdU-labeled cells, those in late S-phase + G2/M and those in G0/G1, were sufficiently separated in total DNA content at 9 hours that a template box demarcating the location of the G0/G1 cells in both adherent and nonadherent erythroblast histograms was easily drawn (designated as R5). This same R5 box was then applied to all histograms.
At 7 hours, when 100% of BrdU-labeled erythroblasts were in S-phase, 13% of adherent and 13% of control erythroblasts were in the R5 box (Figure 5C). By 9 hours (2 hours of chase time), nearly equal percentages of the BrdU-labeled populations (21% of adherent and 23% of control erythroblasts) had progressed through G2/M into G0/G1 phase (Figure 5C). By 13 hours and 15 hours of culture, BrdU-labeled erythroblasts were either in G0/G1 or had entered a second S-phase. The G0/G1 populations at 13 hours and 15 hours were calculated from total percentage of cells in the R5 box minus the percentages of BrdU-labeled erythroblasts that overlapped from S-phase (see Figure S1 for calculations, available on the Blood website; see the Supplemental Materials link at the top of the online article). By 13 hours, 38% of BrdU-labeled control erythroblasts remained in G0/G1 phase, whereas only 20% of adherent erythroblasts remained there (Figure 5C). By 15 hours, 30% of control erythroblasts but only 5% of adherent erythroblasts remained in G0/G1 phase (Figure 5C). Although not shown, results for nonadherent erythroblasts produced in cocultures were similar to controls, including 13-hour and 15-hour accumulations in G0/G1 phase. Thus, relative to adherent erythroblasts, control erythroblasts and nonadherent erythroblasts in cocultures had prolonged G0/G1 phases.
Coculture with macrophages does not affect differentiation of erythroblasts
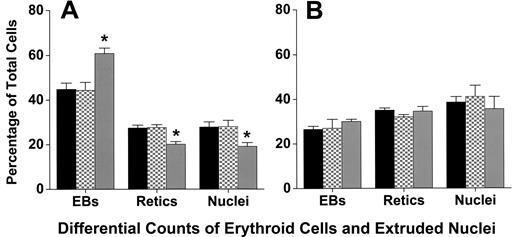
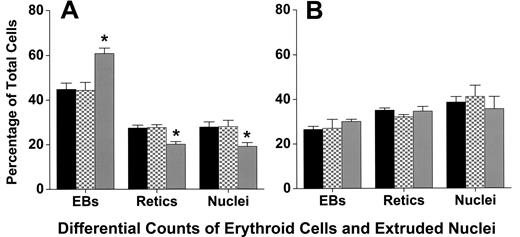
Cytocentrifuge preparations revealed that coculture with macrophages did not affect the differentiation or the percentage of cells that achieve enucleation to form reticulocytes. At 6, 20, 32, 44, and 72 hours of culture, staining of cells with 3,3′-dimethoxybenzidine and hematoxylin was similar, indicating similar hemoglobinization (Figure 1). A lower percentage of adherent erythroblasts in coculture had enucleated at 44 hours of culture compared with either nonadherent erythroblasts (P < .001) or control erythroblasts (P < .001; Figure 6A), but by 72 hours these percentages were similar (P = .4; Figure 6B). This delay in enucleation is most likely the result of fewer adherent erythroblasts achieving the G0 state, from which erythroblasts enucleate, by 44 hours of culture. However, the numbers of adherent erythroblasts were extremely small compared with the nonadherent erythroblasts at 72 hours (Figure 2B).
Adherent erythroblasts in cocultures have slightly delayed enucleation compared with nonadherent and control erythroblasts. Differential counts of control (■), nonadherent (▩), and adherent (▒) erythroblasts (EBs) were determined as percentages of total erythroid cell elements (erythroblasts + reticulocytes + extruded nuclei) in cultures as described under “Assessment of differentiation and enucleation.” Counts were made with (A) 44-hour cultures and (B) 72-hour cultures. Results are means plus or minus SE from 7 separate experiments; decreased enucleation of adherent erythroblasts was significant at 44 hours (*P < .001), but not at 72 hours (P = .4).
Adherent erythroblasts in cocultures have slightly delayed enucleation compared with nonadherent and control erythroblasts. Differential counts of control (■), nonadherent (▩), and adherent (▒) erythroblasts (EBs) were determined as percentages of total erythroid cell elements (erythroblasts + reticulocytes + extruded nuclei) in cultures as described under “Assessment of differentiation and enucleation.” Counts were made with (A) 44-hour cultures and (B) 72-hour cultures. Results are means plus or minus SE from 7 separate experiments; decreased enucleation of adherent erythroblasts was significant at 44 hours (*P < .001), but not at 72 hours (P = .4).
Discussion
Erythroblastic islands reconstituted with macrophages and developmentally synchronized CFU-E/proerythroblasts of FVA-infected mice demonstrated a 3-fold enhancement of erythroblast proliferation compared with the same erythroblasts cultured alone (Figure 2A). These results are consistent with recent findings that macrophages in reconstituted erythroblastic islands promoted retention of CFU-E capacity.14 Much of the enhanced erythroblast proliferation in the reconstituted erythroblastic islands occurred during the first 24 hours of coculture when erythroid cells are dependent on EPO to prevent their apoptosis. However, enhancement of erythroid cell proliferation in the reconstituted islands occurred at all EPO concentrations, and no differences in apoptosis were found when cocultured erythroid cells were compared with control erythroid cells cultured alone. Thus, production of red blood cells can be regulated by at least 2 different mechanisms: erythroblast proliferation related to contact with macrophages in erythro-blastic islands and erythroblast survival related to prevention of apoptosis by EPO.
Enhanced proliferation of adherent erythroblasts in reconstituted erythroblastic islands was associated with reduced transit time of G0/G1 phase compared with control erythroblasts (Figures 5C,S1) and nonadherent erythroblasts in cocultures. Direct contact of erythroblasts with macrophages, as shown by Figure 3A,B, was required for enhanced proliferation, indicating that a surface protein(s) on the macrophage may be responsible for inducing the change in cell-cycle dynamics. Known mediators of macrophage-erythroblast adhesion are candidate inducers of enhanced proliferation. These macrophage surface proteins include: (1) vascular cell adhesion molecule 1 that binds α4β1 integrin on erythroblasts,15 (2) αV component of integrins that binds interstitial cell adhesion molecule 4 on erythroblasts,16 (3) erythroblast-macrophage protein that binds to itself on erythroblasts in a homophilic reaction,5,17 (4) sialoadhesin (CD169; Siglec-1) that binds sialated glycoproteins on erythroblasts,18 and (5) CD163, the receptor for hemoglobin-haptoglobin complexes that binds an unknown protein on erythroblasts.19 One of these macrophage proteins may enhance proliferation of adherent erythroblasts, but a complex of the proteins may be required because antibodies to just one of these proteins can disrupt macrophage-erythroblast binding,15-19 suggesting the individual proteins may associate into complexes.
Three other proteins found on the surface of stromal macrophages have been associated with enhanced proliferation of erythroid progenitor cells: (1) c-kit ligand (stem-cell factor), a transmembrane protein that binds c-kit (stem-cell factor receptor) on erythroid cells. At the CFU-E stage, c-kit, a member of the receptor tyrosine kinase (RTK) family, acts as an erythroid proliferative factor.20 (2) Ephrin-2 (HTK ligand), an intrinsic membrane protein, binds its receptor EphB4 (HTK) on erythroid cells in CFU-E stages21 and induces proliferation.22 (3) Bone morphogenic protein 4 (BMP4), a member of the transforming growth factor-β (TGF-β) family, stimulates erythroid cell proliferation during stress erythropoiesis.23 Although BMP4 is secreted, it does not diffuse in interstitial fluid and remains closely associated with the surface of the producing cell.24
Whether the number of adherent erythroblasts per macrophage in vivo is the same as in the islands reconstituted in vitro is uncertain. In addition, erythroblast–macrophage adherence may be a dynamic process with erythroblasts repeatedly binding to and releasing from macrophages. The maximum accumulation of adherent erythroblasts in Figure 2B at 32 hours suggests that erythroblasts can remain attached throughout the period of rapid erythroid proliferation, that is, through the polychromatophilic stage of differentiation. However, the proliferating erythroblasts (pro-erythroblasts and basophilic erythroblasts) found in the nonadherent erythroblast population at earlier times of coculture demonstrate that release from macrophages is not simply a matter of differentiation stage.
Interactions between erythroblasts may be important in erythroid development, and erythroblasts in the reconstituted islands are closer to each other than in suspension cultures. However, enhanced proliferation in reconstituted islands appears to require macrophages because erythroblast proliferation at much higher concentrations (1-4 × 10⁶/mL) in the standard FVA culture system6,7,10,12,13 is the same as in control cultures here. The 3-fold enhancement of erythroblast proliferation in macrophage cocultures represents between one and 2 additional cell divisions at a late time in erythropoiesis. Such an increase in erythroblast proliferative capacity can provide a large difference in total numbers of erythrocytes that can be produced in vivo.
The importance of macrophages for erythropoiesis has been demonstrated in mice where chemical depletion of splenic macrophages prevents the erythropoietic response to blood loss.25 Two diseases in which macrophages appear to play important roles are the anemias of chronic inflammation and myelodysplasia. In chronic inflammation, hepcidin impairs export of stored iron from macrophages, thereby limiting erythropoiesis.26 Early studies suggested that macrophages might transfer iron directly to adherent erythroblasts,27 but almost all iron released from macrophages and incorporated into erythroid cells is carried on transferrin, with direct nontransferrin supply of iron from macrophages to erythroblasts being very slight.28 Suppression of erythropoiesis has been associated with cytokines in bone marrow of patients with chronic inflammation.29 Bone marrow macrophages from myelodysplasia patients produced high levels of tissue necrosis factor-α (TNF-α).30 TNF-α inhibits CFU-E/proerythroblasts by retarding proliferation rather than inducing apoptosis.31 Thus, in chronic inflammation and myelodysplasia, the enhanced proliferative effect of macrophages on erythroblasts may be reduced by TNF-α. Suppression of enhanced erythroblast proliferation in the anemia of chronic inflammation is also consistent with the anti-inflammatory corticosteroid dexamethasone increasing bone marrow macrophage binding of fetal liver erythroblasts in reconstructed erythroblastic islands.18
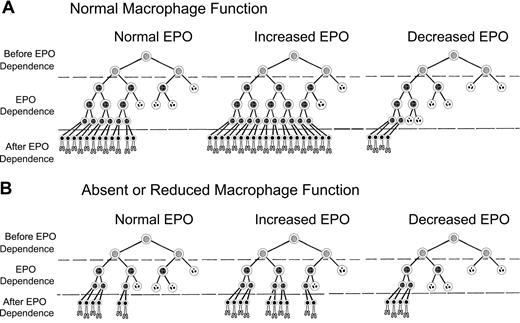
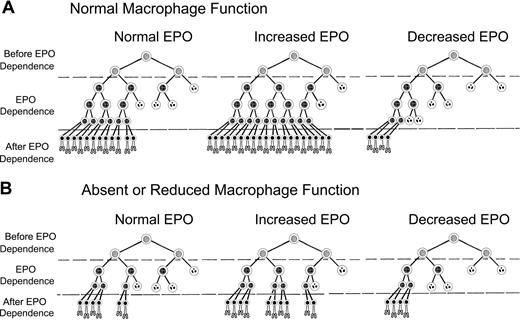
Decreased production of erythrocytes and “EPO resistance” found in anemias of chronic inflammation or myelodysplasia can be partially explained by a modification of our previously proposed model of EPO-mediated control of erythrocyte production. Figure 7 shows a modified version of this model, which incorporates enhanced erythroblast proliferation by macrophages.32 In Figure 7A, erythrocyte production with normal macrophage numbers and function depends on survival of erythroid progenitor cells in EPO-dependent stages of differentiation, that is, CFU-E and early stage erythroblasts. EPO sensitivity of EPO-dependent cells is heterogeneous,33 with cells requiring the least EPO to survive on the left and those requiring the most EPO to survive on the right in each scheme in Figure 7. In Figure 7A, normal plasma EPO concentrations permit survival of sufficient EPO-dependent erythroblasts so that the numbers of reticulocytes produced each day offset the normal daily loss of 1% of circulating erythrocytes to senescence. After blood loss or hemolysis, plasma EPO concentrations rise and EPO-dependent erythroblasts that normally undergo apoptosis because they require greater than normal amounts of EPO will survive and generate increased reticulocytes. Conversely, in renal failure or other states of decreased EPO production, many EPO-dependent erythroblasts that survive with normal EPO concentrations undergo apoptosis, producing diminished numbers of reticulocytes.
Model of erythropoiesis based on erythropoietin (EPO) suppression of erythroblast apoptosis and macrophage enhancement of erythroblast proliferation. In the CFU-E and early erythroblast stages, erythroid progenitor cells become dependent on EPO for prevention of apoptosis (EPO Dependence). Before the EPO-dependent period, the erythroid progenitors survive without EPO (Before EPO Dependence). Cells surviving transit through the EPO-dependent period (After EPO Dependence) complete one cell division and enucleate becoming reticulocytes (bottom rows of cells). EPO-dependent cells are heterogeneous, with the most dependent cells on the right side of each diagram and least dependent cells on the left. Surviving cells are indicated by intact nuclei, whereas cells undergoing apoptosis from insufficient EPO are indicated by fragmented nuclei. Although the actual number of EPO-dependent generations is unknown, 3 generations of EPO-dependent progenitors are shown for normal macrophage numbers and function (A), and 2 generations are shown for absent or decreased macrophage function (B).
Model of erythropoiesis based on erythropoietin (EPO) suppression of erythroblast apoptosis and macrophage enhancement of erythroblast proliferation. In the CFU-E and early erythroblast stages, erythroid progenitor cells become dependent on EPO for prevention of apoptosis (EPO Dependence). Before the EPO-dependent period, the erythroid progenitors survive without EPO (Before EPO Dependence). Cells surviving transit through the EPO-dependent period (After EPO Dependence) complete one cell division and enucleate becoming reticulocytes (bottom rows of cells). EPO-dependent cells are heterogeneous, with the most dependent cells on the right side of each diagram and least dependent cells on the left. Surviving cells are indicated by intact nuclei, whereas cells undergoing apoptosis from insufficient EPO are indicated by fragmented nuclei. Although the actual number of EPO-dependent generations is unknown, 3 generations of EPO-dependent progenitors are shown for normal macrophage numbers and function (A), and 2 generations are shown for absent or decreased macrophage function (B).
In Figure 7B, all cells of the third generation in Figure 7A are absent because they are not generated because of absent or decreased macrophage function. Our results suggest that between one and 2 generations can be lost with absent or decreased macrophage function; therefore, the effects in Figure 7B may be greater than shown. Thus, in Figure 7B, absent or decreased macrophage function decreases the total number of EPO-dependent erythroid cells that can respond to EPO. In turn, these decreased EPO-dependent erythroid cells in Figure 7B reduce the number of reticulocytes produced at each EPO level compared with Figure 7A with normal macrophage function. This relatively decreased reticulocyte production resulting from absent or decreased macrophage function is prominent at high EPO levels, intermediate at normal EPO levels, and slight at low EPO levels.
In Figure 7A, with normal EPO and normal macrophage function, 24 reticulocytes are produced. When EPO is increased and macrophage function remains normal, 40 reticulocytes are produced. However, in Figure 7B, when EPO is increased but macrophage function is absent or decreased, only 20 reticulocytes are produced. Thus, despite increased EPO levels, fewer than normal reticulocytes are produced when macrophage function is absent or decreased. This lower than normal reticulocyte production despite increased EPO levels occurs in patients with the underproduction anemias of chronic inflammation and myelodysplasia. When patients with impaired macrophage function also have decreased EPO production, administration of exogenous EPO may increase reticulocyte production. However their reduced number of EPO-dependent cells resulting from impaired macrophage function requires larger EPO doses to achieve the same reticulocyte production as patients with renal failure who also have decreased EPO levels but whose normal macrophage function provides more EPO-dependent cells with which to respond to EPO.
The online version of this article contains a data supplement.
The publication costs of this article were defrayed in part by page charge payment. Therefore, and solely to indicate this fact, this article is hereby marked “advertisement” in accordance with 18 USC section 1734.
Acknowledgments
This work was supported by National Institutes of Health grants K08DK077056 (M.M.R.) and T32 HL07751, and the Vanderbilt Physician Scientist Development Program.
Authorship
Contribution: M.M.R. designed and performed experiments, analyzed data, and wrote the manuscript; P.K. performed experiments and helped write the manuscript; M.C.B. designed and performed experiments and helped write the manuscript; J.O.P. analyzed and interpreted data and helped write manuscript; M.K. designed and performed experiments, interpreted data, and wrote the manuscript.
Conflict-of-interest disclosure: The authors declare no competing financial interests.
Correspondence: Mark J. Koury, Veterans Administration Tennessee Valley Healthcare System, 1310 24th Avenue South, Nashville, TN 37212; e-mail: mark.koury@vanderbilt.edu.





 ), nonadherent erythroblasts in cocultures (■), and in control cultures (○). Results are the means plus or minus SE from 24 separate experiments; increased accumulations of erythroblasts in cocultures compared with control cultures were significant (*P < .001) at all times after 6 hours.