In the present study, we examined the role in hematopoiesis of cationic amino acid transporter 1 (CAT1), which transports l-arginine, l-lysine, l-ornithine, and l-histidine. The expression level of human CAT1 (hCAT1) mRNA in mononuclear cells (MNCs) fractionated according to lineage-selective markers was examined by reverse transcriptase-polymerase chain reaction. The expression of CAT1 in glycophorin A-positive erythroid cells was 8 times higher than in nonfractionated MNC (control) cells. Characteristics of l-arginine uptake by K562 cells, an established leukemic cell line used as an erythroid model, were similar to those of CAT1 in regards to saturation kinetics, sodium independence, and substantial inhibition of l-arginine uptake by N-ethylmaleimide, which is a specific inhibitor of system y+ amino acid transporter. Removal of l-arginine from the culture medium prevented both proliferation and differentiation of K562 cells, while removal of l-lysine or l-histidine had little effect on differentiation, though proliferation was blocked. Hematopoietic stem cells obtained from human cord blood failed to develop into erythroid cells in the absence of l-arginine in the culture medium. These findings indicate that hCAT1 is involved in erythroid hematopoiesis through its role in importing l-arginine, which appears to be essential for the differentiation of red blood cells.
Introduction
Cytokines such as interleukin-3 (IL-3) and erythropoietin play an important role in the differentiation of hematopoietic stem cells.1,2 However, the roles of small molecules such as vitamins, nucleic acids, and amino acids in cell differentiation have not been elucidated well, though it is likely that specific transporters are involved in importing such small hydrophilic molecules into the cells. The ABC transporter Bcrp1 (abcg2) is expressed mainly in hematopoietic stem cells,3 and more recently, efflux transporter activities in murine hematopoietic stem cells (HSCs) were found to vary according to developmental and activation status.4 Thiamine transporter Thtr-1 (slc19a2) gene knockout mice showed abnormalities of erythroid, myeloid, and megakaryocyte lineages in bone marrow when fed a thiamine-free diet.5 The importance of CAT1 (cationic amino acid transporter)-mediated transport was recently underscored by the production of cat1 gene knockout mice, which exhibit anemia.6 These reports indicate that substrates of transporters expressed on hematopoietic stem cells are physiologically essential in differentiation or proliferation of the cells, or both, and the expression levels and activities of these transporters are likely to be regulated stage and lineage specifically.
Cationic amino acid transporter (CAT, slc7a), known as system y+, transports cationic amino acids such as l-lysine, l-histidine, l-ornithine, and l-arginine.7-9 System y+ is a facilitative process that is Na+-independent and pH insensitive. CAT1 (slc7a1), whose mouse ortholog was first identified as a virus receptor,10,11 is expressed ubiquitously, including fetal liver and bone marrow, though not adult liver.12 It is known that fetal and embryonic liver plays a significant role in hematopoiesis.13 Furthermore, CAT1 mRNA is induced in regenerating liver in a short-lived manner and has multiple sites for regulation of gene expression, indicating that system y+ is tightly regulated and essential for liver cells to enter mitosis.14,15 These findings suggest that CAT1 could be involved in hematopoietic activity.
One of the substrates of CAT1, l-arginine, is a precursor of nitric oxide (NO) and polyamines. NO can induce apoptosis in megakaryocytes and platelet formation.16,17 l-ornithine is produced by arginase and further metabolized to polyamines, which regulate the cell cycle.18 Recently, low concentrations of l-glutamine were reported to induce functional differentiation of U937 myelomonocytic cells.19 These facts suggest that low-molecular-weight molecules such as amino acids may be involved in hematopoiesis, as well as large-molecular cytokines such as IL-3 and erythropoietin. In the present study, we investigated the effects of hCAT1 expression level and l-arginine on differentiation and proliferation of human cord blood cells and a cloned human erythroid model, K562 cells.
Materials and methods
Tissue culture
The erythroleukemic cell line K562 was obtained from the American Type Culture Collection (Rockville, MD). K562 cells were cultured at an initial density of 2 × 10⁵ cells/mL in Dulbecco modified eagle medium (DMEM) supplemented with 100 mL/L heat-inactivated fetal bovine serum (Invitrogen, Carlsbad, CA). To investigate the effect of cationic amino acids on cell proliferation and differentiation, DMEM containing or not containing l-arginine, l-lysine, or l-histidine was used. The cells were maintained in a fully humidified air atmosphere containing 5% CO2 at 37°C.
Antibodies
Monoclonal antibodies against human glycophorin A were purchased from BD PharMingen (San Diego, CA). Goat anti-mouse IgG-coated immunomagnetic beads (Dynabeads M450 goat anti-mouse IgG) were purchased from Dynal (Great Neck, NY). Human CD34-positive cells were isolated using a CD34 Progenitor Selection System kit (Dynal). Fluorescein isothiocyanate (FITC)-conjugated anti-glycophorin A, -CD14, -CD33, -CD34, and -CD45 antibodies were purchased from Immunotech (Marseilles, France).
Isolation of hematopoietic cells
Umbilical cord blood was obtained from full-term deliveries after having obtained informed consent according to a protocol approved by the ethics committee of Nihon University School of Medicine. Cord blood was collected in bags containing heparin and processed within 24 hours. After separation over Ficoll Isopaque (1.077 g/mL), low-density mononuclear cells (MNCs) from cord blood were washed and suspended in IMDM (Iscove modified Dulbecco medium). Cell sorting was performed by using the above antibodies and immunomagnetic beads.
For the isolation of glycophorin A-positive human cord blood cells, we used an immunomagnetic cell separation method. MNCs obtained from human cord blood were incubated with anti-human glycophorin A for 30 minutes at 4°C. Then the cells were washed once with IMDM and treated with goat anti-mouse IgG-coated immunomagnetic beads (3 beads per cell, Dynal) for 30 minutes at 4°C. Cells positive for glycophorin A monoclonal antibody were rosetted with Dynabeads and were isolated with a magnet. For isolation of hematopoietic stem cells (CD34+ cells), a Dynal CD34 Progenitor Cell Selection System kit was used, and 1 × 10⁸ MNCs were incubated with 1 mL of Dynabeads M-450 CD34 (4 × 10⁸ beads) at 4°C with gentle tilt rotation for 30 minutes. Cells reactive with CD34 monoclonal antibody were isolated with a magnet and washed twice with IMDM. Then the cells were treated with 1 mL of DETACHaBEAD CD34 for 15 minutes at room temperature with gentle tilt rotation to detach the Dynabeads from the cells. Dynabeads were removed with a magnet, and released cells were collected by centrifugation. Cells were washed twice with IMDM and used for cell culture.
Cells isolated by immunomagnetic cell separation were resuspended in IMDM, and the viability of the cells thus obtained was between 96% and 98% as measured by the trypan blue dye exclusion.
Semiquantitative reverse transcriptase-polymerase chain reaction of CAT1 and expression levels of CAT2 and CAT3 mRNA in various blood cells
Total RNA from various blood cells after sorting was isolated with ISOGEN (Nippon Gene, Toyama, Japan). First-strand cDNA was prepared with Super Script II (Invitrogen). The conditions of polymerase chain reaction (PCR) for hCAT1 were as follows: 94°C for 30 seconds, 58°C for 30 seconds, and 74°C for 30 seconds, using Ex Taq DNA polymerase (Takara Bio, Shiga, Japan). The PCRs for human CAT1 (hCAT1), hCAT2, and hCAT3 were performed with the following specific primers: hCAT1 sense 5′ GCCATTGTCATCTCCTTCCTG 3′, hCAT1 antisense 3′ CAAACAGAGACGGCCTGATG 3′, hCAT2 sense 5′AACTTGCTTTTATGCCTTTGT 3′, hCAT2 antisense 3′ CTGCCTCTTACTCACTCTG 3′, hCAT3 sense 5′ TCCATTGTGATCTGCTTTTTGG 3′, and hCAT3 antisense 3′ CAGTGAGCAGCAACACGA 3′.
The fluorescence intensity of each band after staining with ethidium bromide was quantified by using a Light Capture device (Atto, Tokyo, Japan). For quantitative measurement of CAT1 mRNA, the amount of CAT1 was normalized to the fluorescence intensity of the band of G3PDH. Human G3PDH-specific primers were used (sense, ACTGCCAACGTGTCAGTGGTGGACCTGA; antisense, GGCTGGTGGTCCAGGGGTCTTACTCCTT).
Cycle numbers for PCR were confirmed to be within the range of linear amplification for quantitative analysis.
l-arginine uptake study
l-[2,3,4-3H]arginine (1517 GBq/mM/mmol) (Perkin Elmer, Boston, MA) was used to measure K562-associated uptake of l-arginine. All washes of the cells were done in Earle balanced salt solution (EBSS) containing 117 mM NaCl, 5 mM KCl, 0.8 mM MgSO4, 1.8 mM CaCl2, 1 mM NaH2PO4, and 5.5 mM glucose, adjusted to pH 7.4, except in the experiments where N-methyl D-glucamine chloride replaced sodium chloride (+Na+ EBSS; buffer A, -Na+ EBSS; buffer B). After washing and preincubation of the cells for 5 minutes in buffer, the transport study was initiated by the addition of buffer Acontaining [3H]-l-arginine, and transport was stopped by washing the cells twice with ice-cold buffer A, followed by rapid centrifugation (6500g, 3 minutes, 4°C) at the indicated time (3 minutes), except in the time course study. The cells were solubilized in 1 N NaOH, aliquots were added to scintillation fluid, and radioactivity was quantitated by liquid scintillation spectrometry. The protein concentration was measured by means of the Bio-Rad protein assay using bovine serum albumin as the standard.
For calculating the kinetic parameters (Km and Vmax), concentrations of 10, 50, 100, 200, 500, and 1000 μM l-arginine were used, while the concentration of labeled l-arginine was kept unchanged.
In vitro differentiation of CD34+ and CD34- cells
CD34+ cells or CD34- cells from human cord blood were cultured at the concentration of 1 × 10⁴ cells/mL or 2 × 10⁵ cells/mL, respectively, in DMEM supplemented with 10% fetal calf serum with or without l-arginine, under stimulation with recombinant human IL-3 (10 ng/mL; R&D Systems, Minneapolis, MN), stem cell factor (10 ng/mL, R&D Systems), and erythropoietin (4 U/mL, R&D Systems) for 10 days in a humidified incubator at 37°C and 5% CO2. The cells were collected, and cell surface antigen analysis was performed by flow cytometry (CytoACE-150, Japan Spectroscopic, Tokyo, Japan).
Butyrate treatment of K562 cells
Erythroid differentiation of K562 cells was induced by treatment with 2 mM sodium butyrate (Sigma, St Louis, MO). The K562 cells were seeded in 12-well plates at a density of 1 × 10⁵ cells/mL and incubated in culture medium for 96 hours. At 24-hour intervals, a 1 mL aliquot of the incubated cell suspension was collected, washed with an equal volume of phosphate-buffered saline (PBS), and centrifuged (100g, 3 minutes, 4°C). The cells were fixed on slides with methanol, counted, and dried. Smears of K562 cells were stained with 3,3′-dimethoxybenzidine and counterstained with Harris Hematoxylin.20 Slides were washed twice with PBS, and benzidine-positive cells were counted under a microscope.
Results
Expression of hCAT1, CAT2, and CAT3 mRNA in human blood cells
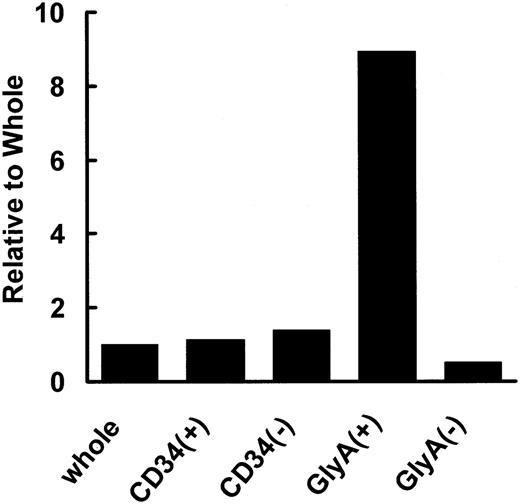
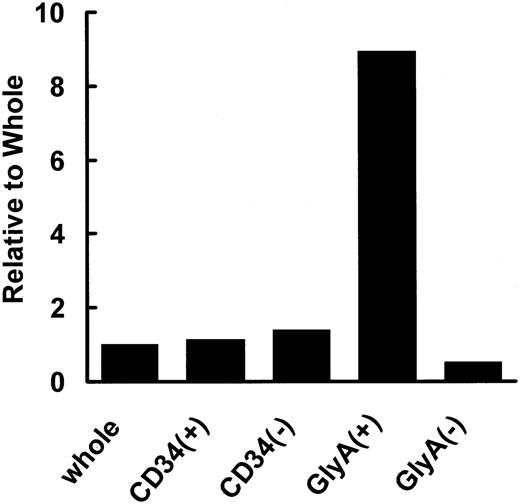
The expression of hCAT1, hCAT2, and hCAT3 mRNAs was examined in nuclear cells isolated with the aid of antibodies against cell differentiation-specific markers. Mononuclear cells from human cord blood were sorted by using antibodies against surface antigens glycophorin A and CD34. Figure 1 shows the expression level of CAT1 in each cell fraction relative to that of nonfractionated (whole) MNCs after normalization with respect to the expression of G3PDH. Since the expression of hCAT2 and hCAT3 was negligible in all cells, these results are not shown. As can be seen in Figure 1, hCAT1 was detected in all cell types, and its expression was about 8 times higher in glycophorin A-positive cells than in nonfractionated MNCs (control).
Uptake study of l-arginine by K562 cells
[3H]-l-arginine was time-dependently taken up by K562 cells in both buffer A and buffer B up to 20 minutes (Figure 2A). The C/M (cell-medium) ratio was as large as 200 μL/mg protein at 5 minutes after the initiation of uptake and amounted to about 400 μL/mg protein by 20 minutes. The uptake rate was examined at 3 minutes and was evaluated as a function of l-arginine concentration in the range of 10 to 1000 μM. The result is shown in Figure 2B. Saturation was observed at around 50 μM. The Km and Vmax values were obtained from Eadie-Hofstee plots as 38.1 ± 5.2 μM and 815.3 ± 30.6 pmol/min/mg protein, respectively (means ± standard deviation, calculated by nonlinear least squares regression by MULTI; Figure 2B).
Expression of hCAT1 mRNA in human cord blood cells. Nuclear cells were isolated from cord blood cells. The specific primers described under “Materials and methods” were used for determining expression of hCAT1 in whole cells, CD34+ cells, CD34- cells, glycophorin A+ cells, and glycophorin A- cells. Data are presented as ratios with respect to whole (nonfractionated) cells.
Expression of hCAT1 mRNA in human cord blood cells. Nuclear cells were isolated from cord blood cells. The specific primers described under “Materials and methods” were used for determining expression of hCAT1 in whole cells, CD34+ cells, CD34- cells, glycophorin A+ cells, and glycophorin A- cells. Data are presented as ratios with respect to whole (nonfractionated) cells.
Inhibition of [3H]-l-arginine uptake by 1 mM l-arginine, l-lysine, l-histidine, l-ornithine, l-valine, and l-leucine was investigated. [3H]-l-arginine uptake was inhibited by typical CAT1 substrates, l-lysine, l-ornithine, and l-histidine (Figure 3A). N-ethyl maleimide (0.5 mM), a specific inhibitor of system y+, inhibited [3H]-l-arginine uptake by 80% (Figure 3B).
Effect of l-arginine deprivation on K562 cell differentiation and proliferation
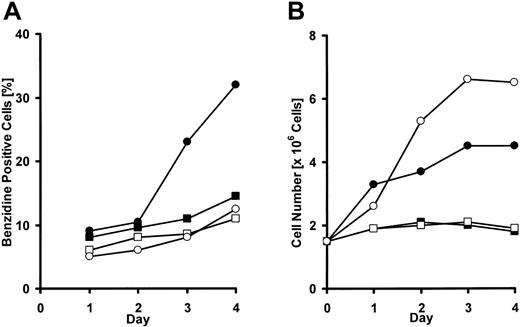
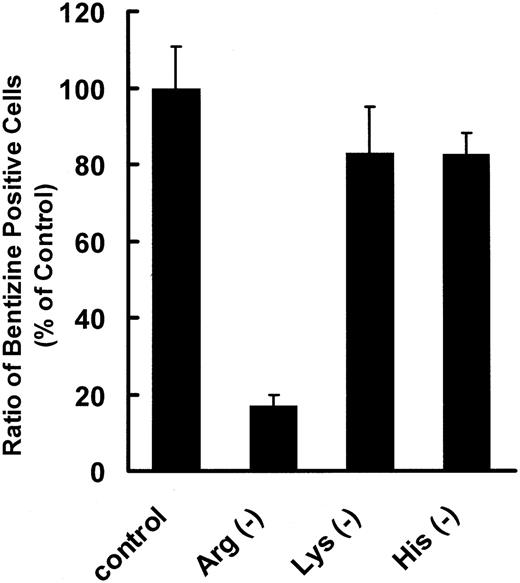
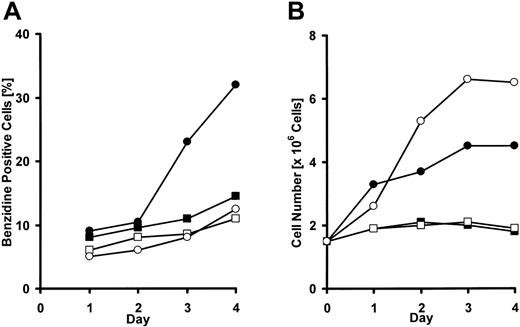
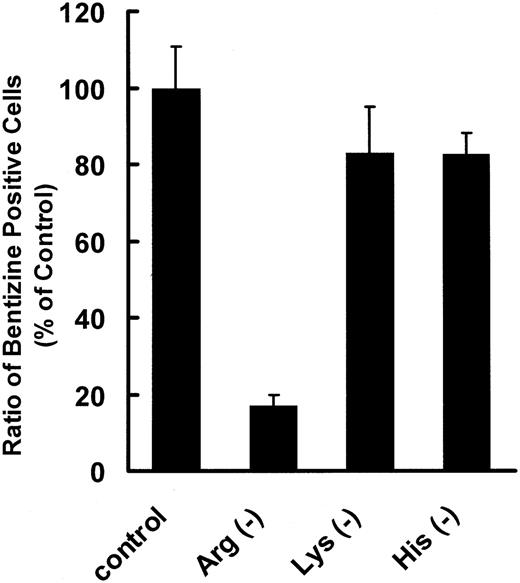
DMEM excluding l-arginine, l-lysine, or l-histidine was prepared to examine the effects of these amino acids on proliferation and differentiation of erythroleukemic K562 cells. K562 cells are committed to erythrocyte differentiation in the presence of an appropriate concentration of sodium butyrate (2 mM in this experiment), and 40% of them became benzidine positive after 4 days in complete medium, whereas less than 10% became benzidine positive without sodium butyrate. In l-arginine-free medium, the number of K562 cells remained at about 1 × 10⁵ cells/mL, and few benzidine-positive cells appeared either in the presence or absence of sodium butyrate after 4 days of cultivation (Figure 4A,B). However, when K562 cells were cultured in the absence of l-histidine, another CAT1 substrate, the cells hardly proliferated, though the ratio of benzidine-positive cells was almost the same as in complete medium. A similar result was obtained with l-histidine in an l-lysine-free medium (Figure 5).
Time course and concentration dependence of [3H]-l-arginine uptake by K562 cells. (A) Uptake of [3H]-l-arginine by K562 cells over 20 minutes was measured at 37°C and pH 7.4. • and ○ represent the uptake in the presence and absence of Na+ (replaced with N-methylglucamine), respectively. Points are means of 4 independent experiments, and error bars indicate SE. (B) Eadie-Hofstee plot of [3H]-l-arginine uptake by K562 cells. The best-fit nonlinear least-squares regression lines were obtained using MULTI.
Time course and concentration dependence of [3H]-l-arginine uptake by K562 cells. (A) Uptake of [3H]-l-arginine by K562 cells over 20 minutes was measured at 37°C and pH 7.4. • and ○ represent the uptake in the presence and absence of Na+ (replaced with N-methylglucamine), respectively. Points are means of 4 independent experiments, and error bars indicate SE. (B) Eadie-Hofstee plot of [3H]-l-arginine uptake by K562 cells. The best-fit nonlinear least-squares regression lines were obtained using MULTI.
Inhibitory effects of various amino acids and a specific inhibitor on [3H]-l-arginine uptake by K562 cells. (A) Inhibition of [3H]-l-arginine uptake in K562 cells by 1 mM l-arginine, l-lysine, l-ornithine, l-histidine, l-valine, and l-leucine was examined at 37°C for 3 minutes. Data represent means of 4 experiments, and error bars indicate SE. (B) Inhibition of [3H]-l-arginine uptake in K562 cells by the CAT-specific inhibitor NEM was examined at 37°C for 3 minutes after preincubation with NEM for 5 minutes. Data represent means of 4 experiments, and error bars indicate SE.
Inhibitory effects of various amino acids and a specific inhibitor on [3H]-l-arginine uptake by K562 cells. (A) Inhibition of [3H]-l-arginine uptake in K562 cells by 1 mM l-arginine, l-lysine, l-ornithine, l-histidine, l-valine, and l-leucine was examined at 37°C for 3 minutes. Data represent means of 4 experiments, and error bars indicate SE. (B) Inhibition of [3H]-l-arginine uptake in K562 cells by the CAT-specific inhibitor NEM was examined at 37°C for 3 minutes after preincubation with NEM for 5 minutes. Data represent means of 4 experiments, and error bars indicate SE.
Effect of l-arginine deprivation in the medium on K562 cell growth under stimulation with sodium butyrate. K562 cells were seeded in 12-well plates at a density of 1 × 10⁵ cells/mL and incubated in culture medium with or without l-arginine for 5 days. • represents l-arginine+ butyrate+; ○, l-arginine+ butyrate-; ▪, l-arginine- butyrate+; and □, l-arginine- butyrate-. (A) Time course of benzidine-positive cells ratio of K562. (B) Time course of cell number of K562 cells. Experiments were repeated 3 times with similar results.
Effect of l-arginine deprivation in the medium on K562 cell growth under stimulation with sodium butyrate. K562 cells were seeded in 12-well plates at a density of 1 × 10⁵ cells/mL and incubated in culture medium with or without l-arginine for 5 days. • represents l-arginine+ butyrate+; ○, l-arginine+ butyrate-; ▪, l-arginine- butyrate+; and □, l-arginine- butyrate-. (A) Time course of benzidine-positive cells ratio of K562. (B) Time course of cell number of K562 cells. Experiments were repeated 3 times with similar results.
Effect of l-arginine deprivation on differentiation and proliferation of CD34+ and CD34- cells
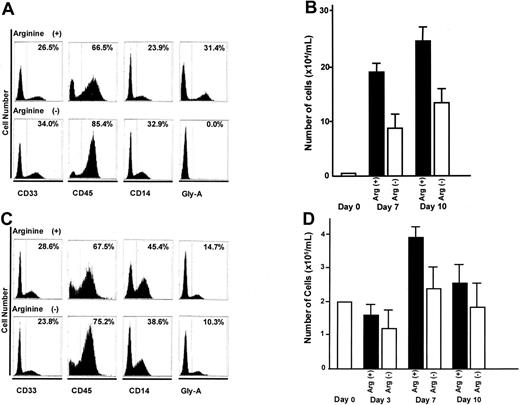
CD34+ and CD34- cells derived from human cord blood cells were examined in the same way as described above; that is, they were cultured in the presence or absence of l-arginine, and the expression of cell surface antigens was studied by flow cytometry. CD34+ cells, hematopoietic stem cells, were able to differentiate into leukocytes (CD45+ cells) and erythrocytes (glycophorin A+ cells) after 10 days of culture with l-arginine. However, erythrocyte differentiation did not occur in the absence of l-arginine, indicating that l-arginine is essential for differentiation of hematopoietic stem cells into erythrocytes (Figure 6A,B). When CD34- cells (including CD33, CD45, and glycophorin A-positive cells) were cultured in the absence of l-arginine, glycophorin A+ cells were present in the culture after 10 days (Figure 6C,D). These findings suggest that l-arginine is required for the differentiation of hematopoietic stem cells into mature erythrocytes, but deprivation of l-arginine does not affect the survival of erythrocytes.
Effect of cationic amino acid deprivation in the medium on differentiation of K562 cells stimulated with sodium butyrate. K562 cells were seeded in 12-well plates at a density of 1 × 10⁵ cells/mL and incubated in culture medium deprived of l-arginine, l-lysine, or l-histidine for 96 hours. Data are shown as the ratio of benzidine-positive cells with respect to that in complete medium stimulated with sodium butyrate as a control. Data represent means of 3 experiments, and error bars indicate SE.
Effect of cationic amino acid deprivation in the medium on differentiation of K562 cells stimulated with sodium butyrate. K562 cells were seeded in 12-well plates at a density of 1 × 10⁵ cells/mL and incubated in culture medium deprived of l-arginine, l-lysine, or l-histidine for 96 hours. Data are shown as the ratio of benzidine-positive cells with respect to that in complete medium stimulated with sodium butyrate as a control. Data represent means of 3 experiments, and error bars indicate SE.
Discussion
Hematopoietic stem cells require various cytokines to differentiate and fully mature into a specific lineage in vitro. With respect to erythropoiesis, a combination of one of the early-acting cytokines and erythropoietin (EPO) is essential for proliferation and differentiation of erythroid progenitors,21 but the roles of small molecules such as amino acids, nucleosides, and others remain unknown. In this study, we have shown that the human cationic amino acid transporter CAT1 is critical for hematopoiesis of erythroid cells because of its role in importing l-arginine, which is essential for both proliferation of blood cells and differentiation to erythroid lineage.
hCAT1 showed a selective expression pattern in erythroid-lineage cells, being detected at about 8 times higher levels in glycophorin A-positive nuclear cells from cord blood than in the unfractionated cells, but at low levels in glycophorin A-, CD34+, and CD34- cells. Since glycophorin A is expressed after the formation of burst-forming unit erythroid (BFU-E), in the progression from colony-forming unit-erythroid (CFU-E) to mature erythroid cells,22 CAT1 seems to be highly expressed in relatively mature erythroid cells and is possibly involved in late (or terminal) erythroid maturation. In mouse hematopoietic cells, a similar expression pattern was observed: TER119-positive cells expressed more mCAT1 mRNA (data not shown). Perkins et al6 reported that Cat1 knockout mice showed a defect in erythrocyte cell maturation, especially after erythroid nuclear cells, without affecting maturation of other hematopoietic cells.6 Even though knockout mice were reduced by 25% in body size, there may still be insufficient amino acid supply through CAT1. CAT1 seems to be involved in erythroid maturation regardless of species.
Effect of l-arginine deprivation in the medium on differentiation and proliferation of CD34+ and CD34- cells. (A) Expression patterns of lineage differentiation markers in CD34+ cord blood cells generated in vitro in the absence of l-arginine in the medium. (B) Changes in the number of cells in culture with or without l-arginine originated from CD34+ human cord blood cells. ▪ and □ represent the number of cells cultivated in the medium with l-arginine and without l-arginine, respectively. 1 × 10⁴/mL of CD34+ cells were cultured in the presence or absence of l-arginine, and cells were harvested at days 7 and 10. (C) Expression patterns of lineage differentiation markers in CD34- cord blood cells generated in vitro in the absence of l-arginine in the medium. (D) Changes in the number of cells in culture with or without l-arginine originated from CD34- human cord blood cells. ▪ and □ represent the number of the cells cultivated in the medium with l-arginine and without l-arginine, respectively. 2 × 10⁵/mL of CD34- cells were cultured in the presence or absence of l-arginine, and cells were harvested at days 3, 7, and 10. Data represent means of three experiments, and error bars indicate SD.
Effect of l-arginine deprivation in the medium on differentiation and proliferation of CD34+ and CD34- cells. (A) Expression patterns of lineage differentiation markers in CD34+ cord blood cells generated in vitro in the absence of l-arginine in the medium. (B) Changes in the number of cells in culture with or without l-arginine originated from CD34+ human cord blood cells. ▪ and □ represent the number of cells cultivated in the medium with l-arginine and without l-arginine, respectively. 1 × 10⁴/mL of CD34+ cells were cultured in the presence or absence of l-arginine, and cells were harvested at days 7 and 10. (C) Expression patterns of lineage differentiation markers in CD34- cord blood cells generated in vitro in the absence of l-arginine in the medium. (D) Changes in the number of cells in culture with or without l-arginine originated from CD34- human cord blood cells. ▪ and □ represent the number of the cells cultivated in the medium with l-arginine and without l-arginine, respectively. 2 × 10⁵/mL of CD34- cells were cultured in the presence or absence of l-arginine, and cells were harvested at days 3, 7, and 10. Data represent means of three experiments, and error bars indicate SD.
We hypothesized that CAT1 exhibits its hematopoietic action through its role in the import of l-arginine, which is a precursor of biologically functional NO and polyamines. The effect of l-arginine was examined using K562 cells as an erythroid model and human hematopoietic cells from human cord blood. The mRNA expression study revealed that hCAT1 is predominant among cationic amino acid transporters in K562 cells (data not shown), in agreement with previous findings.12 The kinetic characteristics of l-arginine uptake into K562 cells were similar to those of CAT1 reported previously,8,9,23 in regards to Na+ independence, affinity for l-arginine, and substrate selectivity based on the inhibition profile by amino acids. Inhibition of l-arginine uptake in the presence of Na+ by l-leucine is a known phenomena of CAT family.24 Especially, characteristic inhibition by N-ethylmaleimide (NEM), which distinguishes CAT from other l-arginine transporters such as y+L,25,26 showed that CAT is mainly responsible for transport of l-arginine into K562 cells, although incomplete inhibition by NEM suggests a minor contribution of other transporters. Thus, CAT1 could be predominantly responsible for l-arginine uptake into erythroleukemic K562 cells. Therefore, K562 cells should be a good model to investigate the functions of CAT1 substrates. K562 can be chemically differentiated into benzidine-positive cells.27-29 Using this feature, we examined the effects of CAT1 substrates on differentiation and proliferation of K562 cells. One of the CAT1 substrates, l-arginine, is contained in DMEM as a nonessential amino acid, while l-histidine and l-lysine are essential amino acids. When CAT1 substrates were individually depleted from the culture medium, only l-arginine affected both differentiation and proliferation of K562 cells, while other CAT1 substrates affected only proliferation of the cells. It seems reasonable that depletion of these CAT1 substrates slowed down proliferation, because they are essential amino acids. Thus, only l-arginine among CAT1 substrates influenced erythroid differentiation. More importantly, in the experiment using different lineages of hematopoietic cells from cord blood, hematopoietic stem cells (CD34+ cells) failed to differentiate into erythrocytes (glycophorin A+ cells) in culture medium supplemented with IL-3, stem cell factor, and EPO, but without l-arginine. Deprivation of l-arginine did not influence the survival of glycophorin A+ cells, supporting the idea that l-arginine is involved in the process of erythroid differentiation. This is consistent with the findings of the mCAT1 knockout mouse study.6 l-arginine may influence erythroid maturation through a metabolite, such as nitric oxide or polyamines. Nitric oxide is produced from l-arginine, and RBCs possess nitric oxide synthase (NOS) activity,30 while NO has a negative effect on hematopoiesis.31,32 On the other hand, polyamines, which are produced from l-ornithine through l-arginine, induce hemoglobin synthesis in murine erythroleukemia cells.33 In contrast, there is a report that amino acid starvation induces differentiation through an amino acid response element like C/EBP homologous protein,34 but this seems to be a different phenomenon not involving a transporter.
In conclusion, we have demonstrated that hCAT1 is involved in erythroid hematopoiesis through its role in importing l-arginine, which appears to be essential for the differentiation of red blood cells.
Prepublished online as Blood First Edition Paper, October 6, 2005; DOI 10.1182/blood-2005-08-3166.
The publication costs of this article were defrayed in part by page charge payment. Therefore, and solely to indicate this fact, this article is hereby marked “advertisement” in accordance with 18 U.S.C. section 1734.
We thank Masayuki Hidaka and Mari Hayashi for technical assistance.

![Figure 2. Time course and concentration dependence of [3H]-l-arginine uptake by K562 cells. (A) Uptake of [3H]-l-arginine by K562 cells over 20 minutes was measured at 37°C and pH 7.4. • and ○ represent the uptake in the presence and absence of Na+ (replaced with N-methylglucamine), respectively. Points are means of 4 independent experiments, and error bars indicate SE. (B) Eadie-Hofstee plot of [3H]-l-arginine uptake by K562 cells. The best-fit nonlinear least-squares regression lines were obtained using MULTI.](https://ash.silverchair-cdn.com/ash/content_public/journal/blood/107/4/10.1182_blood-2005-08-3166/2/m_zh80040691210002.jpeg?Expires=1769408159&Signature=ead9mB1~oUYV28goZ0-14BOKqlepJuZxiIu5vgqNvRxI1qEB4yQhkk1rMswqpRczj1HHeWFxDSil-5uFH0JchCkocgN86UxVxhGaM0uIrxaocCPdD7jy3fFVjYRnTXx6NNLfz3Ac41Qa6InlIoombcwZetBCp-2X2vN~OyvaCbWFiLh6PDLjoW0sntv-6b6GiU4I9JSL4KIedWk6H3cwGG6nfhKmuBFfDdW3nuz~ueEnhjiyaNn46t0RZ1qECTVFL3S-g2IaLyzSgmnvXawOyFEe45wHlHgStI0~Jj53Eg-xdgoKhAVS0dG7bsx5XJoJ1WC65dLEEN9qH4HyB-gZRQ__&Key-Pair-Id=APKAIE5G5CRDK6RD3PGA)
![Figure 3. Inhibitory effects of various amino acids and a specific inhibitor on [3H]-l-arginine uptake by K562 cells. (A) Inhibition of [3H]-l-arginine uptake in K562 cells by 1 mM l-arginine, l-lysine, l-ornithine, l-histidine, l-valine, and l-leucine was examined at 37°C for 3 minutes. Data represent means of 4 experiments, and error bars indicate SE. (B) Inhibition of [3H]-l-arginine uptake in K562 cells by the CAT-specific inhibitor NEM was examined at 37°C for 3 minutes after preincubation with NEM for 5 minutes. Data represent means of 4 experiments, and error bars indicate SE.](https://ash.silverchair-cdn.com/ash/content_public/journal/blood/107/4/10.1182_blood-2005-08-3166/2/m_zh80040691210003.jpeg?Expires=1769408159&Signature=tNJol2-auyRUgwYI~5oJMjJLCCXXTNTRf0dFk81yhkoXvfph25StoXlC0eG~eLKcctIRH0Y0PigI0T8Ulx3v~xRGQk~e5V62BIdbC7A4RES6zUruujyYaeMUWct-aUnh0poMSqt2ZsqIXNgZFHK-6pV5jlh9WoO4VWKq-ZZT0y6Aa08BiC9i~kVNTwPdLsio6Gj0YERbqlc7g21FaOeMRW4QYqIwR0ybgbvayLGxLgqPV7wCW5~qn6dpyETBOR1u1DjbVcmutJdW6~xlpebdppyMpaYHqN34SraNR14skPSGv0wdRGu6NK3bYewraJtACMdEsF2tg5~iz7oDH~HN2g__&Key-Pair-Id=APKAIE5G5CRDK6RD3PGA)


![Figure 2. Time course and concentration dependence of [3H]-l-arginine uptake by K562 cells. (A) Uptake of [3H]-l-arginine by K562 cells over 20 minutes was measured at 37°C and pH 7.4. • and ○ represent the uptake in the presence and absence of Na+ (replaced with N-methylglucamine), respectively. Points are means of 4 independent experiments, and error bars indicate SE. (B) Eadie-Hofstee plot of [3H]-l-arginine uptake by K562 cells. The best-fit nonlinear least-squares regression lines were obtained using MULTI.](https://ash.silverchair-cdn.com/ash/content_public/journal/blood/107/4/10.1182_blood-2005-08-3166/2/m_zh80040691210002.jpeg?Expires=1769408160&Signature=HtCn90fgiI99LMoGbBzEzQk~oLlySWFqy4zGUttrl6BikfUxxkPiVnk0a9wk0v2bC4aF1w~7THAoSvVE5L1dtlahyqlAkbDmyHKsGRrPR3N7iAxv8TqfQiAqpbERFYh3Lb5YLwamEo9tdXzUUt-R7V4tTHI597GwJH~M9dKmZxNBiQpi2vEbR~QxeKaHz8CNeQHps7Z9QWjG6jDCJu8nXFXT5DJ2MO8c2ppZSpODF~LnUsoFmRg3PQG-dJFlIoPf0yjLkLQA-eMkD6AyUX~uKW9WnZ~1H~dP3PT8AzIF1PHufVNfV7JLW4BoT-m3rQD2dTdbWqmEXCy7U4EuC9Pguw__&Key-Pair-Id=APKAIE5G5CRDK6RD3PGA)
![Figure 3. Inhibitory effects of various amino acids and a specific inhibitor on [3H]-l-arginine uptake by K562 cells. (A) Inhibition of [3H]-l-arginine uptake in K562 cells by 1 mM l-arginine, l-lysine, l-ornithine, l-histidine, l-valine, and l-leucine was examined at 37°C for 3 minutes. Data represent means of 4 experiments, and error bars indicate SE. (B) Inhibition of [3H]-l-arginine uptake in K562 cells by the CAT-specific inhibitor NEM was examined at 37°C for 3 minutes after preincubation with NEM for 5 minutes. Data represent means of 4 experiments, and error bars indicate SE.](https://ash.silverchair-cdn.com/ash/content_public/journal/blood/107/4/10.1182_blood-2005-08-3166/2/m_zh80040691210003.jpeg?Expires=1769408160&Signature=dwJpejmyVqaN~wK3em~l5hBg9urPa9xlMWo4Bb~7W6F2fCaMxHFr12NM~iy-np5ocQVk9ku2i5Ksv-PvisF3M3Y-1~5O8ccRd5UFGnhzHC2X2xjJ61qp2WIvRhSIsuJC1sa3~WExe3QnX7WPZoMkZyJjlOArpB82x6KmP-7X7ZOy9n~1mH5GVZHRQfS1HqpB5aHZKHCuKgda3~6DE2knFQQycLzzW4fzX-meqqkK7SDNO3I6pMQudEeucKWUmR5ykOkb3HwoLdCCXT03YjxXkPXDzb3JjGlcY2vkMrrZa8fZD1I6y4ccdq49FAhHIj4jC7xiabA0v4X~QXbsoEXk4Q__&Key-Pair-Id=APKAIE5G5CRDK6RD3PGA)
