Abstract
HFE is a protein known to be involved in iron metabolism; yet, other than its homology with major histocompatibility complex (MHC) class I molecules, it has not been described as having an immunologic function. Here we report that peripheral blood mononuclear cells (PBMCs) from patients with hereditary hemochromatosis (HH) carrying the C282Y mutation in HFE have reduced cell-surface expression of MHC class I due to an enhanced endocytosis rate of MHC class I molecules caused by premature peptide and β2-microglobulin dissociation. This faster turnover also leads to increased expression levels of cell-surface free class I heavy chains in mutant PBMCs. Biochemical analysis indicates an earlier peptide loading and endoplasmic reticulum maturation of MHC class I molecules in C282Y mutant cells. Thermostability assays further showed that in HFE mutants the MHC class I peptide loading gives rise to low-stability heterotrimers that dissociate prematurely during its intracellular traffic. The present results suggest the existence of an intriguing cross-talk between a particular HFE mutation and the classical MHC class I route. These findings constitute the first description of peptide presentation pathway abnormalities linked to HFE and provide additional evidence for the occurrence of immunologic defects in patients with HH.
Introduction
Antigenic peptides presented by major histocompatibility complex (MHC) class I molecules to CD8+ T cells are mainly derived from proteolysis of newly synthesized proteins in the cytosol1-3 by the proteasome and TPPII (tripeptidyl-peptidase II).4 A heterodimer of 2 membrane-spanning molecules, termed TAP1 (transport associated with antigen processing 1) and TAP2, translocates the peptides to the lumen of the endoplasmic reticulum (ER)5-8 where they undergo further trimming of their amino-terminal ends by the aminopeptidase ERAAP (aminopeptidase associated with antigen processing in the ER).9,10 Loading of peptides onto MHC class I molecules involves the formation of a transient protein complex termed the peptide-loading complex (PLC)11,12 that facilitates the binding of peptide to MHC–β2-microglobulin (β2-m) heterodimers.11 The conformational changes that occur in the newly formed peptide-loaded MHC class I molecules precede their release from the PLC and subsequent delivery to the cell surface via the standard secretory pathway.
MHC class I assembly and export from the ER is a complex process13,14 subjected to a set of quality control mechanisms. This orchestrated process acts concertedly to ensure that high-affinity peptides are loaded onto class I molecules. Tapasin, calreticulin, and ERp57 are some of the key players supposed to take part in this event.15 Yet the precise mechanisms responsible for optimization of class I maturation and for the prevention of ER escape of premature class I molecules remain to be fully understood.
Here, we have studied assembly, peptide loading, and surface expression of MHC class I molecules in peripheral blood mononuclear cells (PBMCs) of either control blood donors or patients with hereditary hemochromatosis (HH). HH is a disease characterized by the excessive deposition of iron in several organs and is the most common autosomal recessive disorder in the white population.16 HFE is a 343-residue type I transmembrane glycoprotein homologous to MHC class I proteins that also interacts with β2-m.17 However, despite the structural similarities with MHC class I molecules, HFE lacks a functional peptide-binding groove.18 An HFE mutation, in which cysteine at position 282 was changed to tyrosine (C282Y), has been identified in the majority of patients with HH.17 The C282Y mutation prevents the formation of an intramolecular disulfide bond in the α3 domain of HFE and abrogates β2-m association and cell-surface expression of the protein influencing its effects on the regulation of cellular iron levels.19-21 The observation that HFE binds to transferrin receptor I,22,23 an homodimeric cell-surface glycoprotein that acts as the receptor for iron-loaded transferrin,24 implicated HFE in the regulation of iron homeostasis.
The previous observations that patients with HH have low numbers of CD8+ T cells,25,26 decreased CD8-p56lck activity,27 the anomalies in the T-cell–receptor repertoire observed in C282Y mutation carriers,28 and the diminished cytotoxic activity of HH patients' CD8+ cytotoxic T lymphocytes (CTLs)29 established a solid link between the immunologic system and iron metabolism. Yet, the key player, if there is one, involved in this intriguing association remains to be revealed. Here we show that MHC class I surface expression is decreased in PBMCs from patients with HH with the HFE C282Y mutation. Metabolic labeling experiments showed that the proportion of properly assembled class I molecules and unfolded MHC class I heavy chains (HCs) are significantly different between control and HFE C282Y mutant PBMCs. In view of these findings we analyzed the peptide-loading kinetics, stability, and the maturation of MHC class I molecules. We describe an association between a mutation in the HFE gene and anomalies in the assembly, maturation, and surface expression of MHC class I molecules.
Patients, materials, and methods
Antibodies
The following antibodies (Abs) were used: monoclonal antibody (mAb) W6/32 (Dako, Glostrup, Denmark); HC-10; anti–HLA-A, -B, -C–fluorescein isothiocyanate (FITC)–conjugated mAb clone G46-2.6 (BD PharMingen, San Diego, CA); anti–MHC class II α-chain; 8C-10 (mouse anti–human HFE) that recognizes HFE/β2-m heterodimers (a kind gift from Dr Rachel Ehrlich, Department of Cell Research and Immunology, Tel Aviv University, Tel Aviv, Israel) and rabbit anti-HFE cytoplasmic tail (CT) that recognizes free HFE HC30 ; donkey anti–mouse FITC-conjugated secondary Ab (Jackson ImmunoResearch, West Grove, PA); anti–CD14-RPE clone TUK4, anti–CD8-FITC clone DK25, and anti–CD4-phycoerythrin (PE) clone MT310 (Dako).
Cells
PBMCs were obtained from healthy blood donors and patients with HH at the HH Clinic, Santo António General Hospital (Oporto, Portugal), after informed consent was obtained, according to the Declaration of Helsinki. The study protocol was approved by the hospital's ethical board. When possible, in each individual experiment subjects were matched by sex and age. After centrifugation over Lymphoprep (Nycomed, Oslo, Norway), PBMCs were washed with Hanks balanced salt solution (HBSS). Contaminating red blood cells (RBCs) were lysed in 10 mM Tris (tris(hydroxymethyl)aminomethane), 150 mM NH4Cl, pH 7.4 at 37°C for 10 minutes.
HFE genotyping
HFE genotyping was done using the Haemochromatosis StripAssayB kit (ViennaLab, Vienna, Austria) according to the manufacturer's protocol, as described previously.28
Flow cytometry
For HFE intracellular staining, 1 × 10⁶ PBMCs were fixed by incubation in phosphate-buffered saline (PBS) containing 4% formaldehyde for 15 minutes at room temperature. Fixed cells were incubated for 30 minutes on ice with 8C10 (diluted in PBS, 0.2% bovine serum albumin [BSA], 0.1% NaN3, 0.2% saponin), washed twice with PBS, and incubated with anti–mouse-FITC for 30 minutes. Cells were washed 3 times and immediately acquired in a FACScalibur (Becton Dickinson, Mountain View, CA). For surface immunofluorescence staining, 1 × 10⁶ PBMCs were washed in ice-cold PBS, 0.2% BSA, 0.1% NaN3 followed by incubation at 4°C with a saturating amount of primary Ab for 30 minutes in 96-well plates. After 3 washes cells were incubated with secondary Ab for 30 minutes on ice. Cells were washed twice and fluorescence-activated cell sorting (FACS) analysis was performed in a FACScalibur. For the class I stability assay, cells were either incubated overnight at 25°C and 37°C in RPMI with Glutamax, 10% fetal bovine serum (FBS; Figure 7B) or cultured for 5 hours in the presence of 20 μg/mL brefeldin A (BFA; Affiniti, Exeter, United Kingdom; Figure 7C) before surface staining with W6/32. For each sample a minimum of 10 000 events was acquired. To define the background staining, irrelevant mAbs of the same isotype were used.
Metabolic labeling and Endo H digestion
PBMCs (5 × 10⁶) were starved for 1 hour in cysteine/methionine-free Dulbecco modified Eagle medium (DMEM) supplemented with 1% l-glutamine and labeled for 2.5 hours with 140 μCi/mL (5.18 MBq) Pro-Mix L-[35S]cysteine/methionine (Amersham Biosciences. Buckinghamshire, United Kingdom). After labeling, cells were washed 3 times with HBSS and lysed in ice-cold lysis buffer (300 mM NaCl, 50 mM Tris-HCl, pH 7.4, 1% Triton-X, complete EDTA [ethylenediaminetetraacetic acid]-free protease inhibitor cocktail [Roche Diagnostics, Mannheim, Germany] and 10 mM iodoacetamide [Sigma-Aldrich, St Louis, MO]). The nuclei and cell debris were removed by centrifugation and the lysates precleared with 100 μL protein A-Sepharose beads slurry (50%) for 1 hour at 4°C. Half the lysates corresponding to 2.5 × 10⁶ cells containing equivalent amounts of trichloroacetate (TCA)–precipitable radioactivity were incubated at 4°C with HC-10 and the other half with W6/32 under the same conditions. Immunocomplexes were pulled down with protein A-Sepharose beads and washed 3 times in ice-cold lysis buffer. For HLA-DR immunoprecipitation, 5 × 10⁶ cells were labeled and processed as described. In the thermostability experiments precleared cell lysates were incubated at 0°C, 25°C, 37°C, and 42°C for 3 hours before immunoprecipitation with W6/32. For Endo H assay, the W6/32 immunocomplexes were divided into 3 equal portions: one was left untreated (negative control), and the others were digested for 6 hours at 37°C with Endo H (Roche Diagnostics) or n-Glycosidase F (Roche Diagnostics) as described by the manufacturer. The reaction was stopped by addition of gel-loading buffer solution31 with 10% β-mercaptoethanol and boiling for 5 minutes.
Pulse chase experiments to follow peptide loading
Experiments were performed as described previously.32 Briefly, 50 × 106 PBMCs were starved in cysteine/methionine-free medium and labeled for 5 minutes with 140 μCi/mL (5.18 MBq) L-[35S]cysteine/methionine. The labeling was stopped by the addition of 1 mM cold methionine and cysteine (Sigma-Aldrich) and the cells were chased for 0, 1, 2, 4, and 6 minutes at 26°C. At every chase time 200 μL cell suspension was injected into 2 mL ice-cold lysis buffer. After 1 hour on ice, the cell debris was removed by centrifugation and the lysates precleared as described. Cell lysates were split into 2 equal portions. One was left on ice and the other was incubated at 37°C for 1 hour. MHC class I molecules were then immunoprecipitated from lysates with equivalent amounts of TCA-precipitable radioactivity with W6/32.
SDS-PAGE and quantitation
Ten percent sodium dodecyl sulfate-polyacrylamide gel electrophoresis (SDS-PAGE) was performed using a Bio-Rad Mini Protean II kit (Bio-Rad, Hercules, CA). Gels were fixed in 10% acetic acid and 40% methanol, incubated for 30 minutes with Amplify solution (Amersham Biosciences), dried, and exposed to a radioactivity storage screen. Quantitation was performed using a Typhoon phosphoimager (Molecular Dynamics, Sunnyvale, CA) with ImageQuant version 5.1 software (Molecular Dynamics).
Western blot
Total protein concentration from whole-cell lysates was determined with the RC/DC protein assay (Bio-Rad) and 30 μg separated by SDS-PAGE. The proteins were then transferred to a nitrocellulose Hybond-C membrane (Amersham Biosciences). After blocking at 4°C with 5% dry milk/0.05% Tween 20 in PBS (PBS-T), the membrane was incubated with anti-HFE (CT), washed 3 times with PBS-T, and detected with goat anti–rabbit IgG–horseradish peroxidase (HRP) conjugate (Molecular Probes, Eugene, OR) and the enhanced chemiluminescence substrate Super Signal West Dura (Pierce, Rockford, IL).
Statistical analysis
To test the significance of the differences observed in Figures 5, 6, 7, the Student t test was used. In all tests the statistical significance was 2-sided and considered at P less than .05. Analysis of flow cytometry results of cell-surface MHC class I (Figure 2) was done plotting the gaussian cumulative distribution function (CDF) of the mean fluorescence intensity (MFI) observed in each individual experiment using SigmaPlot version 8.02 (SPSS, Chicago, IL). Statistical differences were calculated with the Kolmogorov-Smirnov test. In Figures 5, 6, 7 data are displayed as mean plus or minus 1 SD.
Results
Reduced cell-surface expression of β2-m–assembled MHC class I molecules and increased free MHC class I HCs in C282Y mutants
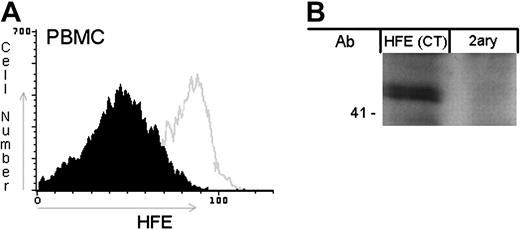
The tissue expression pattern of HFE is still subject to intensive study. In that context, we decided to check whether this protein is present in PBMCs by flow cytometry and also by Western blot analysis. Using an anti-HFE antibody that labels the properly folded HFE molecules and thus does not detect C282Y mutant forms, HFE wild-type (WT) cells were permeabilized, labeled, and analyzed by FACS (Figure 1A). For Western blot analysis whole-cell lysates from WT PBMCs were processed as described using an antibody that recognizes free HFE HCs (HFE CT; Figure 1B). The results of both experiments revealed that HFE is expressed in PBMCs.
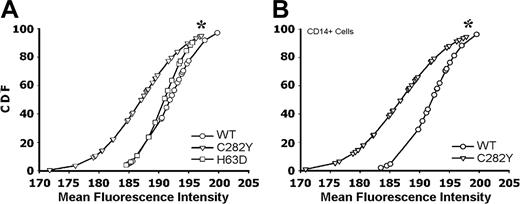
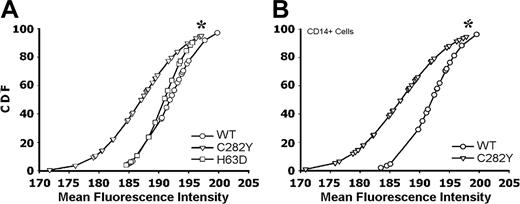
To assess the effect of the C282Y mutation on the cell-surface expression of MHC class I molecules, we used PBMCs isolated from C282Y mutants in patients with HH and from control blood donors without that particular mutation (WT). FACS analysis revealed significantly lower cell-surface labeling with the anti–HLA-A, -B, or -C–FITC mAb (recognizes assembled MHC class I) in C282Y mutated PBMCs than in WT cells (Figure 2A). We have also analyzed PBMCs heterozygous for the H63D mutation in HFE, a mutation also seen in some patients with HH.17 In this case, staining with anti–HLA-A, -B, or -C–FITC did not show any significant difference in the MHC class I surface expression when compared to WT cells (P > .8; Figure 2A). Because PBMCs are a rather heterogenic population, we also analyzed the surface expression of MHC class I molecules in CD14+ cells (monocytes) only. PBMCs were double-stained with anti–HLA-A, -B, -C–FITC and anti–CD14-RPE–conjugated mAbs. FACS analysis showed that C282Y monocytes have a reduced surface expression of class I molecules compared with WT monocytes (Figure 2B).
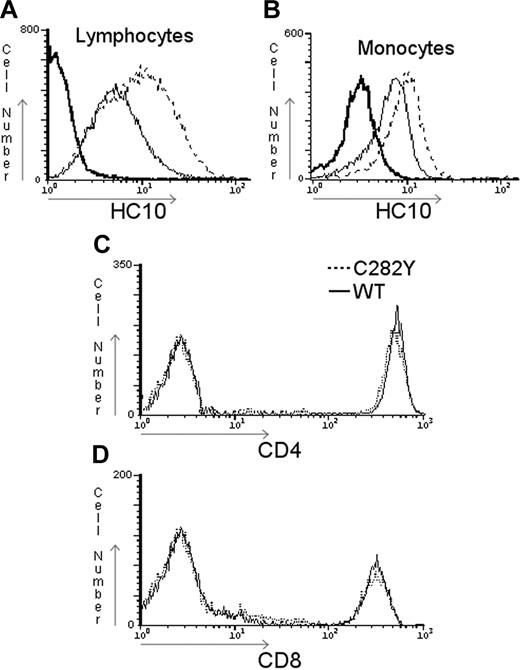
To evaluate if the observed decrease of β2-m–assembled class I molecules in C282Y cells was accompanied by significant changes in the amount of surface-expressed free MHC class I HC, nonpermeabilized PBMCs obtained from C282Y homozygous patients with HH and from WT control blood donors were stained with HC-10 (which recognizes only free class I HCs) and analyzed by FACS. In contrast to the result obtained for the β2-m–assembled class I molecules (Figure 2), the levels of surface-expressed free MHC class I HCs were higher in C282Y homozygous than in WT PBMCs (Figure 3). Again, the comparison of specific cell populations revealed a similar result (compare Figure 3A and B). To examine the MHC class I specificity of the previous results, CD4 (Figure 3C) and CD8 (Figure 3D) surface staining was performed. No differences were observed in the expression of these 2 molecules.
HFE expression in PBMCs. (A) Permeabilized PBMCs (without the C282Y HFE mutation) were stained for HFE. The open curve represents the HFE labeling in WT cells. The filled curve represents the MFI of the negative control obtained by incubation with an isotype-matched nonspecific antibody. A representative example of 7 independent experiments is shown. (B) HFE from whole-cell lysates of WT PBMCs was detected by Western blot with anti-HFE C-terminal (CT) Ab. A total of 30 μg total protein was separated by 10% SDS-PAGE and transferred to a nitrocellulose membrane. The membrane was probed with anti-HFE (CT) or with secondary antibody alone (2ary). The molecular weight marker is shown on the left.
HFE expression in PBMCs. (A) Permeabilized PBMCs (without the C282Y HFE mutation) were stained for HFE. The open curve represents the HFE labeling in WT cells. The filled curve represents the MFI of the negative control obtained by incubation with an isotype-matched nonspecific antibody. A representative example of 7 independent experiments is shown. (B) HFE from whole-cell lysates of WT PBMCs was detected by Western blot with anti-HFE C-terminal (CT) Ab. A total of 30 μg total protein was separated by 10% SDS-PAGE and transferred to a nitrocellulose membrane. The membrane was probed with anti-HFE (CT) or with secondary antibody alone (2ary). The molecular weight marker is shown on the left.
Reduced cell-surface expression of MHC class I molecules in HFE C282Y mutant PBMCs. (A) HFE WT (○), C282Y mutant (▿), and H63D mutant (□) PBMCs were surface stained for MHC class I molecules. Results are presented as the gaussian CDF of the MFI obtained in each individual experiment. The asterisk represents a statistically significant difference between the MFI distribution of the C282Y mutants when compared with the WT and H63D cells (Dn = 0.53; P < .01). (B) PBMCs were double-stained with anti–HLA-A, -B, or -C–FITC and anti–CD14-PE mAb. Class I staining MFI in double-positive cells is presented as the CDF. C282Y mutant and WT cells are compared. *Statistically significant difference between the MFI distribution of the C282Y mutant cells when compared with the WT cells (Dn = 0.58; P < .001). Sixty-four individuals were studied with the following distribution: 19 WT; 32 C282Y carriers; and 13 H63D carriers.
Reduced cell-surface expression of MHC class I molecules in HFE C282Y mutant PBMCs. (A) HFE WT (○), C282Y mutant (▿), and H63D mutant (□) PBMCs were surface stained for MHC class I molecules. Results are presented as the gaussian CDF of the MFI obtained in each individual experiment. The asterisk represents a statistically significant difference between the MFI distribution of the C282Y mutants when compared with the WT and H63D cells (Dn = 0.53; P < .01). (B) PBMCs were double-stained with anti–HLA-A, -B, or -C–FITC and anti–CD14-PE mAb. Class I staining MFI in double-positive cells is presented as the CDF. C282Y mutant and WT cells are compared. *Statistically significant difference between the MFI distribution of the C282Y mutant cells when compared with the WT cells (Dn = 0.58; P < .001). Sixty-four individuals were studied with the following distribution: 19 WT; 32 C282Y carriers; and 13 H63D carriers.
C282Y mutant cells display higher levels of surface-expressed free MHC class I HCs. HFE WT or C282Y homozygous PBMCs were surface stained with HC10 and analyzed by flow cytometry. Total lymphocytes (A) and monocytes (B) were gated and analyzed separately. Anti-CD4 (C) and anti-CD8 (D) surface staining of WT and C282Y homozygous PBMCs was carried out to demonstrate the specificity of the result. The dotted line in the 4 histograms represents the C282Y homozygous staining; the thin solid line, the WT staining; and the bold solid line, the negative control obtained by incubation with an isotype-matched nonspecific Ab. These are representative data from one experiment repeated 5 times with similar results.
C282Y mutant cells display higher levels of surface-expressed free MHC class I HCs. HFE WT or C282Y homozygous PBMCs were surface stained with HC10 and analyzed by flow cytometry. Total lymphocytes (A) and monocytes (B) were gated and analyzed separately. Anti-CD4 (C) and anti-CD8 (D) surface staining of WT and C282Y homozygous PBMCs was carried out to demonstrate the specificity of the result. The dotted line in the 4 histograms represents the C282Y homozygous staining; the thin solid line, the WT staining; and the bold solid line, the negative control obtained by incubation with an isotype-matched nonspecific Ab. These are representative data from one experiment repeated 5 times with similar results.
Genotyping for MHC class I alleles was performed on all patients with HH. No significant correlation was observed between the results obtained and the allelic frequency (Table S2, available at the Blood website; see the Supplemental Materials link at the top of the online article).
Assembly of MHC class I molecules is altered in C282Y mutants
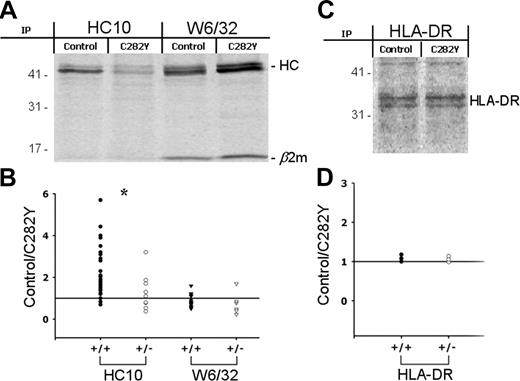
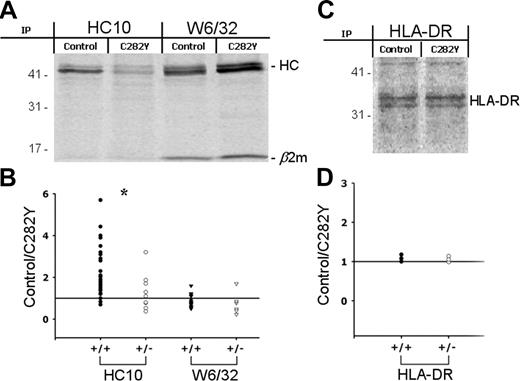
To examine if the reduced class I cell-surface expression in C282Y mutants is due to a decreased efficiency of MHC class I assembly, we analyzed the ratio between MHC class I HCs and the β2-m–assembled class I molecules isolated from whole-cell lysates. 35S-methionine/cysteine–labeled PBMCs with (C282Y) or without (control) the C282Y mutation were lysed and precipitated using the mAbs HC-10 and W6/32, which showed no cross-reactivity against HFE molecules (data not shown). W6/32 recognizes a conformational epitope located on the α1α2 domain of the HC and requires correct assembly with β2-m. The result of these experiments (Figure 4A) revealed marked differences in the relative proportions of the β2-m–bound and free MHC class I HCs. Fewer class I HCs and more β2-m–assembled class I molecules were found in C282Y mutant PBMCs than in controls, exactly the opposite of that observed at the cell surface (Figures 2, 3). The 35S-labeling experiments were also performed in the presence of the iron chelator deferoxamine (DFO; see Figure S1). Immunoprecipitation with both W6/32 and HC-10 Abs showed that iron loading is not the cause of the different amounts of assembled and free MHC class I molecules.
The β2-m–assembled and free MHC class I HC levels are altered in C282Y mutant cells in an allele-dependent manner. (A) PBMCs with (C282Y) or without (control) the C282Y mutation were 35S-labeled for 2.5 hours and class I molecules recovered with HC-10 and W6/32 mAbs and subjected to 10% SDS-PAGE. The position of the MHC class I HC and β2-m are indicated. Molecular weight markers are shown on the left. Data shown represent one individual experiment using PBMCs from one WT blood donor and one C282Y homozygous patient with HH of a total of 40 studied. (B) MHC class I HC bands were quantified by phosphoimaging. In each individual experiment one control blood donor and one patient with HH carrying the C282Y mutation were tested. The intensity of the control bands was divided by the C282Y bands. The ratios were plotted according to the patient's HFE genotype: C282Y homozygous (+/+; •/▾); C282Y heterozygous (+/-; ○/▿). *P < .05. The means ± SD of 40 experiments with the following distribution are shown: HC-10 (C282Y+/+), 31; HC-10 (C282Y+/-), 9; W6/32 (C282Y+/+), 23; W6/32 (C282Y+/-), 6. (C) As a control experiment, HLA-DR was recovered from control and C282Y 35S-labeled PBMCs and resolved on a 10% SDS-PAGE. (D) The control/C282Y ratios of the band intensity were plotted according to patient's HFE genotype. Data are representative of 6 individual experiments.
The β2-m–assembled and free MHC class I HC levels are altered in C282Y mutant cells in an allele-dependent manner. (A) PBMCs with (C282Y) or without (control) the C282Y mutation were 35S-labeled for 2.5 hours and class I molecules recovered with HC-10 and W6/32 mAbs and subjected to 10% SDS-PAGE. The position of the MHC class I HC and β2-m are indicated. Molecular weight markers are shown on the left. Data shown represent one individual experiment using PBMCs from one WT blood donor and one C282Y homozygous patient with HH of a total of 40 studied. (B) MHC class I HC bands were quantified by phosphoimaging. In each individual experiment one control blood donor and one patient with HH carrying the C282Y mutation were tested. The intensity of the control bands was divided by the C282Y bands. The ratios were plotted according to the patient's HFE genotype: C282Y homozygous (+/+; •/▾); C282Y heterozygous (+/-; ○/▿). *P < .05. The means ± SD of 40 experiments with the following distribution are shown: HC-10 (C282Y+/+), 31; HC-10 (C282Y+/-), 9; W6/32 (C282Y+/+), 23; W6/32 (C282Y+/-), 6. (C) As a control experiment, HLA-DR was recovered from control and C282Y 35S-labeled PBMCs and resolved on a 10% SDS-PAGE. (D) The control/C282Y ratios of the band intensity were plotted according to patient's HFE genotype. Data are representative of 6 individual experiments.
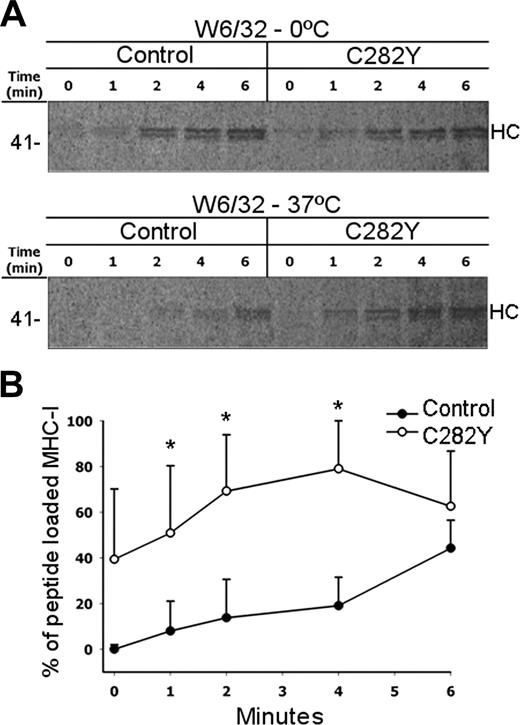
Peptide loading is faster in C282Y homozygous cells. (A) PBMCs without the C282Y mutation (control) or C282Y homozygous (C282Y) were 35S-labeled during 5 minutes and chased for the indicated times. Half the lysates were incubated at 37°C and the other half maintained at 0°C. MHC class I complexes were recovered with W6/32 mAb and subjected to 10% SDS-PAGE. Molecular weight markers are shown on the left. Data shown represent one individual experiment using PBMCs from one WT blood donor and one C282Y homozygous patient with HH. Five experiments with similar results were done. (B) Percentage of peptide-loaded MHC class I molecules present at each chase time. Note the significant difference in the appearance kinetics of class I molecules when maintained at 0°C and after 37°C exposures. *Statistically significant difference between the C282Y mutants and the controls (P < .05). Data are representative of 5 independent experiments (each performed with PBMCs from one WT control blood donor and one C282Y homozygous patient with HH).
Peptide loading is faster in C282Y homozygous cells. (A) PBMCs without the C282Y mutation (control) or C282Y homozygous (C282Y) were 35S-labeled during 5 minutes and chased for the indicated times. Half the lysates were incubated at 37°C and the other half maintained at 0°C. MHC class I complexes were recovered with W6/32 mAb and subjected to 10% SDS-PAGE. Molecular weight markers are shown on the left. Data shown represent one individual experiment using PBMCs from one WT blood donor and one C282Y homozygous patient with HH. Five experiments with similar results were done. (B) Percentage of peptide-loaded MHC class I molecules present at each chase time. Note the significant difference in the appearance kinetics of class I molecules when maintained at 0°C and after 37°C exposures. *Statistically significant difference between the C282Y mutants and the controls (P < .05). Data are representative of 5 independent experiments (each performed with PBMCs from one WT control blood donor and one C282Y homozygous patient with HH).
Quantitative analysis of the results indicated an HFE allele-dependent effect. The control/C282Y ratio calculated for the intensity of the HC-10 immunoprecipitates was significantly higher in C282Y homozygous than in C282Y heterozygous cells (Figure 4B). In control cells there are, on average, 2.5 times more free MHC class I HCs than in C282Y homozygous cells and 1.3 times more than in C282Y heterozygous cells. W6/32 immunoprecipitates did not reveal the same HFE allele dependency (Figure 4B). In this case, the average of the control/C282Y ratios was 0.77 (C282Y+/+) and 0.74 (C282Y+/-) and no statistically significant difference was observed.
To prove the specificity of the previous observations, MHC class II α-chain (HLA-DR) was recovered from whole-cell lysates by immunoprecipitation. As depicted in Figure 4C-D, no differences were found in the amount of immunoprecipitated protein between the control and the C282Y cells.
C282Y carriers load MHC class I more efficiently than WT subjects
To investigate the peptide-loading kinetics of MHC class I in C282Y homozygous compared with control PBMCs, cells were pulse labeled for 5 minutes and chased for the indicated times (Figure 5). After lysis, 3 different conformations of class I molecules were considered: class I HCs recognized by the mAb HC-10, class I HC/β2-m heterodimers, and class I HC/β2-m/peptide heterotrimers both recognized by the mAb W6/32. Peptide binding confers thermal stability to class I heterodimers,33-35 avoiding their dissociation. Therefore, after incubation at 37°C only class I heterotrimers were isolated by W6/32. By comparing the amount of protein recovered after the incubation at 37°C with that recovered from the lysates maintained on ice, the assembly of class I heterotrimers in vivo can be analyzed. The total amount of class I heterodimers and heterotrimers recovered with W6/32 at 0°C increased at every time point, both for control and C282Y cells (Figure 5A; W6/32-0°C). The similar amount of immunocomplexes recovered at 0°C demonstrates that class I HC/β2-m heterodimer formation occurs with analogous kinetics and excludes the possibility that the excess of β2-m in the C282Y mutants (due to the inability of HFE to complex with β2-m) forces the premature MHC class I assembly. After incubation at 37°C, the class I complexes recovered with W6/32 appeared with different kinetics from the complexes isolated from lysates kept at 0°C (Figure 5A). In C282Y mutant cells class I heterotrimers were present in the initial chase times, whereas in control cells class I complexes could be isolated only after 2 to 4 minutes (Figure 5A; W6/32-37°C). For quantitative comparison the W6/32-precipitated products shown in Figure 5A were scanned with a phosphoimager. The percentage of peptide-loaded MHC class I complexes present at each chase time was set as the ratio between the amount of W6/32 recovered class I complexes after the 37°C incubation and the amount recovered from the lysates kept at 0°C. Analysis of the data obtained revealed that in C282Y mutant cells the percentage of class I heterotrimers was significantly higher than in control cells. In C282Y mutant cells approximately 40% of the class I molecules recognized by W6/32 were in the heterotrimer conformation at the beginning of the chase, whereas only after 5 to 6 minutes of chase was a similar amount of peptide-loaded class I molecules observed in control cells (Figure 5B).
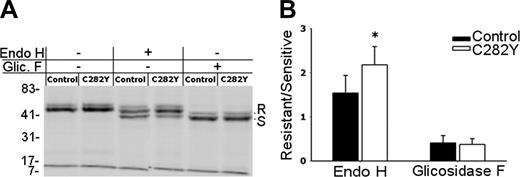
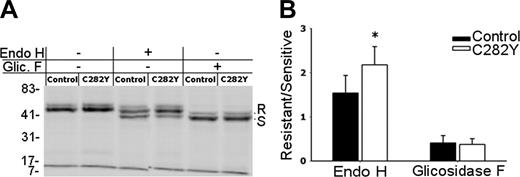
ER egress of class I molecules is faster in C282Y mutants. (A) After 2.5 hours 35S-metabolic labeling, W6/32 immunoprecipitates were digested for 6 hours at 37°C with Endo H, n-Glycosidase F, or mock treated and separated by 10% SDS-PAGE. The position of the resistant and sensitive forms of MHC class I HCs is indicated (R and S, respectively). Molecular weight markers are shown on the left. (B) Digestion-resistant and -sensitive class I forms were quantified by phosphoimaging and are presented as an R/S ratio. *Statistically significant difference between the C282Y mutants and the control cells (P < .05). Data are representative of 5 independent experiments, each performed with cells from one WT control blood donor and one C282Y homozygous patient with HH.
ER egress of class I molecules is faster in C282Y mutants. (A) After 2.5 hours 35S-metabolic labeling, W6/32 immunoprecipitates were digested for 6 hours at 37°C with Endo H, n-Glycosidase F, or mock treated and separated by 10% SDS-PAGE. The position of the resistant and sensitive forms of MHC class I HCs is indicated (R and S, respectively). Molecular weight markers are shown on the left. (B) Digestion-resistant and -sensitive class I forms were quantified by phosphoimaging and are presented as an R/S ratio. *Statistically significant difference between the C282Y mutants and the control cells (P < .05). Data are representative of 5 independent experiments, each performed with cells from one WT control blood donor and one C282Y homozygous patient with HH.
ER egress of MHC class I molecules is faster in C282Y mutant PBMCs
The previous results revealed a decreased MHC class I surface expression in C282Y mutant cells. In addition, the peptide loading occurs faster than in WT PBMCs. Then, this should be reflected in the rate of ER maturation of class I molecules. To analyze if the ER retention time for MHC class I complexes differed between C282Y mutant and WT cells, but also to determine whether diminished MHC class I cell-surface expression in mutant PBMCs was related to the rate of maturation or the transport of class I heterotrimers, immunoprecipitation experiments with the W6/32 mAb were done using 35S-methionine/cysteine–labeled cells. Only WT (control) and C282Y homozygous PBMCs were used in these experiments. Intracellular processing of MHC class I N-linked glycans and ER egress can be estimated from the conversion of immature HCs to mature Endo H-resistant molecules. Analysis of the data obtained revealed that after a 2.5-hour biosynthetic labeling, the majority of MHC class I molecules acquired Endo H resistance in C282Y homozygous cells (as indicated by the stronger intensity of the band with an apparent higher molecular weight, corresponding to the glycosylated form of the complex). In control cells only about one half of the complexes are Endo H resistant. No differences were observed in the Glycosidase F-digested complexes, suggesting that the reaction occurred with the same efficiency (Figure 6A). The W6/32-precipitated complexes treated with either Endo H or Glycosidase F were scanned with a phosphoimager and the results plotted as the ratio between the intensity of the glycosidase-resistant over the glycosidase-sensitive form. When compared to controls, C282Y homozygous cells showed a statistically significant higher proportion of Endo H-resistant MHC class I molecules (Figure 6B), indicating that in the mutant cells the ER egress of class I molecules occurs faster than in controls.
Reduced peptide stability of MHC class I molecules in C282Y homozygous cells
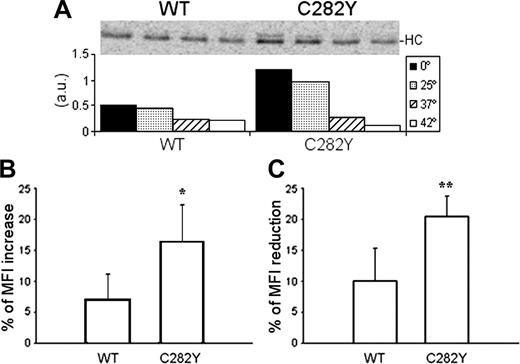
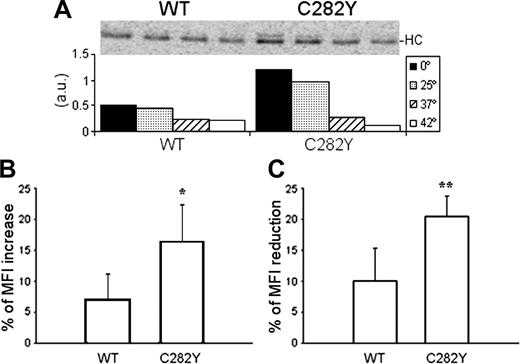
To investigate the thermostability of the MHC class I molecules (which is strictly related to the affinity of the bound peptide), cell lysates were incubated for 3 hours at 0°C, 25°C, 37°C, and 42°C and the class I complexes recovered with W6/32. As shown by the variation of the band intensity (Figure 7A), MHC class I molecules from C282Y homozygous cells are more sensitive to increasing temperatures. At 0°C and 25°C, C282Y mutant PBMCs have more assembled class I complexes. After incubation at 37°C the amount of recovered class I molecules decreases more than 70%, approximately to the same level of the WT cells, which show a 46% decrease. At 42°C only a small fraction of the assembled MHC molecules resist in the mutant cells.
Peptide stability and cell-surface turnover of MHC class I molecules. (A) After 2.5 hours of 35S-labeling, lysates from 10 × 106 cells were divided in 4 equal fractions and incubated at 0°C, 25°C, 37°C, and 42°C during 3 hours before W6/32 immunoprecipitation. The bars in the graph represent the intensity of each single band determined by phosphoimaging (a.u., arbitrary units). Representative data are from one experiment repeated 4 times in a total of 4 WT and 7 C282Y homozygous subjects with similar results. (B) PBMCs were cultured overnight at 25°C and 37°C before W6/32 surface staining. Results are presented as percentage of MFI increase of the cells cultured at 25°C. *Statistically significant difference between the C282Y and the WT cells (P < .05). Data compare 6 C282Y homozygous with 4 WT subjects. (C) W6/32 surface staining was performed before and after culturing WT and C282Y homozygous PBMCs for 5 hours in the presence of 20 μg/mL BFA. Results are presented as percentage of MFI reduction after the BFA treatment. *Statistically significant difference between the C282Y and the WT cells (P < .01). Data compare 8 C282Y homozygous with 6 WT subjects.
Peptide stability and cell-surface turnover of MHC class I molecules. (A) After 2.5 hours of 35S-labeling, lysates from 10 × 106 cells were divided in 4 equal fractions and incubated at 0°C, 25°C, 37°C, and 42°C during 3 hours before W6/32 immunoprecipitation. The bars in the graph represent the intensity of each single band determined by phosphoimaging (a.u., arbitrary units). Representative data are from one experiment repeated 4 times in a total of 4 WT and 7 C282Y homozygous subjects with similar results. (B) PBMCs were cultured overnight at 25°C and 37°C before W6/32 surface staining. Results are presented as percentage of MFI increase of the cells cultured at 25°C. *Statistically significant difference between the C282Y and the WT cells (P < .05). Data compare 6 C282Y homozygous with 4 WT subjects. (C) W6/32 surface staining was performed before and after culturing WT and C282Y homozygous PBMCs for 5 hours in the presence of 20 μg/mL BFA. Results are presented as percentage of MFI reduction after the BFA treatment. *Statistically significant difference between the C282Y and the WT cells (P < .01). Data compare 8 C282Y homozygous with 6 WT subjects.
Low temperatures (25°C) allow the cell-surface expression of class I HC/β2-m heterodimers without peptides.36 Compared with 37°C, overnight culture of C282Y and WT PBMCs at 25°C revealed a 16% increase of the MHC class I surface expression in the mutant cells, whereas WT PBMCs showed only a 7% increase (Figure 7B).
To investigate the surface stability of the MHC class I complexes, WT and C282Y homozygous PBMCs were treated with 20 μg/mL BFA.37 The MFI of the W6/32 staining before and after 5 hours of culture in the presence of BFA was compared (Figure 7C). In WT PBMCs, the BFA treatment reduced the MFI by 11%, whereas in C282Y cells the MFI was reduced by 20%, indicating a faster turnover of cell-surface MHC class I molecules in the mutant cells.
Discussion
Interest in the HFE C282Y mutation in HH has focused on the role of HFE in iron metabolism. Although earlier reports identified anomalies of T-cell subsets25,26 and of the CD8+ T-cell receptor repertoire in C282Y carriers,28 no direct HFE role in immunologic molecular mechanisms has been investigated so far. The present results constitute the first evidence for an impact of the C282Y HFE mutation in the MHC class I antigen presentation pathway. All experiments were done using ex vivo PBMCs from healthy blood donors or patients with HH at different stages of the phlebotomy treatment (Table S1). This underlines the biologic significance of the reported findings and separates them from the role of HFE in cellular iron metabolism. In addition, because no significant differences were observed in a series of experiments performed using PBMCs from the same patient with HH throughout the phlebotomies (data not shown), it is possible to exclude a possible effect of the repeated bleeding on the previous results. Despite the expected variability among the different subjects studied, the results were highly reproducible, excluding differences due to highly selected MHC class I alleles, which are known to behave differently with respect to assembly, class I loading, and ER egress.32,38 This was further confirmed by the analysis of the class I haplotype of the subjects studied (see Supplemental Table S2).
We have observed that C282Y mutant PBMCs obtained from patients with HH have decreased properly assembled MHC class I molecules surface expression in contrast to the increased levels of free class I HCs present on the membranes of these cells. The specificity of these observations is supported by the inexistence of CD4 and CD8 surface expression variation between control and mutant cells. Analyzing the intracellular folding of the class I molecules, we found altered levels of both properly β2-m–assembled and free MHC class I HCs. Whereas the C282Y mutants exhibited higher amounts of assembled class I molecules, the WT cells compensate for this by a marked excess of free MHC class I HCs. The data from the HLA-DR experiments revealed no differences between the WT and mutant cells. The impact of the C282Y mutation on the MHC class I intracellular trafficking is substantiated by the quantitative dependency of the HFE allele (C282Y homozygous or C282Y heterozygous versus controls) observed in the assembly of MHC class I molecules.
We show also that in mutant cells MHC class I molecules acquire Endo H resistance earlier, indicating that the ER egress occurs faster than in WT cells. The same happens with the peptide loading. We demonstrated that in mutant cells the assembly of class I heterotrimers occurs sooner than in control cells. Previous studies using BFA in cells containing a mutant form of MHC class I molecule (T134K) that fails to bind to TAP showed that the time spent by MHC class I complexes in the ER determines the extent of the peptide-loading optimization.39 The faster peptide loading and ER egress reported here may per se raise some questions about the stability of the class I heterotrimers formed in the C282Y mutant cells. The premature ER release of MHC class I molecules suggests that an incomplete peptide optimization occurs in C282Y mutant cells, which may account for the diminished stability and surface expression of MHC class I complexes. In fact, we show here that in C282Y mutants the peptide stability is lower and the turnover of surface expressed β2-m–assembled class I HCs is enhanced compared with that observed in the WT PBMCs. Apparently this is due to a premature dissociation of these molecules. Together with the lower β2-m–assembled and higher free MHC class I HC levels observed at the cell membrane of mutant cells, this result indicates that the extra pool of surface-expressed free class I HCs in the C282Y PBMCs results from the class I heterotrimers following peptide and β2-m dissociation.
All the findings reported in this study allow us to envisage some plausible models that could explain the abnormalities seen in the MHC class I pathway of C282Y mutant cells. In the first one, HFE itself would play a direct role in the maturation and quality control of MHC class I molecules. The interaction between HLA-DM and the MHC class II pathway constitutes a precedent of a well-studied example of peptide editing performed by a nonclassical MHC molecule.40 Viral subversion of the immune system involves the degradation or down-regulation of key proteins that participate in the antigen presentation pathways. Although most viral proteins specifically target MHC class I molecules, the human cytomegalovirus (HCMV) glycoprotein US2 was also shown to target HFE for proteasomal-mediated degradation.30,41 If HFE is involved in MHC class I maturation and peptide loading, this may explain why it deserves virus attention.
A second potential explanation excludes a direct role exerted by HFE, attributing the cause of the anomalies seen in MHC class I to the availability of molecular chaperones caused by the presence of the C282Y mutated HFE. The impairment of HFE correct folding, due to this mutation, could lead to a change in the levels of occupancy of molecular chaperones like calreticulin, calnexin, or ERp57. The mutation could also trigger the production of specific chaperones, such as heat shock proteins, that act to ensure the correct folding or, ultimately, proteasomal degradation of accumulated misfolded products. Being involved in MHC class I assembly, an altered degree of availability of these molecules would influence the intracellular state of class I molecules.
Whereas MHC class I molecules are present in all cell types, the HFE expression pattern is restricted. The antigen-presenting cells (APCs), monocytes, and macrophages (including Kupffer cells)42 are among the cells where HFE can be found. Unless another protein exists that could perform a similar role, the presumable function exerted by HFE may constitute a unique feature of the antigen presentation in these cells. We could speculate that APCs have developed specific attributes to improve the efficiency of antigen presentation in which HFE could be implicated. This will be tested with selected APCs.
The insufficient signaling by MHC class I-specific inhibitory receptors present on natural killer (NK) cells leads to activation and cytotoxicity against cells that are either MHC class I negative or deficient.43 The reported observation that C282Y mutants have decreased cell-surface expression of MHC class I molecules makes these cells suitable candidates for targeting by NK cells. A recent study revealed that down-regulation of MHC class I on resting lymphocytes was sufficient to make them susceptible to NK-cell killing.44 Besides, as MHC class I dictates the immune response of CD8+ CTLs, the reduction in the surface expression in C282Y mutant cells should result in a decreased CD8+ CTL activity. This has been shown previously in patients with HH.29
Our findings add a novel component to the complex pathway of antigen presentation, indicating that the C282Y HFE mutation, in addition to its effects in iron homeostasis, is associated with abnormal expression of MHC class I molecules and impaired class I antigen presentation pathway.
Prepublished online as Blood First Edition Paper, April 19, 2005; DOI 10.1182/blood-2004-12-4640.
Supported by grants from Innova/APBRF (United States) and FCT/Calouste Gulbenkian Foundation (Portugal). S.F.d.A. is recipient of a PhD fellowship funded by the National Foundation for Science and Technology (FCT, Portugal), SFRH/BD/11348/2002.
The online version of the article contains a data supplement.
The publication costs of this article were defrayed in part by page charge payment. Therefore, and solely to indicate this fact, this article is hereby marked “advertisement” in accordance with 18 U.S.C. section 1734.
We thank all clinicians, technical staff, and patients of the Hematology Service of the Santo António General Hospital for their support of the work. We wish to acknowledge in particular Dr G. Porto, the clinician in charge of the HH Clinic. Susana Almeida was responsible for the HFE genotyping.


