The zebrafish system is an excellent vertebrate genetic model to study hemostasis and thrombosis because saturation mutagenesis screens can identify novel genes that play a role in this vital physiologic pathway. To study hemostatic mutations, it is important to understand the physiology of zebrafish hemostasis and thrombosis. Previously, we identified zebrafish thrombocytes and have shown that they participate in arterial thrombus formation. Here, we recognized 2 populations of thrombocytes distinguishable by DiI-C18 (DiI) staining. DiI+ thrombocytes have a high density of adhesive receptors and are functionally more active than DiI– thrombocytes. We classified DiI+ thrombocytes as young and DiI– thrombocytes as mature thrombocytes. We found young and mature thrombocytes each formed independent clusters and that young thrombocytes clustered first. We have also shown that young thrombocytes initiate arterial thrombus formation. We propose that due to the increased adhesive receptor density on young thrombocytes, they adhere first to the subendothelial matrix, get activated rapidly, release agonists, and recruit more young thrombocytes, which further release more agonists. This increase in agonists activates the less active mature thrombocytes, drawing them to the growing thrombus. Since arterial thrombus formation is a fundamental hemostatic event, this mechanism may be conserved in mammals and may open new avenues for prevention of arterial thrombosis.
Introduction
The zebrafish system is an excellent model to study vertebrate development because of the transparency of embryos and the ability to perform saturation mutagenesis.1-3 This ability has been exploited to identify genes involved in other vertebrate-specific functions.4 We have recently adapted this model to study the genetics of thrombosis by developing an assay that measures the time to occlusion (TTO) of an injured vessel.5 Using this assay, we have isolated and continue to isolate mutants that have an abnormal TTO. However, to study the thrombosis mutations in zebrafish, understanding the physiologic events in the thrombotic process would be valuable. At present, we do not know the kinetics of recruitment of cells during arterial thrombus formation.6,7 In our earlier studies, we have shown by immunologic methods that thrombocytes have GpIIb/IIIa and GpIb receptors.8 By biochemical assays we have shown that the thrombocytes are activated in response to agonists such as collagen, adenosine diphosphate (ADP), and ristocetin.8 By labeling thrombocytes with a lipophilic dye DiI-C18 (DiI), we have also shown that the thrombocytes participate in arterial thrombosis in a model induced by laser injury of the dorsal aorta in zebrafish larvae.5,9 While developing these methods, we noticed that DiI did not completely label the entire population of thrombocytes; instead, it selectively labeled a group of thrombocytes with greater efficiency, and the other thrombocytes were labeled with decreasing intensities. The purpose of this study is to determine whether these various populations behave differently in arterial thrombus formation.
In this report, we studied the kinetics of recruitment of the DiI+ thrombocytes (that are most intensely labeled with DiI) and DiI– thrombocyte (unlabeled) populations. This study was readily feasible because in zebrafish thrombus formation, thrombocytes adhering to the vessel wall are readily seen due to the transparency of embryos/larvae, and large cell size in arterial thrombi.5 We found that DiI+ thrombocytes initiate arterial thrombus formation. We also showed that DiI+ thrombocytes have higher receptor content and activity than the DiI– thrombocytes and form clusters independently in in vitro aggregation reactions. By bromodeoxyuridine (BrdU) labeling methods, we have shown that DiI+ thrombocytes were the ones into which the label was incorporated and therefore are considered young thrombocytes. We have also found that DiI+ thrombocytes are stainable by thiazole orange (TO), suggesting that they may be similar to mammalian reticulated platelets. Thus, we classified DiI+ thrombocytes as young and DiI– thrombocytes as mature thrombocytes. We propose here that due to the increased adhesive receptor density on young thrombocytes, they adhere first to the subendothelial matrix, activate rapidly, release agonists, and recruit more young thrombocytes which further release more agonists. This increase in agonists activates the less active mature thrombocytes, drawing them into the growing thrombus.
Materials and methods
Labeling of thrombocytes
Thrombocytes were labeled in vivo9 by injecting into zebrafish 10 μL of the diluted solutions of either DiI-C18 (DiI) (10 μM), mepacrine (5 mM), TO (20 μM), or Oregon green BAPTA-1 (OG; 20 μM) in phosphate-buffered saline (PBS), prepared from stock solutions of 10 mM DiI (in dimethylformamide [DMF]), 10 mM mepacrine (in ethanol), 10 mM TO (in methanol), and 5 mM OG (in dimethyl sulfoxide [DMSO]) respectively. For double labeling, a combination of either DiI and mepacrine or DiI and OG was injected. To double label green fluorescent protein (GFP)–positive thrombocytes, we injected DiI into transgenic zebrafish where thrombocytes are selectively labeled with the green fluorescent protein under the GPIIb promoter. After 20 minutes, either blood was collected8 into an equal amount of heparin solution (20 mg/mL in PBS) at 25°C or the animal was used in arterial thrombosis experiments. The DiI+ thrombocytes were observed by fluorescence with excitation at 510 nm to 560 nm using a Nikon Optipnot phase-contrast fluorescence microscope equipped with 10×/0.25, 20×/0.40, or 40×/0.75 objective lenses and a 10× eyepiece (Nikon, Melville, NY). Images were captured using a Nikon Coolpix 995 CCD camera.9 Mepacrine- and OG-labeled thrombocytes and dually labeled thrombocytes were observed by fluorescence with excitation at 450 nm to 490 nm.9 Confocal images were obtained as described previously.5 The cells were observed in a smear or under a cover slip using a 20×/0.70 UPlanApo objective lens on an Olympus FV500 confocal microscope (Olympus, Melville, NY). Images were analyzed with Metamorph 6.1 software (Universal Imaging, Downington, PA).
Labeling of human platelets
Human blood was obtained by self collection from a finger prick. For this procedure, approval was not required according to the institutional review board of The University of Texas Health Science Center at San Antonio. To 20 μL human blood collected in citrated tubes, 4 μL DiI and TO were added to a final concentration of 0.02 nM.
BrdU labeling of cells to identify newly synthesized thrombocytes
A stock solution of BrdU (Sigma, St Louis, MO) was prepared at 5 mg/mL. Zebrafish were injected with BrdU at a dose of 100 mg/kg body weight in PBS.10 After 24 hours, DiI was injected and 20 minutes later blood was collected. The cells were then permeabilized using Triton X-100 at a concentration of 0.1%, smeared on a slide, and treated with 40 μL anti-BrdU/DNase fluorescein isothiocyanate (FITC; Becton Dickinson Immunocytometry Systems, San Jose, CA) at a dilution of 1:5 in PBS per slide and incubated for 30 minutes at 4°C. They were finally rinsed with PBS and observed under a fluorescence microscope with excitation at 450 nm to 490 nm.
Flow cytometry and electron microscopy
Zebrafish blood (50 μL) containing thrombocytes dual labeled with DiI and mepacrine was placed in 100 μL electron microscopy (EM) fixative,11 and gently layered on 800 μL Lymphoprep (Sigma) and spun at 800g for 3 minutes. The top layer (approximately 100 μL-150 μL) was centrifuged at 5000g for 5 minutes and the thrombocyte pellet was resuspended in PBS. Cells were then sorted by fluorescence-activated cell sorting (FACS) and subjected to electron microscopy using a Philips 208 transmission electron microscope (Philips, Hillsboro, OR) equipped with an AMT digital imaging system (Advanced Microscopy Techniques, Danvers, MA).8
Estimation of GPIIb/IIIa and GPIb on thrombocytes
For detecting GPIIb/IIIa and GPIb, 20 μL heparinized blood from DiI- and TO-injected fish, respectively, were used. The blood was fixed with an equal volume of fixative, centrifuged at 2000g for 5 minutes, and the pellet was washed in PBS and resuspended in 30 μL PBS, 15 μL primary antibody at 1:40 dilution (polyclonal sheep anti–human GPIIb/IIIa 10 mg/mL was from Affinity Biologicals, Hamilton, ON, Canada; polyclonal GPIb rabbit antihuman antibody 1 mg/mL was a gift from Jose Lopez, Baylor College of Medicine) was added and incubated for 30 minutes at 4°C. The cells were washed, resuspended, and probed with a secondary antibody (anti–sheep immunoglobulin G (IgG) FITC, 1 mg/mL for GPIIb/IIIa from Sigma, and anti–rabbit IgG tetramethylrhodamine isothiocyanate [TRITC], 2 mg/mL for GPIb from Jackson Immuno Research Laboratories, West Grove, PA) at a 1:100 dilution as described earlier in this paragraph. The cells were again washed, resuspended in 30 μL PBS, and were either smeared on a slide or kept under a cover slip and fluorescent images of thrombocytes were taken. Nonimmune sheep or rabbit IgG and omission of primary antibody were used as negative controls.8 The images of a number of thrombocytes were taken keeping the exposure times constant. The average intensity per pixel was calculated from the total intensity of a thrombocyte and the total number of pixels and was plotted as the levels of the receptor. The quantifications were performed by using SigmaScan Pro 5.0 software.9 The above polyclonal antibodies were verified for their specificity by FACS analysis.
Estimation of P-selectin and annexin-V binding after thrombocyte activation
For detecting P-selectin and annexin-V binding, cells from heparinized blood (20 μL) collected from TO- and DiI-injected fish, respectively, were used. For the P-selectin experiment, blood cells from TO-injected zebrafish were washed in PBS and resuspended in 60 μL PBS. To this suspension, 5 μL of 200 μM ADP or 5 μL PBS as control was added and the cells were incubated for 3 minutes at 25°C. The cells were fixed immediately and processed for probing with rabbit anti–human polyclonal P-selectin antibody (500 μg/mL) at a 1:10 dilution (Becton Dickinson, Palo Alto, CA) followed by probing with anti–rabbit IgG TRITC as described in the previous paragraph. For annexin V binding, the blood cells from DiI-injected zebrafish were washed, activated with ADP, fixed, and washed as described earlier in this paragraph. The fixed cells were resuspended in 20 μL PBS. To this suspension 80 μL of 1X annexin binding buffer and 15 μL annexin V–FITC (Becton Dickinson) were added and incubated in the dark at 25°C. After P-selectin and annexin V probing, the cells were washed, resuspended, smeared on a slide or kept under a cover slip, and the fluorescent images of thrombocytes were analyzed as described.
Measurement of calcium release
Heparinized blood (1.5 μL) labeled with DiI and OG was layered on a precleaned glass slide, a 5 × 5-mm cover slip was placed, and the surrounding area of the cover slip was marked with a PAP pen (Daido Sangyo, Tokyo, Japan). A single attached thrombocyte (either dual labeled with DiI and OG or labeled with OG alone) was examined under a fluorescence microscope at an excitation/emission wavelength of 494 nm/523 nm and the basal fluorescence was recorded for one minute using a digital camera connected to a VHS recorder. Then 5 μL ADP (100 μM) was placed on the edge of the cover slip inside the line drawn by the PAP pen such that the agonist diffused under the cover slip to reach the immobile thrombocyte. CaCl2 was maintained in the buffer at a concentration of 1 mM and calcium release was recorded for 5 minutes. Images from these recordings were captured at 10-second intervals using a digital converter and scanned for average green intensity.9 The intensities were then plotted as a function of time.
Time course of thrombocyte cluster formation
Blood (4 μL) collected from zebrafish injected with DiI and mepacrine was mixed with 1 μL of 3.8% sodium citrate. Citrated blood (1 μL) was added to 5 different wells in a Nunc microtiter plate containing conical wells with round bottoms (10 μL capacity). The wells contained 8 μL citrate buffer (0 × 63% sodium citrate in PBS) and 1 μL of 50-μM ADP. Samples from different wells were sequentially collected at 1-, 2-, 3-, 5-, and 10-minute intervals and fixed immediately. They were then observed under a fluorescence microscope and the red, green, and orange clusters were quantified.
In vivo arterial thrombosis
The DiI- and mepacrine-injected zebrafish were placed on a microscopic slide under a fluorescence microscope, after anesthesia with Tricaine (10 μM) solution.9 An arterial thrombus was induced in a tail arteriole using a light beam from a nitrogen-pulsed laser passed through coumarin 440 dye (445 nm; MicroPoint Laser system, Photonic Instruments, St Charles, IL) for 5 seconds at 15 pulses/second with a laser intensity setting of 10. Thrombus formation observed by fluorescence with excitation at 450 nm to 490 nm was recorded using a digital camera attached to a VHS recorder and a monitor (video).5
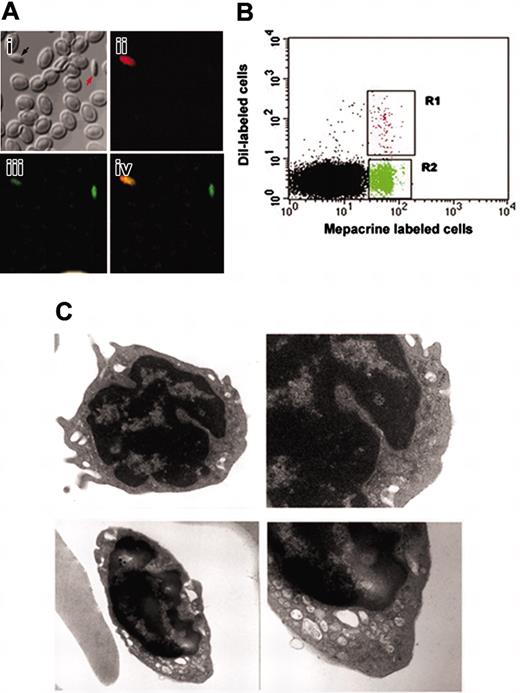
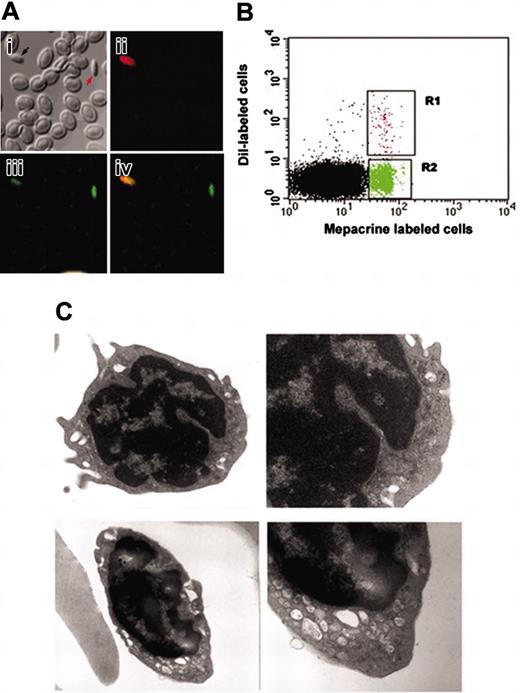
Characterization of 2 populations of thrombocytes in zebrafish. (A) The subpanels correspond to (i) confocal images of zebrafish thrombocytes using bright field, (ii) B-2 filter (showing DiI fluorescence), (iii) G-2A filter (showing mepacrine fluorescence), and (iv) the composite of images (orange shows dual labeling by DiI and mepacrine) acquired by B-2 and G-2A filters. (B) The panels show forward and side scattering of FACS-sorted, mepacrine-labeled (green) and DiI-labeled (red) thrombocytes, respectively. (C) Top and bottom panels represent electron micrographs of FACS-sorted, DiI-labeled and mepacrine-labeled thrombocytes, respectively (original magnifications: left panels, ×18 000; right panels, ×36 000).
Characterization of 2 populations of thrombocytes in zebrafish. (A) The subpanels correspond to (i) confocal images of zebrafish thrombocytes using bright field, (ii) B-2 filter (showing DiI fluorescence), (iii) G-2A filter (showing mepacrine fluorescence), and (iv) the composite of images (orange shows dual labeling by DiI and mepacrine) acquired by B-2 and G-2A filters. (B) The panels show forward and side scattering of FACS-sorted, mepacrine-labeled (green) and DiI-labeled (red) thrombocytes, respectively. (C) Top and bottom panels represent electron micrographs of FACS-sorted, DiI-labeled and mepacrine-labeled thrombocytes, respectively (original magnifications: left panels, ×18 000; right panels, ×36 000).
Results
We recently found that DiI, a lipophilic dye, selectively labels one population of thrombocytes (Figure 1A),9 leaving the other population unlabeled. There was a gradation of DiI labeling intensity in thrombocytes where the most intensely DiI-labeled population had long filopodial extensions, and the less intensely labeled DiI thrombocytes had relatively smaller filopodial extensions. We found at low concentrations of DiI that there are approximately 10% DiI+ thrombocytes. As a first step for characterizing these 2 populations (DiI+ and DiI–) of thrombocytes in vivo, separation of the 2 populations was needed. When mepacrine was injected into zebrafish blood, we found that mepacrine, which has been used to label human platelets,12 labeled the entire population of zebrafish thrombocytes fluorescent green. Red cells also were labeled with mepacrine, but underwent photobleaching more rapidly than thrombocytes. Thus, when using both DiI and mepacrine, the DiI+ thrombocytes were orange and the unlabeled thrombocytes were green using a 450 nm to 490 nm excitation wavelength. Ficoll/hypaque gradients were used to initially enrich fixed thrombocytes (both DiI+ and DiI–) from the other blood cells. Subsequently, FACS was used to separate these 2 populations of thrombocytes (Figure 1B).
To test whether there are any significant differences between DiI+ thrombocytes and the DiI– thrombocytes, we compared their ultrastructure by transmission electron microscopy. Both the DiI+ and DiI– thrombocytes showed the presence of granules similar to the size of glycogen granules, rough endoplasmic reticulum, and mitochondria (Figure 1C). Young thrombocytes contained more rough endoplasmic reticulum. The presence of more extensive rough endoplasmic reticulum in DiI+ thrombocytes compared to DiI– thrombocytes suggests that protein synthesis is more active. We also found more extensions of filopodia in the young thrombocytes than in the mature thrombocytes (Figure 1C), suggesting that they have been more rapidly activated.
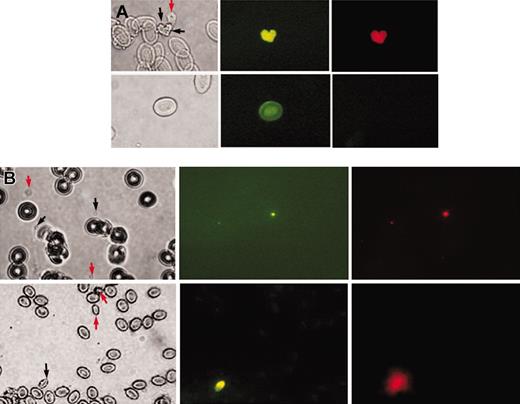
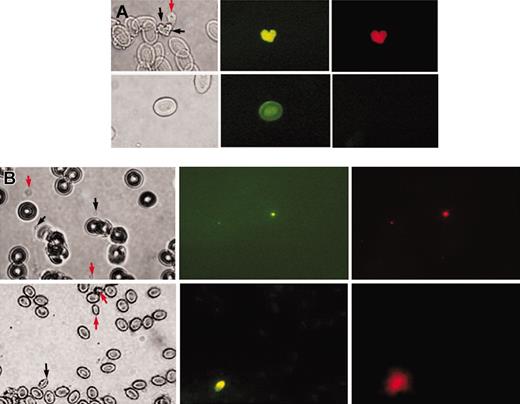
The finding that the DiI+ thrombocytes have higher levels of rough endoplasmic reticulum and filopodia suggested that the DiI+ and DiI– thrombocyte populations may correspond to young (reticulated) and mature platelets in humans. Therefore, we determined which of these 2 zebrafish thrombocyte populations corresponded to young platelets. To provide evidence that the DiI+ thrombocytes are younger, we injected BrdU, a standard marker that detects cells with newly synthesized DNA.10 At 24 hours after injection of BrdU, we reinjected the fish with DiI and collected blood 20 minutes later to test which of the 2 populations of thrombocytes was labeled by BrdU. We found that all BrdU-labeled thrombocytes, as detected by antibodies against BrdU, were DiI+ (Figure 2A). The DiI– cells did not have any BrdU labeling. Occasionally, we also found incorporation of BrdU into nucleated red cells that are probably their precursors. These results confirmed that the DiI-labeled cells are young, newly synthesized thrombocytes.
In mammals, TO, a nucleic acid intercalating dye, is used to selectively label young platelets because young platelets contain more RNA, thus differentiating them from mature platelets. To assess whether DiI also selectively labels young platelets, we used human platelets that are labeled with TO to see their susceptibility to DiI labeling. We found that DiI specifically labels young human platelets (Figure 2Bi), suggesting that the DiI-labeled thrombocytes correspond to young platelets. As a corollary experiment we wanted to label zebrafish thrombocytes with TO. However, zebrafish thrombocytes are nucleated as are the other fish blood cells. Therefore, all nuclei will label with TO to some extent. Since nuclei are common to all fish blood cells and if young thrombocytes make more RNA than the mature thrombocytes, higher levels of RNA should be indicated by increased TO binding. We found that all DiI+ thrombocytes were stained by TO, suggesting that the DiI+ thrombocytes correspond to young thrombocytes (Figure 2Bii), and the extent of TO labeling correlated with DiI intensity. The DiI– mature thrombocytes and other blood cells labeled faintly with TO, due to the presence of a nucleus. However, most of this nuclear fluorescence faded away quickly due to a photobleaching reaction, facilitating the identification of TO-positive thrombocytes, which remain brightly fluorescent. We have also performed FACS on dual-labeled thrombocytes with TO and DiI and found similar results (data not shown).
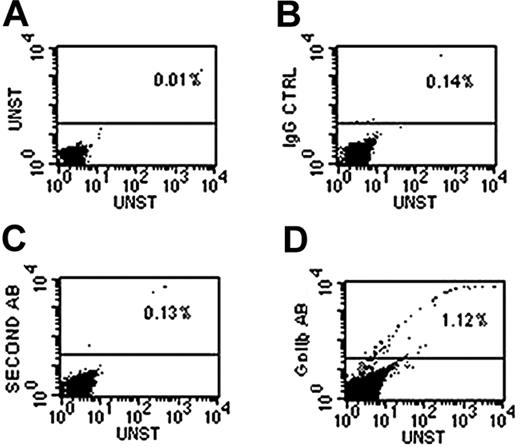
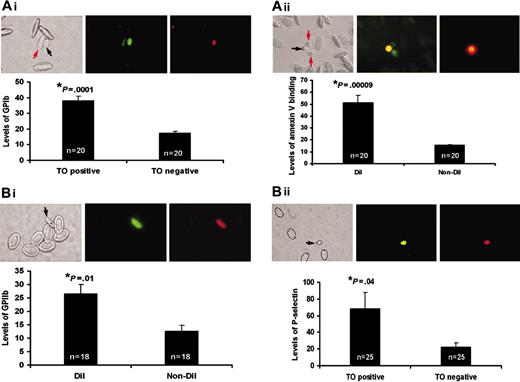
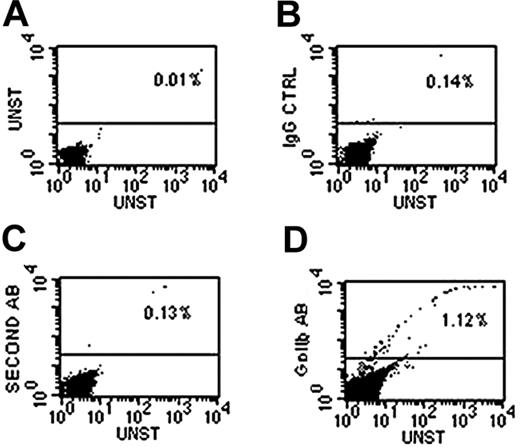
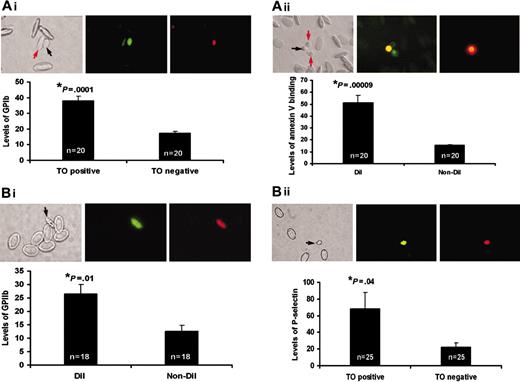
To identify the differences in surface receptor density and functional activity between young and mature thrombocyte populations, we used polyclonal antibodies against human GPIIb/IIIa (the fibrinogen receptor that ultimately facilitates platelet aggregation) and GPIb (an adhesive receptor involved in platelet adherence to subendothelial matrix). In our earlier studies, we used these polyclonal antibodies and found that they bind to fish thrombocytes by immunohistochemical methods. However, we have not established the specificity of these antibodies by an alternate method. Therefore, to confirm the specificity of the antibody reactions, we have used FACS analysis. FACS analysis for GPIIb using polyclonal antibody (Figure 3) revealed that approximately 1% to 2% of total blood cells are detected by these antibodies, which is consistent with estimates obtained by fluorescence microscopy. Similar results were obtained with GPIb antibodies. Fluorescence microscopy was used to estimate the relative densities of these receptors on the thrombocytes by measuring pixel intensities of their fluorescent images. We analyzed 18 to 20 independent images and the average intensities of these images were plotted to represent levels of receptors. We found that the young thrombocytes had approximately 2 times more pixel intensity than mature thrombocytes, suggesting that young thrombocytes have higher receptor densities (Figure 4Ai,ii). Omission of primary antibody, and isotype-matched IgG in place of primary antibody, were used as controls. Control thrombocytes did not show any immunofluorescence (data not shown). The size of thrombocytes did not interfere in this analysis because the method used measured intensity per pixel and not the total intensity of the thrombocyte. Thus, the results presented here are unlike earlier work with human platelets, where it was thought that the larger size of the young platelets might be responsible for the observed larger number of receptors.
Young zebrafish thrombocytes. (A) Demonstration of newly synthesized young thrombocytes. Top row shows images of zebrafish thrombocytes (young and mature thrombocytes are marked by black and red arrows, respectively); bottom row, red cells. From left to right are the images under bright field, fluorescence with excitation at 450 nm to 490 nm (BrdU uptake shown by anti-BrdU FITC green fluorescence), and fluorescence with excitation at 510 nm to 560 nm (DiI red fluorescence) using a Nikon Optiphot phase-contrast fluorescence microscope. (B) Comparison of young thrombocytes with young human platelets. Top row shows images of human platelets; bottom row, images of zebrafish thrombocytes. Images from left to right are under bright field, fluorescence with excitation at 450 nm to 490 nm (TO fluorescence) and fluorescence with excitation at 510 nm to 560 nm (DiI fluorescence) using a Nikon Optiphot phase-contrast fluorescence microscope. Black arrows show young thrombocytes and young human platelets and red arrows show mature thrombocytes and mature human platelets. The other cells in the field are zebrafish erythrocytes (bottom row) or human red cells (top row).
Young zebrafish thrombocytes. (A) Demonstration of newly synthesized young thrombocytes. Top row shows images of zebrafish thrombocytes (young and mature thrombocytes are marked by black and red arrows, respectively); bottom row, red cells. From left to right are the images under bright field, fluorescence with excitation at 450 nm to 490 nm (BrdU uptake shown by anti-BrdU FITC green fluorescence), and fluorescence with excitation at 510 nm to 560 nm (DiI red fluorescence) using a Nikon Optiphot phase-contrast fluorescence microscope. (B) Comparison of young thrombocytes with young human platelets. Top row shows images of human platelets; bottom row, images of zebrafish thrombocytes. Images from left to right are under bright field, fluorescence with excitation at 450 nm to 490 nm (TO fluorescence) and fluorescence with excitation at 510 nm to 560 nm (DiI fluorescence) using a Nikon Optiphot phase-contrast fluorescence microscope. Black arrows show young thrombocytes and young human platelets and red arrows show mature thrombocytes and mature human platelets. The other cells in the field are zebrafish erythrocytes (bottom row) or human red cells (top row).
We characterized differences in the functional activity between these young and mature thrombocytes. Since annexin V binding and P-selectin expression are well-established markers for platelet activation, we measured annexin V binding using FITC–annexin V and P-selectin expression, by P-selectin antibody binding, after adding ADP as an agonist to washed thrombocytes (Figure 4Bi,ii). We analyzed 20 to 25 independent images and the average intensities of these images were plotted to represent levels of P-selectin or annexin V binding indicating functional activity. P-selectin and FITC–annexin V did not show any observable binding before ADP activation. The P-selectin antibody specificity was also verified by FACS, similar to the GpIIb and GpIb antibodies as described in the previous paragraph. The results showed greater activation of young thrombocytes than mature thrombocytes. Controls without ADP did not show functional activity (data not shown). Similarly, we compared these 2 types of thrombocytes for their ability to release calcium in response to ADP. We measured calcium release in individual thrombocytes in response to agonists using a calcium indicator dye, OG. Immobilization of thrombocytes to a surface was required for these studies.13 Zebrafish thrombocytes were allowed to attach to glass slides during studies of time-dependent calcium release. These studies revealed that the DiI+ thrombocytes released more calcium than the unlabeled thrombocytes (Figure 5). The time taken to initiate the calcium release from the time of ADP addition was approximately 30 seconds, probably due to the time taken for ADP to diffuse through the media under the cover slip. Thus, we have shown both the density of receptors and functional activity in young thrombocytes are significantly greater than those found in mature thrombocytes.
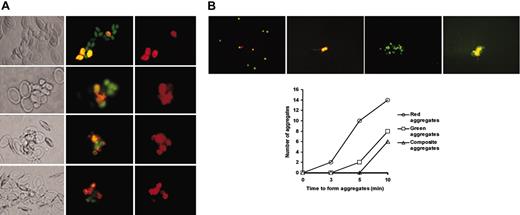
Since young thrombocytes possess relatively higher amounts of GPIb and GPIIb/IIIa, and have more calcium release on activation, we hypothesized that young thrombocytes may tend to cluster together. To test this, we performed whole blood thrombocyte aggregation and found separate clusters of young (DiI- and mepacrine-labeled) and mature (mepacrine-labeled) thrombocytes in thrombocyte aggregates (Figure 6A). To analyze whether young thrombocyte clusters may be formed first, we incubated whole blood with low concentrations of ADP and, at different time points, observed which clusters formed first. Within the first 3 minutes, we found young thrombocyte clusters composed of 2 to 4 thrombocytes. At 5 minutes these small clusters of young thrombocytes increased in number, while at the same time larger clusters (15 to 20 thrombocytes) of mature thrombocytes appeared. Subsequently, in the 10-minute reaction large composite clusters were also seen (Figure 6B).
Representative dot plots demonstrating presence of GPIIb-positive cells in whole blood detected by the use of a polyclonal antibody against human GPIIB and a TRITC-conjugated second antibody. All cell populations were included in the gate. Graphs depict (A) unstained control, (B) IgG control, (C) second antibody alone control, and (D) GPIIb antibody staining. The TRITC fluorescence of the second antibody was measured in FL2 channel shown on the y-axis, and the percentages of GPIIb-positive cells are shown above the horizontal line.
Representative dot plots demonstrating presence of GPIIb-positive cells in whole blood detected by the use of a polyclonal antibody against human GPIIB and a TRITC-conjugated second antibody. All cell populations were included in the gate. Graphs depict (A) unstained control, (B) IgG control, (C) second antibody alone control, and (D) GPIIb antibody staining. The TRITC fluorescence of the second antibody was measured in FL2 channel shown on the y-axis, and the percentages of GPIIb-positive cells are shown above the horizontal line.
Comparison of young and mature thrombocytes. (A)Measurement of receptor densities of young and mature thrombocytes. (i) From left to right, this panel shows a representative bright field image, TO fluorescence (green), and TRITC fluorescence (corresponding to expression of GPIb) of a young thrombocyte (shown by black arrow). A mature thrombocyte is shown by a red arrow. Bar graph shows the relative levels of GPIb (TRITC fluorescence) on the TO-positive young and TO-negative mature thrombocytes (data collected from 20 different thrombocytes from multiple images shown as n = 20). (ii) From left to right, this panel shows a representative bright field image, DiI fluorescence (red), and FITC fluorescence (corresponding to expression of GPIIb) of a young thrombocyte (shown by arrow). Bar graph shows the relative levels of GPIIb (FITC fluorescence) on the DiI-labeled young thrombocytes and mature (non-DiI) thrombocytes (data collected from 18 different thrombocytes from multiple images shown as n = 18). (B) Measurement of functional activity of young and mature thrombocytes by annexin V binding and P-selectin levels. (i) From left to right, this panel shows a bright field image, green annexin FITC fluorescence (corresponding to expression of phosphatidyl serine), and DiI fluorescence of a young thrombocyte (shown by black arrow). Orange fluorescence in the annexin-FITC image is due to dual labeling of the young thrombocyte by FITC and DiI. Bar graph shows the relative levels of phosphatidyl serine (FITC fluorescence) on the DiI-labeled young thrombocytes and mature (non-DiI) thrombocytes. Mature thrombocytes are shown by red arrows. (ii) From left to right, this panel shows a bright field image, TO fluorescence (green), and TRITC fluorescence (corresponding to expression of P-selectin) of a young thrombocyte (shown by black arrow). Bar graph shows the relative levels of P-selectin (TRITC fluorescence) on the TO-positive young and TO-negative mature thrombocytes. A mature thrombocyte is shown by a red arrow.
Comparison of young and mature thrombocytes. (A)Measurement of receptor densities of young and mature thrombocytes. (i) From left to right, this panel shows a representative bright field image, TO fluorescence (green), and TRITC fluorescence (corresponding to expression of GPIb) of a young thrombocyte (shown by black arrow). A mature thrombocyte is shown by a red arrow. Bar graph shows the relative levels of GPIb (TRITC fluorescence) on the TO-positive young and TO-negative mature thrombocytes (data collected from 20 different thrombocytes from multiple images shown as n = 20). (ii) From left to right, this panel shows a representative bright field image, DiI fluorescence (red), and FITC fluorescence (corresponding to expression of GPIIb) of a young thrombocyte (shown by arrow). Bar graph shows the relative levels of GPIIb (FITC fluorescence) on the DiI-labeled young thrombocytes and mature (non-DiI) thrombocytes (data collected from 18 different thrombocytes from multiple images shown as n = 18). (B) Measurement of functional activity of young and mature thrombocytes by annexin V binding and P-selectin levels. (i) From left to right, this panel shows a bright field image, green annexin FITC fluorescence (corresponding to expression of phosphatidyl serine), and DiI fluorescence of a young thrombocyte (shown by black arrow). Orange fluorescence in the annexin-FITC image is due to dual labeling of the young thrombocyte by FITC and DiI. Bar graph shows the relative levels of phosphatidyl serine (FITC fluorescence) on the DiI-labeled young thrombocytes and mature (non-DiI) thrombocytes. Mature thrombocytes are shown by red arrows. (ii) From left to right, this panel shows a bright field image, TO fluorescence (green), and TRITC fluorescence (corresponding to expression of P-selectin) of a young thrombocyte (shown by black arrow). Bar graph shows the relative levels of P-selectin (TRITC fluorescence) on the TO-positive young and TO-negative mature thrombocytes. A mature thrombocyte is shown by a red arrow.
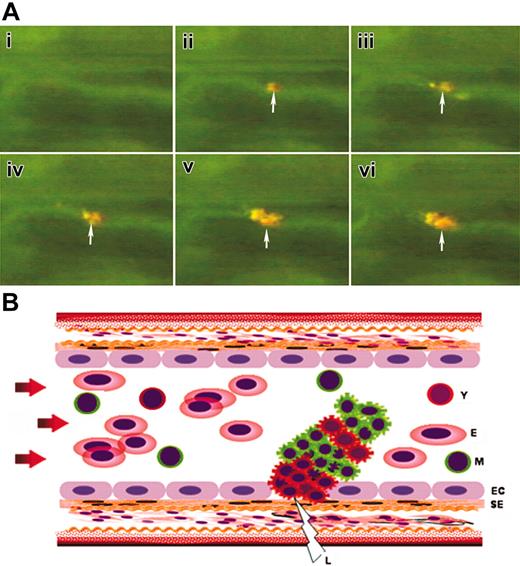
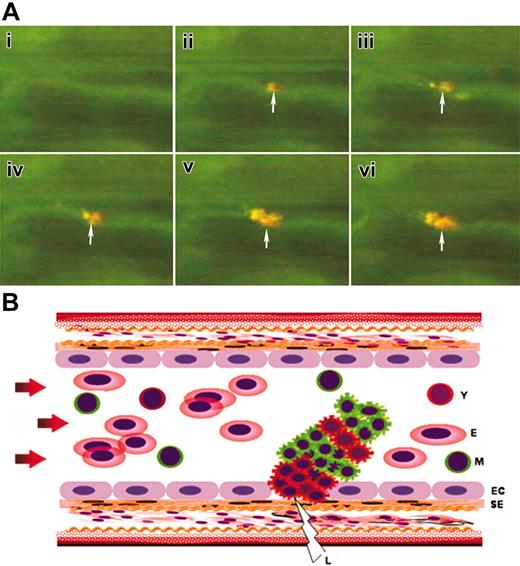
This result is consistent with the finding described in the previous paragraph that young thrombocytes are functionally more active in vitro. Therefore, we theorized that because young thrombocytes have more adhesive receptors, they may come to the wound site first and form the initial aggregates. To elucidate which population of thrombocytes comes to the site of arterial thrombus formation first, we carried out the following in vivo studies. We differentially labeled young and mature thrombocytes by 2 independent methods. In the first method, we injected both DiI and mepacrine. In the second method we injected DiI into a transgenic zebrafish where only thrombocytes are labeled with the green fluorescent protein under the GPIIb promoter (GFP-zebrafish).14 In both of these experiments, it was possible to distinguish 2 populations of thrombocytes when observed under the fluorescence microscope. We then caused injury to zebrafish tail arterioles (20 different arterioles) by laser. We found that in all the arterioles, the young thrombocytes (double-labeled DiI+ plus mepacrine or GFP+) were the first ones seen at the site of laser injury forming initial clusters at the vessel wall, followed by mature thrombocytes (mepacrine or GFP+ alone). A representative video recording of the stepwise recruitment of 2 types of thrombocytes is given in Movie S1 showing initial orange cells (DiI+ plus mepacrine or GFP+) followed by green fluorescent cells in the growing thrombus (Supplemental Movie S1, available on the Blood website; see the Supplemental Movie link at the top of the online article). Figure 7A shows the time-lapse images of the growing thrombus retrieved from the video. Since the recording was performed under the fluorescence microscope, there was a possibility that a cell other than thrombocytes such as leukocytes or red cells may come to the injured site first. To rule out this possibility, we recorded the initiation of the thrombus in the GFP-zebrafish under very low white light and fluorescent light (excitation at 450 nm to 490 nm) simultaneously since in this fish only thrombocytes show green fluorescence and other leukocytes and red cells are nonfluorescent. We observed that the first cells attaching were only GFP+ thrombocytes. No other nonfluorescent cells were observed first at the site of injury (data not shown). Figure 7B shows the schematic representation of young and mature thrombocytes participating in arterial thrombus formation.
Measurement of calcium release by young and mature thrombocytes. The left picture panel shows 3 rows of timed images of ADP-induced calcium release monitored by OG fluorescence of a single DiI-labeled thrombocyte. The top row of this panel has images taken at 5, 15, 25, 35, and 45 seconds; the middle row has images taken at 55, 65, 75, 85, and 95 seconds; and the bottom row has images taken at 105, 115, 125, 135, and 145 seconds, as shown from left to right, respectively. The intensities from these images were plotted (red diamonds) on the graph in the right panel. Arrows show the time of ADP addition. Green squares indicates the unlabeled thrombocyte for which the timed images are not shown.
Measurement of calcium release by young and mature thrombocytes. The left picture panel shows 3 rows of timed images of ADP-induced calcium release monitored by OG fluorescence of a single DiI-labeled thrombocyte. The top row of this panel has images taken at 5, 15, 25, 35, and 45 seconds; the middle row has images taken at 55, 65, 75, 85, and 95 seconds; and the bottom row has images taken at 105, 115, 125, 135, and 145 seconds, as shown from left to right, respectively. The intensities from these images were plotted (red diamonds) on the graph in the right panel. Arrows show the time of ADP addition. Green squares indicates the unlabeled thrombocyte for which the timed images are not shown.
Thrombocyte clustering. (A) Thrombocyte clustering in zebrafish blood and initial recruitment of young thrombocytes at the site of injury. Top to bottom, the panels show 4 independent thrombocyte clusters. Left to right, the panels represent a bright field image, a fluorescent image when using B-2 filter cube (shows DiI-labeled thrombocytes and mepacrine-labeled thrombocytes as green or orange), and a fluorescent image when using G-2A filter (DiI-labeled thrombocytes). (B, top) Kinetics of thrombocyte clustering. Panels of fluorescent images from left to right show the representative sizes of thrombocyte aggregates formed after ADP activation. Individual thrombocytes (orange and green), small orange aggregates, large green aggregates, and composite aggregates are shown at 0, 3, 5, and 10 minutes, respectively. At 5 and 10 minutes, small orange and large green aggregates are also seen but are not shown here. (Bottom) The graph shows the number of different types of aggregates obtained over a 10-minute period.
Thrombocyte clustering. (A) Thrombocyte clustering in zebrafish blood and initial recruitment of young thrombocytes at the site of injury. Top to bottom, the panels show 4 independent thrombocyte clusters. Left to right, the panels represent a bright field image, a fluorescent image when using B-2 filter cube (shows DiI-labeled thrombocytes and mepacrine-labeled thrombocytes as green or orange), and a fluorescent image when using G-2A filter (DiI-labeled thrombocytes). (B, top) Kinetics of thrombocyte clustering. Panels of fluorescent images from left to right show the representative sizes of thrombocyte aggregates formed after ADP activation. Individual thrombocytes (orange and green), small orange aggregates, large green aggregates, and composite aggregates are shown at 0, 3, 5, and 10 minutes, respectively. At 5 and 10 minutes, small orange and large green aggregates are also seen but are not shown here. (Bottom) The graph shows the number of different types of aggregates obtained over a 10-minute period.
Kinetics of thrombocyte recruitment of growing thrombus. (A) Time-lapse images captured from the real-time video of thrombus formation in zebrafish. Arrows mark the initiation of thrombus. Orange and greenish-yellow colors in the thrombus represent the dual dye-labeled and single dye-labeled thrombocytes/platelets respectively. (B) Schematic representation of growing thrombus (corresponding to time-lapse images shown in panel A) in an artery with initiating young thrombocyte (Y) clusters at the site of laser injury (L) followed by mixture of Y and mature thrombocyte (M) clusters. EC indicates endothelial cell; SE, subendothelial matrix; E, erythrocytes. Arrows show the direction of blood flow.
Kinetics of thrombocyte recruitment of growing thrombus. (A) Time-lapse images captured from the real-time video of thrombus formation in zebrafish. Arrows mark the initiation of thrombus. Orange and greenish-yellow colors in the thrombus represent the dual dye-labeled and single dye-labeled thrombocytes/platelets respectively. (B) Schematic representation of growing thrombus (corresponding to time-lapse images shown in panel A) in an artery with initiating young thrombocyte (Y) clusters at the site of laser injury (L) followed by mixture of Y and mature thrombocyte (M) clusters. EC indicates endothelial cell; SE, subendothelial matrix; E, erythrocytes. Arrows show the direction of blood flow.
Discussion
In this study, we established kinetics of thrombocyte recruitment in arterial thrombus formation by selectively labeling the young and mature thrombocytes with different dyes. Even though the mechanism of DiI labeling is not known, DiI selectively labels young thrombocytes. It is possible that the higher densities of adhesive receptors may somehow be involved in enhancing DiI binding to membrane phospholipids. However this does not in itself explain the specificity of DiI labeling. We believe that the conformation of lipid rafts, altered by the high densities of receptors, may offer this specificity.9 However, this requires further investigation. Interestingly, the specificity of TO labeling to young thrombocytes is similar to that observed in reticulated platelets, which are young platelets in mammals.15 It has been postulated that TO labeling is due to the higher levels of RNA present in mammalian platelets. However, fish thrombocytes have nuclei and both nuclear DNAs and cytoplasmic RNA will bind TO. Since DNA is constant in thrombocytes, more intensely TO–labeled thrombocytes should have more RNA. Thus, our data on TO staining of young thrombocytes are consistent with the TO staining of young platelets despite the fact that thrombocytes are nucleated. In this report we have shown the DiI-labeled thrombocytes are young thrombocytes by 3 criteria: (1) the DiI that labels young thrombocytes also labels young platelets, (2) TO that labels young platelets also labels young thrombocytes, and (3) BrdU labeling also showed that the DiI cells are young.
Previous studies in platelets suggested that young platelets have more receptors. It has been argued that this is due to the larger size of the young platelets, although the density of the receptors per unit surface area of the platelets has not been calculated. In this study, we measured the pixel intensities as a relative measure of the receptor density, and thus, the size of the thrombocyte should not be a confounding factor in our analysis. We have also shown that young thrombocytes are functionally more active than mature thrombocytes by 3 independent criteria, namely P-selectin levels, annexin V binding, and release of calcium after ADP activation.
The observation of independent clustering of young and mature thrombocytes is novel. We do not know the physiologic relevance of such clustering, although the initial clustering of young thrombocytes could be explained by the fact that the young thrombocytes are activated more rapidly than mature thrombocytes. However, in the growing thrombus, after the initial clustering of young thrombocytes followed by mature thrombocytes some more young thrombocyte clusters form followed again by mature thrombocyte clusters. We propose that such mosaic formation of young and mature thrombocytes in the thrombus may provide stability and mechanical strength to the thrombus. In in vitro clustering, the composite aggregates did form more slowly than the mature thrombocyte clusters. Although this may seem unexpected, it is possible to explain this by thrombocyte availability for aggregation. As young thrombocytes are seen to cluster first, physical surface area availability makes the probability of self-aggregation of mature thrombocytes greater than formation of composite aggregates.
In our in vitro studies, thrombocytes did not seem to be activated, because we did not see any aggregates until we treated the samples with agonists. Similarly, in the in vivo study, thrombocytes did not aggregate in circulation; however, they did aggregate at the site of injury, suggesting activation after the injury. Thus, the labeling of the thrombocytes by DiI does not appear to be due to activation. Furthermore, human reticulated platelets, as defined by TO labeling, are the only ones labeled by DiI, again indicating that the DiI labeling is not a result of activation. It is important to note that the observation of DiI labeling of human reticulated platelets may be useful in their estimation in clinical laboratories along with TO, which is currently being used.
It has been found in chickens that there are 4 types of thrombocytes, and these thrombocytes have been suggested to correlate with different stages of thrombocyte maturation.16 Interestingly, the gradation in the level of DiI labeling may indicate the existence of other subsets of thrombocytes. Further work is needed to resolve whether the gradation of DiI labeling correlates with the percentages of receptors on the surface, and probably corresponds to various stages of maturation of thrombocytes.
Platelet heterogeneity with respect to prothrombinase complex formation was noted by Paula Tracy (University of Vermont; personal oral communication, June 15, 2004). George Dale and his colleagues have found that platelets costimulated with collagen and thrombin (COAT-platelets) expressed high levels of surface-bound α-granule proteins such as factor V on a subpopulation of platelets despite the fact that all platelets are activated.17 Behnke and Forer reported that there are 2 classes of platelets of about equal size based on the presence/absence of a p-nitrophenylphosphatase (PNPase).18 Using adhesion to collagen in vitro and platelet aggregates in clots formed in vivo, it was shown that PNPase-negative platelets react the fastest and that the first platelets to respond and adhere are predominantly PNPase negative.19 These earlier observations of a selective group of platelets with enhanced functional activity in vitro may well correspond to young platelets. Furthermore, during in vivo aging of canine platelets, George Dale and coworkers demonstrated an emergence of a population of aged platelets that are refractory to collagen, and a decrease in binding of convulxin that specifically recognizes collagen receptor glycoprotein VI.20 These results suggest that aged platelets may lose their receptors, which may correspond to characteristics of mature platelets.
Our finding that young thrombocytes form separate clusters during aggregation is consistent with the initiation of an in vivo thrombus by young thrombocytes. Due to the increased adhesive receptor density, they may attach to the subendothelial matrix, followed by rapid activation and recruitment of more of their kind, at which time there is sufficient release of agonists to activate and recruit mature thrombocytes to the growing thrombus. The finding that young thrombocytes initiate arterial thrombosis may lead to testing whether such mechanisms are conserved in mammalian platelets, and if so, may allow for selective and controlled reduction of young platelet activity by development of novel anti–young platelet drugs for the prevention of arterial thrombosis.
Prepublished online as Blood First Edition Paper, March 15, 2005; DOI 10.1182/blood-2004-10-4118.
Supported by grant HL63792 from the National Institutes of Health (P.J.).
The online version of the article contains a data supplement.
An Inside Blood analysis of this article appears at the front of the issue.
The publication costs of this article were defrayed in part by page charge payment. Therefore, and solely to indicate this fact, this article is hereby marked “advertisement” in accordance with 18 U.S.C. section 1734.
We thank Robert Klebe for critical reading of the manuscript.

