Abstract
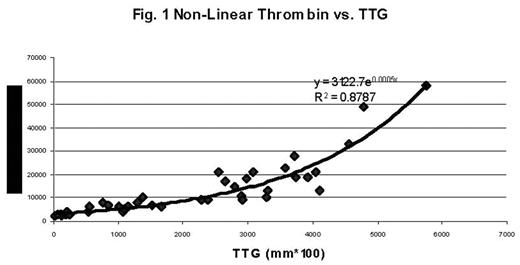
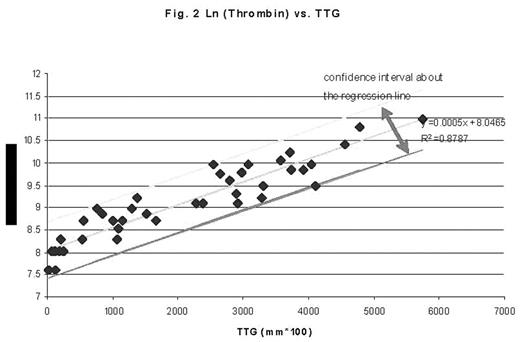
The evaluation of thrombin generation during blood coagulation has become the preferred clinically relevant approach to assess the global integrity of this complex process. In order to give the full picture of the physiology of this multifactorial reaction, all cellular and soluble plasma participants to this reaction have to be present in their natural whole blood environment. Whole blood thrombin generation tests are best suited for this purpose but are somewhat cumbersome for use in real time clinical practice. Thrombelastography has long been recognized as a clinically useful technology for assessment of whole blood coagulation. The purpose of this study was to evaluate the possibility of linking the tracing generated by clotting of whole blood in a Thrombelastograph® (TEG®) Hemostasis System with the generation of thrombin as assessed by thrombin/antithrombin complex (TAT). 320μL of citrated whole blood (3.2% buffered citrate and 1000μg/ml of corn trypsin inhibitor; 1 part to 9 parts of blood) from volunteers was clotted in the presence of 20μL CaCl2 (200mM) and 20μL of Innovin (1/100 diluted in PBS/albumin 4%, pH 7.4). Clotting was monitored with 8 channels of the TEG® system. At different time points (4 to 40 min) the whole blood TEG® reaction cups were put in 2640μL of cold quenching solution (EDTA 50mM, L-benzamidine 10mM, NaCl 150mM, HEPES 2mM, pH 7.4, and 10μL of 10mM D-Phe-Pro-Arg CH2Cl chloromethylketone diluted in 0.01M HCl), vortexed, and centrifuged, and the supernatants were kept at −80°C until assayed for TAT by ELISA. Total Thrombus Generation (TTG) was calculated from the first derivative of the TEG® waveform and was compared to the thrombin generation as measured by TAT as described above. The two vectors of values - the TAT thrombin generation data and the corresponding TEG® TTG - were analyzed using Pearson correlation coefficients and linear, non-linear, and natural log (Ln) transformation of TAT values for least-squares goodness-of-fit curves. The best least-squares fit is the exponential curve (Fig. 1) and its corresponding natural log transformation of TAT value as shown by Fig. 2, with R2 = 0.8787 (P < 0.0001). The prediction equation for TAT thrombin generation is y = 3122.7e0.0005x, where x is the TEG® TTG variable (P < 0.0001). Linearizing using the natural log of the TAT thrombin generation variable (Fig. 2), produces the same R2 as the exponential curve. The prediction equation is y = 8.0465 + 0.0005x, significant at P < 0.0001, where y is the TAT thrombin generation in the Ln transformation variable and x is the TEG® TTG variable. The high magnitude of R2 and the high significance of the prediction equation demonstrate the high efficacy of the prediction of TAT thrombin generation using the TEG® TTG.
Author notes
Corresponding author


