Multiple myeloma (MM) is a plasma cell disorder that potentially initiates during an early stage of B-cell development. We encountered an unidentified isoform of B cell–specific activator protein (BSAP, or Pax5) in MM cells while performing differential analyses to compare mRNA expression in malignant and normal plasma cells. Pax5 is a transcription factor that plays a central role throughout B-cell development until the point of terminal differentiation. Our finding of this unique isoform prompted us to investigate Pax5 isoform usage in plasma cells and B-cell populations in other MM and healthy subjects. In contrast to normal Pax5 expression, we observed multiple isoforms of Pax5 in conjunction with low levels of expression of the full-length Pax5 in B cells from MM patients. The expressed isoforms in MM varied considerably from patient to patient, with no clear pattern. We also performed semiquantitative analyses of the mRNA expression levels of B lymphocyte–induced maturation protein (Blimp-1), because expression levels of Pax5 and Blimp-1 have been shown to be inversely correlated. We observed the expression of Blimp-1 in the B-cell populations in all 11 MM patients but in none of 11 healthy subjects. We hypothesize that premature Blimp-1 expression coupled to altered and deficient Pax5 expression causes some proliferating B cells to prematurely differentiate to plasma cells in MM.
Introduction
Multiple myeloma (MM) is a monoclonal neoplasm of mature immunoglobulin-secreting plasma cells. It is unknown if the neoplasm first develops within mature plasma cells or if dysregulation occurs in the molecular pathway(s) leading to the development of mature plasma cells. Treatments have included immunotherapy with tumor-specific peptides that are not expressed by normal, healthy cells. Tumor vaccines, including dendritic cell–based vaccinations with idiotype, have shown promise as treatment.1,2 The monoclonal protein, as a source of tumor-specific peptides, is an obvious target for tumor vaccines, but concerns have been raised about the utility of the idiotype as a potential target.3,4 A number of investigators have confirmed the existence of idiotype-specific T cells in mouse plasmacytoma models5,6and in in vitro studies of human peripheral blood lymphocytes (PBLs).7,8 Yet, for unknown reasons, these idiotype-specific T cells do not function effectively in vivo.9 10 Thus, the need exists to identify and test alternative tumor-specific peptides as potential targets for immunotherapy.
A search for new MM-specific peptides could conceivably be expedited if a clear understanding of the pathway(s) involved in the transcriptional control of MM were known. Unfortunately, such knowledge for MM remains elusive. Multiple aberrant mRNA expression levels have been detected in studies of gene expression in MM, but it has been difficult to associate these findings with a common point of origin or with common pathways. Data obtained from differential analyses with the use of microarrays will contribute significantly to our ability to identify pathways and define the course of development of MM. However, microarrays are deterministically arranged and are considerably less useful when the need arises to detect previously unidentified mRNA transcripts. It is also important to be able to identify, characterize, and estimate the expression levels of alternatively spliced isoforms. A means to identify alternatively spliced transcripts is particularly important when attempting to characterize gene expression in proliferating and differentiating cells, because alternative splicing can provide the economical use of a single gene to rapidly perform multiple tasks.
We performed differential analyses to search for novel genes that could provide MM-specific peptides for use as cytotoxic T-lymphocyte (CTL) determinants. We used a technique known as RNA fingerprinting by arbitrarily primed polymerase chain reaction (RAP-PCR) to compare in vivo gene expression profiles in B-cell and plasma cell populations from MM patients versus healthy individuals. RAP-PCR takes advantage of primer sequences (10 bases) that occur at approximately 500–base pair increments in genomic DNA.11 First-strand cDNA syntheses that are primed with either an arbitrary primer or an oligo(dT) primer serve as templates in PCRs where the upstream primers are also arbitrary primers. RAP-PCR can be performed with picograms of mRNA, thus avoiding the need to supply the larger amounts of RNA required for chip arrays. Theoretically, with sufficient primer combinations, reverse transcriptase–PCR (RT-PCR) products will be generated for most mRNA transcripts. Thus, this technique can provide information on novel gene expression, alternatively spliced transcripts, and induced and suppressed expression of mRNAs.
We encountered an unusual, alternatively spliced isoform of the B cell–specific activator protein (BSAP, or Pax5) in plasma cells from an MM patient in a differential analysis experiment. Pax5 is a transcription factor that contributes significantly to the process of B-cell development and differentiation that culminates in the production of fully differentiated plasma cells.12 In Pax5−/− mice, B-cell development stalls at the pro–B-cell stage.13 In Pax5+/+ mice, Pax5 also participates in the later antigen-driven stages of B-cell differentiation.12 The finding of an unusual isoform of Pax5 in an MM patient and a general sparsity of information regarding human Pax5 isoforms prompted us to perform gene-specific RT-PCR investigations of Pax5 in plasma cells and B-cell populations from other MM patients and healthy donors. Our studies have revealed multiple new Pax5 isoforms that have not been previously reported. Pax5 isoform usage differs between MM patients and healthy subjects, and the levels of expression of full-length Pax5 are lower in MM patients than in healthy subjects. We also investigated the status of Blimp-1 gene expression by semiquantitative RT-PCR, because it has been reported that Pax5 and Blimp-1 expression are inversely correlated.14-16 Blimp-1 expression is sufficient to cause terminal differentiation and is expressed at the plasma cell state.17 18 In contrast to healthy subjects, we found up-regulated expression of Blimp-1 in the B-cell populations of MM patients.
Patients, materials, and methods
Isolation of cells
Bone marrow (BM) samples from 13 myeloma patients were acquired from the Mayo Clinic Hematology Cell Bank. Normal BM samples were obtained from 13 unrelated, healthy donors. These collections were approved by the institutional review board of the Mayo Clinic and were performed following informed consent by donors. Following flotation on Ficoll-Hypaque gradients, plasma cells were extracted from human BM by means of magnetic-activated cell separation (MACS) CD138 (Syndecan-1) MicroBeads for Plasma Cell Isolation (Miltenyi Biotec, Auburn, CA). Following the CD138 MicroBeads extraction, a B-cell isolation kit was used to isolate the B-cell population from the flow-through (Miltenyi Biotec). CD22+ subsets of B cells were extracted with CD22 MicroBeads from the B-cell populations for 4 MM patients (Miltenyi Biotec).
Messenger RNA extraction
Messenger RNAs were extracted from all sorted cells with Oligotex Direct mRNA Micro Kits (Qiagen, Valencia, CA).
Primer synthesis
Primers were synthesized by Mayo Molecular Biology Core (Mayo Clinic, Rochester, MN) with retention of the 5′-protecting group (dimethoxytrityl; PE Applied Biosystems, Foster City, CA).
RNA fingerprinting by arbitrarily primed PCR
RAP-PCR methodology was adapted to one-tube, hot-started RT-PCRs.11,19-21 Two cDNA synthesis master mixes were prepared for 24 20-μL reactions. Reaction concentrations were 10 mM Tris (tris(hydroxymethyl)aminomethane) HCl (pH 8.3), 50 mM KCl, 5 mM MgCl2, and 0.25 mM each deoxyribonucleoside triphosphate (dNTP) (Promega, Madison, WI). Each reaction received 20 pmol of arbitrary primer AP-21,20 0.5 units of PRIME RNase INHIBITOR (5′ → 3′), 4 units of Moloney murine leukemia virus reverse transcriptase (M-MLV RT; Life Technologies, Gaithersburg, MD) and 400 pg mRNA. Messenger RNAs from normal and malignant plasma cells were added to separate mixes. The mRNAs were denatured at 70°C for 3 minutes. Each cDNA synthesis mixture was aliquotted into 24 0.5-mL tubes, and cDNA was synthesized on a 380 DNA Thermal Cycler (PE Applied Biosystems) with a 7-minute ramp from room temperature to 37°C, 15 minutes of incubation at 37°C, followed by 20 minutes at 42°C. Following cDNA synthesis, provision for a subsequent hot-start PCR was made by addition of an AmpliWax PCR Gem 100 Pellet (PE Applied Biosystems) to each tube before incubation at 100°C for 5 minutes to inactivate M-MLV RT. For the PCR layer, 24 mixes were prepared, with each receiving 1 of a set of 24 arbitrary primers (AP1-AP20 and AP22-AP25) for use with a normal/malignant template pair following the first-strand cDNA synthesis.20 This layer had a final volume of 80 μL and consisted of 1.25 mM MgCl2, 10 mM Tris-HCl (pH 8.3), 50 mM KCl, 20 pmol of 1 arbitrary primer, and 1.25 units of Taq DNA Polymerase (Promega). Cycling parameters were (1) 1 cycle with 94°C for 5 minutes, 25°C for 30 seconds, a ramp of 5 minutes to 72°C, and 72°C for 2 minutes; (2) 40 cycles with 94°C for 1 minute, 40°C for 30 seconds, and 72°C for 1 minute; and (3) 1 cycle with 7 minutes at 72°C.
Product selection, reamplification, and identification
RAP-PCR products were separated by agarose gel electrophoresis and reamplifed in standard PCRs with the respective primer pair using the cycling parameters as described above for the PCR stage of the RT-PCR. The reamplification products were sequenced by the Mayo Molecular Biology Core with the respective AP primers on a Model 373A Automated Sequencer (PE Applied Biosystems). Acquired sequence data were analyzed on the National Center for Biotechnology Information basic local alignment search tool (NCBI BLAST) server.22
Gene-specific RT-PCRs for full-length Pax5
Full-length Pax5 products were generated with the use of a Qiagen OneStep RT-PCR Kit (Qiagen). Cycling parameters for the cDNA synthesis were 50°C for 32 minutes followed by 95°C for 15 minutes, and the PCR was performed with 40 cycles of 1 minute at 94°C, 30 seconds at 55°C, and 1 minute 30 seconds at 72°C with a final incubation at 72°C for 10 minutes. Pax5 primers E1-F and E10-R were used (Table 1), and cycling was performed in a DNA Engine Tetrad (MJ Research, Waltham, MA).
Gene-specific RT-PCRs for all other gene products
These RT-PCRs were one-tube, hot-started reactions as described above for RAP-PCR. First-strand cDNA synthesis was primed with 20 pmol of gene-specific reverse primers, and 20 pmol of upstream gene-specific primers were added at the PCR stage. For semiquantitative analyses, starting mRNA templates were 350 pg of mRNA. Cycling parameters were (1) 1 cycle with 94°C for 5 minutes, 55°C for 30 seconds, and 72°C for 2 minutes; and (2) 35 cycles with 94°C for 1 minute, 56°C for 30 seconds, and 72°C for 1 minute, with a final incubation at 72°C for 7 minutes. All reactions were normalized to β-actin expression. Primer pairs used to generate 585 and 754 bp products at the 3′-end of the coding region of Pax5 (Table 1) were E5/6-F paired with E10-R and E4-F paired with E10-R, respectively. BLIMP-1 primers were ACACACGGGAGAAAAGCCAC and CTTGTGGCACTGGGAGCAC; A1 primers were GTCCTACAGATACACAACC and TCCTTATAGGTATCCACATCC. The β-actin primers were CATTGGCAATGAGCGGTTGG and AGTGATCTCCTTCTGCATCC. Primers used to generate products for the alternative 3′-end product of Pax5 were E3-F (Table 1) and downstream primer GGACTCGCTCCTCTGCAGG (located in the intron between exons 5 and 6).
Nested PCRs for analysis of exon 2+ RT-PCR Pax5 products
We performed nested PCRs using full-length Pax5 transcripts as template to determine the composition of some Pax5 products. A total of 8 forward and 8 reverse primers based on sequence from each exon 1-8 and each exon 3-10, respectively, were synthesized for the purpose of “spanning” the entire Pax5 transcript in overlapping fragments by PCR (Table 1). PCR cycling parameters were the same as for gene-specific RT-PCRs but with 25 cycles.
Genomic analysis
Human genome databases were accessed through NCBI,22 GCG (Wisconsin Package Version 10.2, Genetics Computer Group, Madison, WI), and the Celera Discovery System, Celera, Rockville, MD.
Results
Clinical status of patients at the time of BM harvests
Plasma cell percentages (BM%), plasma cell labeling indexes (PCLIs), types of treatment if any, patient status at sample time, and other comments on patient status are shown in Table2. Treated patients, with the exception of P18, included those who had received some form of chemotherapy prior to the time of the BM harvest. P18 had been treated with dexamethasone and radiation to a spine plasmacytoma. BM samples from untreated MM patients were harvested at diagnosis.
Detection of a Pax5 isoform in a RAP-PCR differential analysis
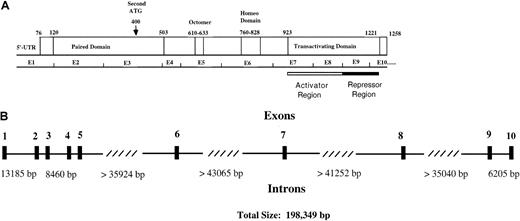
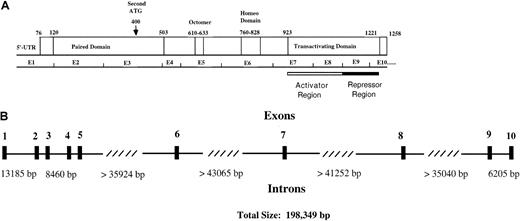
As a means of identifying aberrant gene expressions in plasma cells of MM patients, we used RAP-PCR differential analyses to compare the gene expression profiles in plasma cells of MM patients and healthy individuals. Messenger RNAs were used as templates. A RAP-PCR using cDNA synthesis primer AP-21 and forward primer AP-14 generated a product of 180 bp that was observed exclusively in the plasma cell sample from MM patient P1. The product was identified by sequence analysis as a unique isoform of Pax5 from which exons 2, 3, and 4 had been deleted but which stayed in frame for Pax5 protein sequence downstream of the deletion (Figure 1). This patient appeared to be heterozygous with both the reported G and an alternative A at the15th nucleotide position upstream of the deletion. The Pax5 polypeptide is a typical transcription factor and is composed of a paired DNA-binding domain, an octapeptide region, a short region of homeodomain homology, and a transactivating region (Figure2A).23 The deletion of exons 2, 3, and 4 would remove the entire paired domain region of Pax5.
Structure and sequence of a Pax5 mRNA isoform that was missing exons 2, 3, and 4 and was detected in the plasma cells of an MM patient in a RAP analysis.
Structure and sequence of the exon junctions as observed in the plasma cells of MM patient P1. Arrows indicate a nucleotide position at which P1 appeared to be heterozygous.
Functional regions and genomic structure of Pax5.
(A) Locations of the paired domain (a 128 amino acid DNA-binding domain), an octapeptide homology region of unknown function, a partial homeodomain region, and a transactivating domain are indicated. The transactivating domain of Pax5 consists of an activator domain that is negatively regulated by a repressor domain. An alternative start site for Pax5 is indicated by the arrow. (B) An exon/intron map for the human Pax5 gene, which is located in chromosomal region 9p13. Exon sizes vary from 45 to 198 base pairs. The diagram is based on data from Celera Discovery System and Celera Genomics' associated databases and from accession no. AP002388, clone RP-11 675M6, sequenced by RIKEN Genomic Sciences Center.
RT-PCR products of 3′-ends of the coding regions of Pax5 isoforms
The finding of a previously unidentified isoform for Pax5 prompted us to investigate Pax5 isoform usage in other MM patients and healthy subjects. The full-length Pax5 transcript has been identified in human cell lines and B lymphocytes, but an isoform from which exon 2 has been deleted, as observed in mouse studies, has not been well characterized in human studies.24-26
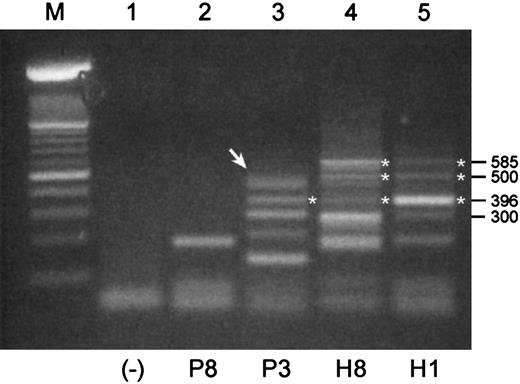
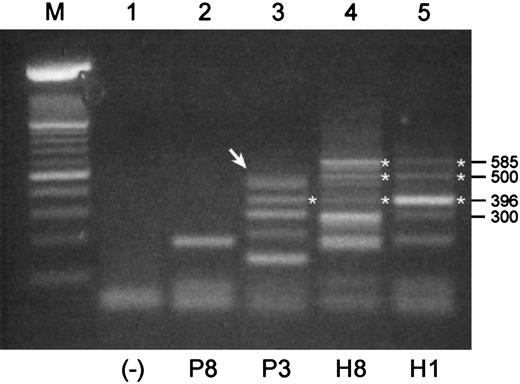
We used mRNA templates from B cell–enriched populations for these RT-PCRs because Pax5 expression would expectedly be low or absent in normal plasma cells. Shown in Figure 3are RT-PCR products that were generated with a pair of primers designed to amplify an expected 585-bp product in the 3′-end of the coding region of Pax5 including exons 6 to 10. The expected 585-bp product was observed in mRNAs from both healthy donors but in neither of the mRNAs from MM patients. Both normal samples have the same basic pattern of expression, albeit with potentially different levels of expression of individual products. None of the products of 300 bp or less were readily identifiable; thus, a 3′-end Pax5 product was not identified for sample P8. The largest product detected for P3 was subsequently shown to consist of 2 products of sizes 498 bp and 483 bp (Figure 3, arrow). Sequencing of these products revealed that the 498 bp product was missing exon 9, and the 483 bp product was missing exon 8. Both of these isoforms stayed in frame for Pax5 translation following the deletions. A product observed at 396 bp in P3, H3, and H1 is an isoform missing both exons 7 and 8, and it appears to be more strongly expressed in sample H1 than the expected 585-bp product. These isoforms encode for an additional unique stretch of 64 amino acids. An unusual product detected in both normal samples at 500 bp was determined to be a hybrid mix composed of one strand of the expected 585-bp Pax5 and one strand of the isoform missing exons 7 and 8.
RT-PCR products of 3′-ends of the coding region of Pax5 transcripts differ between malignant and normal B cell–enriched populations.
Shown are RT-PCR products that were generated with a pair of primers designed to amplify a 585 bp product in the 3′-end of the coding region of Pax5. All templates were mRNA derived from B cell–enriched populations. P indicates MM patient; H, healthy donor. (Lane M) A 100-bp ladder (Boehringer Mannheim). Products of 300 bp or less in this RT-PCR were not readily identifiable. (Lane 1) A no-template control. (Lane 2) An unidentified product for P8. (Lane 3) The uppermost product observed for P3 (arrow) is a doublet composed of a 498-bp product and a 483-bp product that were identified as Pax5 isoforms missing exons 9 and 8, respectively. A product at 396 bp is an isoform missing Pax5 exons 7 and 8 in tandem. (Lanes 4 and 5) Products identified for H3 and H1 include the expected product of 585 bp, a product at 396 bp that is missing exons 7 and 8, and a product at 500 bp that is a mixed hybrid of one strand of the 585-bp and one strand of the 396-bp product.
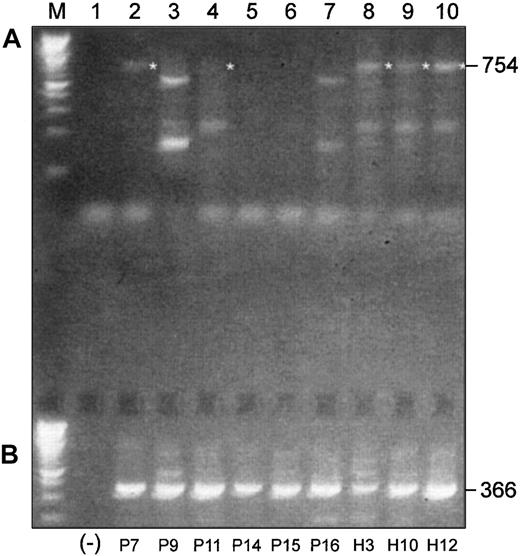
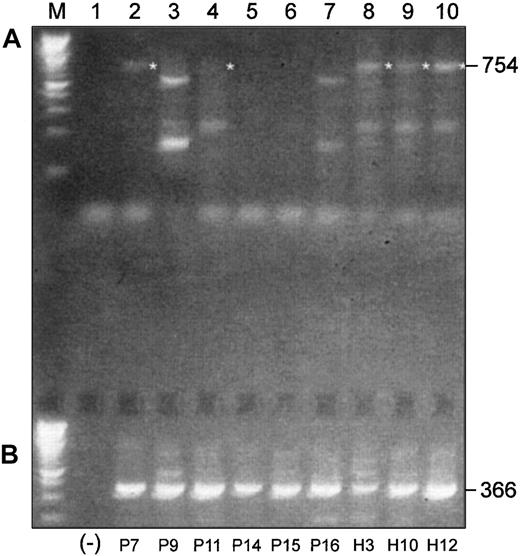
We performed a similar experiment with 6 more MM patients and 3 healthy subjects using a pair of primers designed to amplify an expected 754-bp product in the 3′-end of the coding region of Pax5, including exons 4 to 10 (Figure 4A). The expected 754-bp product was observed in mRNAs from all 3 healthy donors, but only traces of expression were observed in mRNAs from untreated MM patients. The expected product was observed in 2 of 3 treated patients but only faintly in one of these. All other products generated with this primer set were determined to be nonspecific upon sequencing.
Differences and similarities are observed in Pax5 isoform usage in malignant and normal B-cell–enriched populations.
(A) RT-PCR products of 3′-ends of the coding region of Pax5 transcripts differ between malignant and normal B cell–enriched populations. (B) Alternative Pax5 d/e is expressed in both malignant and normal B cell–enriched populations. Shown in panel A are RT-PCR products that were generated with a pair of primers designed to amplify a 754-bp product in the 3′-end of the coding region of Pax5. All templates were mRNA derived from B cell–enriched populations. P indicates MM patient; H, healthy donor. (Lane M) A 100-bp ladder (Boehringer Mannheim). (Lane 1) A no-template control. (Lanes 2-7) Patients P9, P15, and P16 had not yet received any chemotherapy at the time of the BM harvest; patients P7, P11, and P14 had received treatment with chemotherapy at the time of the BM harvest (Table 2). The expected 754-bp product is faintly observed in 2 treated patients (P7 and P11) but in none of the untreated patients. (Lanes 8-10) The expected 754-bp product is expressed in all 3 healthy subjects. All other products observed with this primer pair were nonspecific. (B) (Lane 1) A no-template control. (Lanes 2-10) All MM patients, treated and untreated, and all healthy subjects express the alternative Pax5d/e isoform.
RT-PCR search for a Pax isoform with replacement of exons 6 to 10 as observed in mouse (isoforms Pax5d and 5e)
Two additional mouse Pax5 isoforms, with (Pax5d) and without exon 2 (Pax5e), have replaced exons 6 to 10 with 129 bases of novel sequence.13 Human versions of these isoforms have not been reported. We considered that if this isoform were expressed in human B cells, it is perhaps predominant in MM patients and replaces the normal 3′-end. We aligned the sequence data from the mouse 3′ alternative–end to genomic data in the Celera database and determined that the alternative sequence observed in mice lay within the intron immediately distal to exon 5. We then used gene-specific primers in RT-PCRs to generate a product that spanned 2 introns, which ruled out generation of a product from genomic DNA (Figure 4B). All B-cell populations from MM patients and healthy subjects strongly expressed this alternative Pax5 isoform. The stretch of nucleotides replacing exons 6 to 10 in humans is 45 bases longer than that in mice and confirmed to come from the intron region homologous to mouse (Figure5).
Alternative 3′-end sequence (human Pax5d and Pax5e).
Unique nucleotide sequence that follows Pax5 exon 5 in an isoform with an alternative 3′-end and the putative translation of this sequence. Exons 6 to 10 of Pax5 are replaced with this alternative sequence. These data were generated through use of the Celera Discovery System and Celera Genomics' associated databases.
Pax5 isoform profiles differ in healthy subjects, untreated MM patients, and treated MM patients
The findings of exon deletions near the 3′-end of Pax5 were potentially unimportant because an isoform of Pax5 that is missing exon 2 is likely normally expressed at the time of terminal differentiation, and the loss of exon 2 causes a frame shift that results in an abortion of translation 12 amino acids downstream of the deletion.13 Thus, we designed primers in the 5′-UTR (untranslated region) of Pax5 and near the 3′-end of exon 10 to use in RT-PCRs to generate and identify those products that retained exon 2. If a full-length product could not be sequenced due to cross-hybridization among alternative isoforms, a series of overlapping PCR nests were performed using the full-length product as template to determine the composition of the hybrid products.
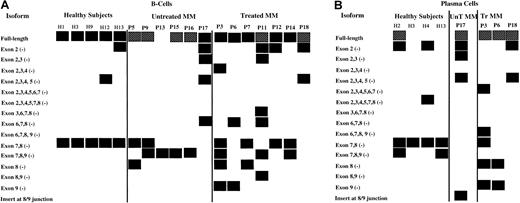
Compiled in Figure 6A are the results of these RT-PCRs and nested PCRs for B cells and plasma cells, respectively. The isoform that is missing exons 7 and 8 in tandem is consistently expressed in normal B cells, while B cells from only 33% of untreated MM patients expressed this isoform. The incidence of the 7-8 (−) isoform increases to 57% in treated B-cell populations. The isoform missing exons 7, 8, and 9 in tandem was found in 67% and 43% of the B-cell populations of untreated and treated MM patients, respectively; this isoform was not found in normal B cells. It was, however, found in the plasma cells of 2 of 4 healthy subjects. An isoform with an insert of 83 nucleotides between exons 8 and 9 was detected in the plasma cells of P17. In general, multiple isoforms were expressed in MM patients compared with healthy subjects, particularly in treated MM patients, and the deletions occurred primarily in the 3′-end of Pax5.
Compilation of Pax5 isoforms detected in untreated MM patients, treated MM patients, and healthy subjects.
P indicates patient; MM, multiple myeloma patient; H, healthy subject. Boxes represent detection of the Pax5 isoforms listed at left of diagram; hatched boxes for the Pax5 full-length isoform indicate that very low expression was detected in semiquantitative analyses. No attempts were made to semiquantitate any other isoforms, which were expressed at variable levels. (A) Isoforms detected by RT-PCR in B-cell populations from 5 healthy subjects, 6 untreated MM patients, and 7 treated MM patients. The isoforms shown for P11 and for P13 to P16 are also the isoforms that were observed in the CD22+ B-cell populations for these patients with one exception: The isoform missing exons 7-8 was not observed in the CD22+ cells of P14. (B) Isoforms detected by RT-PCR in plasma cells from 4 healthy subjects, 1 untreated MM patient, and 3 treated MM patients.
We also sought to enhance the purity of the B cell–enriched populations by extracting CD22+ cells from the CD138− B-cell populations of 5 patients. CD22 does not become fully expressed until the pre–B-cell stage and is no longer expressed at the plasma cell stage; thus, its expression is expectedly coincident with Pax5 expression. We then investigated the Pax5 profile for P11 and for P13 to P16 in the CD22+ cell populations to further establish the B-cell origin of the isoforms. The data in Figure6 also show these Pax5 profiles, as they were identical to those observed for the CD138− populations with one exception: The transcript missing exons 7-8 was not found in the CD22+ cells for P14.
We attempted to semiquantitate the full-length Pax5 transcripts because it is commonly more difficult to generate this product in MM patients than in healthy subjects. The semiquantitative results are potentially misleading, however, because these products were invariably cross-hybridized with other isoforms. Thus, any of the patients that show strong full-length Pax5 products may actually be expressing only low levels of full-length product.
Schematic illustrations of the isoforms missing exons 8, 9, 7-8 in tandem, 7-9 in tandem, and the isoform with an insert between exons 8 and 9
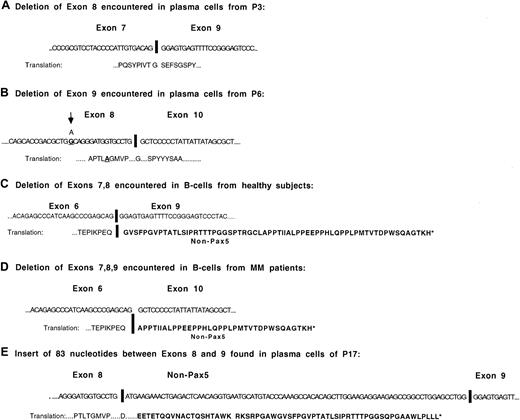
Shown in Figure 7 are the sequences of the predominant Pax5 isoforms with changes in the 3′-end of Pax5. Isoforms with either exon 8 or exon 9 deletions stay in frame for Pax5 following the deletion. One of the MM patients with an exon 8 deletion exhibited a single, nonsynonymous base change (Thr→Ala) at the 16th nucleotide prior to the splice site. The putative protein sequence downstream of the deletion in the isoforms missing exons 7-8 and exons 7-9 code for out-of-frame Pax5 stretches of 64 and 35 amino acids, respectively. The isoform with an insert between exons 8 and 9 translates as Pax5 up through exon 8 and then codes for 62 additional amino acids of non-Pax5 sequence. The insert is a portion of the KIAA0040 gene, at chromosomal position 1q23, first identified in the immature myeloid cell line KG-1.27 This gene has a coding region of 154 amino acids with no known function.
Structure and sequences of most commonly occurring Pax5 mRNA isoforms.
(A) Sequence of the exon junction observed in the Pax5 isoform from which exon 8 has been deleted. (B) Sequence of the exon junction observed in the Pax5 isoform from which exon 9 has been deleted. The base change shown in exon 8 was observed in P6. (C) Sequence of the exon junction observed in the Pax5 isoform from which exons 7-8 have been deleted. This isoform has been detected in the B cells of all healthy subjects. (D) Sequence of the exon junction observed in the Pax5 isoform from which exons 7-9 have been deleted. (E) Sequence of the isoform detected in the plasma cells of P17 that has an insert between exon 8 and exon 9.
Possible correlations between clinical data and Pax5 isoform profiles
The 2 patients with the highest PCLIs, P17 and P13, are also those who are likely to have the most severely compromised Pax5 function (Table 1 and Figure 6). P17 carries the Pax5 insert between exons 8 and 9 in the plasma cells and has 5 identified isoforms in B cells. A full-length Pax5 transcript wax not detected for P13. The patient with relapsing MM (P3) and one of the patients with no response to treatment (P11) have the highest number of Pax5 isoforms in the B cells; a patient who shows no response to treatment is a patient with smoldering multiple myeloma (P12) and has a relatively normal Pax5 profile. It may be of interest that other tissues that express Pax5 are the developing hindbrain, kidney, genital tract, and thyroid.28 29 Two patients have neuropathy (P7 and P12), one has renal failure (P13), one has an enlarged prostate gland (P17), and one has gout (P6).
Blimp-1 expression in B cells and plasma cells from healthy subjects and MM patients
One means of investigating Pax5 function where unique isoforms were observed was to investigate the expression of B lymphocyte–induced maturation protein (Blimp-1). Blimp-1 is also a critical transcription factor in B-cell development because it is both required and sufficient to trigger terminal differentiation of B cells to immunoglobulin (Ig)–secreting plasma cells.17,18 It has been observed that a low Pax5 phenotype is always associated with increased Blimp-1 expression, although the reason for the inverse correlation is not yet clear.14 16 However, it would be expected that under normal conditions Blimp-1 expression would be down-regulated in the B-cell population and up-regulated in plasma cells in an inverse relationship to Pax5 expression levels.
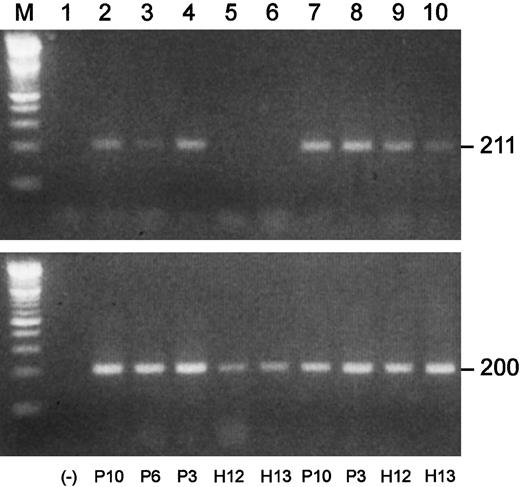
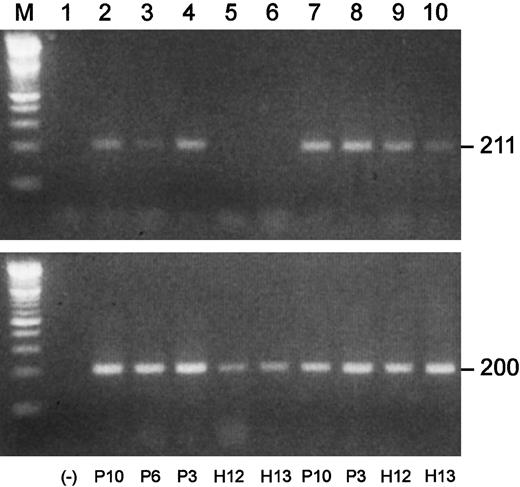
We performed semiquantitative RT-PCRs to investigate Blimp-1 expression in plasma cells and B cell–enriched populations from MM patients and healthy subjects. Shown in Figure8 are the results of one of the Blimp-1 RT-PCRs. In this experiment, the B-cell populations of 3 MM patients were positive for Blimp-1 expression, while both of the normal B-cell populations were negative. The available plasma cell populations from these same 5 individuals were all positive for Blimp-1 expression. An apparent greater level of expression was observed in the malignant plasma cells than in the normal plasma cells. A summary of all the Blimp-1 RT-PCR results is shown in Table3. We observed Blimp-1 expression in all 7 B cell–enriched populations from MM patients that were analyzed. In contrast, we did not observe Blimp-1 expression in any of 11 B-cell populations from healthy subjects.
Blimp-1 is prematurely expressed in B-cell populations in MM.
Semiquantitative gene-specific RT-PCRs were performed to determine relative levels of expression of Blimp-1. Shown is an example of one experiment. P indicates MM patient; H, healthy donor. All upper lanes show Blimp-1 expression; all lower lanes show β-actin expression. (Lane M) A 100 bp ladder (Boehringer Mannheim). (Lane 1) A no-template control. (Lanes 2-6) Blimp-1 products (upper lanes) and β-actin products (lower lanes) generated using mRNA templates extracted from B cells from P10, P6, and P3 and from H12 and H13, respectively. (Lanes 7-10) Blimp-1 products (upper lanes) and β-actin products (lower lanes) generated using mRNA templates extracted from plasma cells from P10 and P3 and from H12 and H13, respectively.
Blimp-1 expression in CD22+ and CD22−subsets of B-cell populations
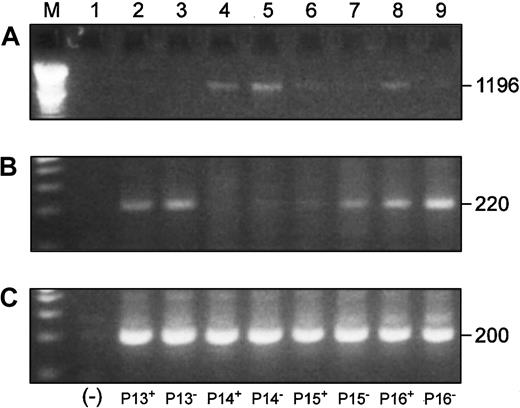
We also investigated Blimp-1 expression in CD22+ cells from 4 patients to more definitively establish B-cell origin of overexpression of Blimp-1. We simultaneously compared the expression of the full-length Pax5 transcript, Blimp-1, and β-actin in both the CD22+ and CD22− B-cell populations by RT-PCR (Figure 9). Three of 4 of the CD22+ populations and all of the CD22−populations were positive for Blimp-1 expression (Figure 9B). An inverse correlation between full-length Pax5 (Figure 9A) and Blimp-1 (Figure 9B) levels of expression was observed in all samples with the exception of the CD22+ cells from P15.
Blimp-1 is expressed in CD22+ and CD22− B cells, and its expression is inversely correlated to Pax5 expression in the same cells.
P indicates MM patient. Superscripts “+” and “−” designate CD22+ and CD22− B cells, respectively. (Lane M) A 100 bp ladder (Boehringer Mannheim). (Lane 1) A no-template control. (A) Full-length Pax5 expression in CD22+ and CD22− B-cell populations from 4 patients. (B) Accompanying Blimp-1 expression in the same cell samples as panel A. (C) A β-actin control.
A1 expression in B cells and plasma cells from healthy subjects and MM patients
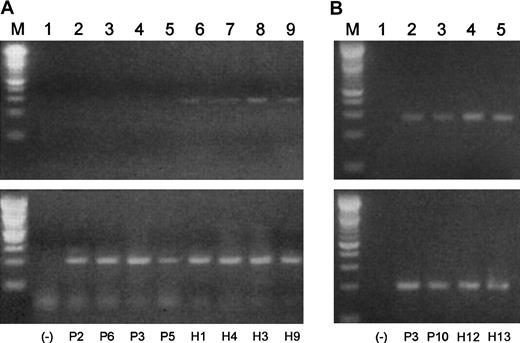
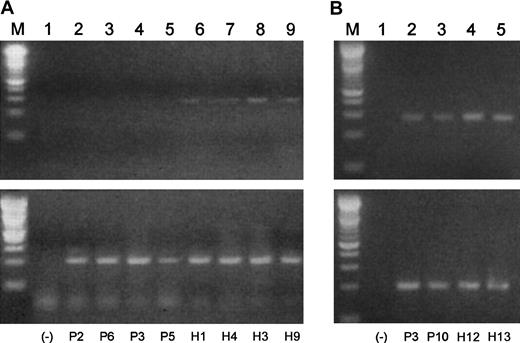
It has been shown that overexpression of Blimp-1 results in a down-regulation of the A1 antiapoptotic bcl-2 family member in murine WEHI 231 cells.30 It follows that if Blimp-1 were prematurely expressed in a B-cell population, A1 expression could be repressed. We investigated A1 expression in B cell–enriched populations from MM patients and healthy subjects by semiquantitative RT-PCR (Figure 10A). In agreement with early expression of Blimp-1 in the MM B-cell populations, we did not observe expression of A1 in any of these samples. We did, however, observe a low level of A1 expression in the normal samples. The negative results obtained for malignant B cells and the relatively low expression observed for A1 in the normal B cells prompted us to analyze A1 expression in plasma cells from 2 MM patients and 2 healthy subjects with increased amounts of starting mRNA (350 pg was increased to 400 pg) and an increase of 5 PCR cycles. When we did so, A1 expression was unexpectedly observed in both malignant and normal plasma cells (Figure10B). However, the levels of A1 expression appear to be lower in the malignant plasma cells than in the normal plasma cells, suggesting possible repression by excessive Blimp-1 expression.
A1 expression correlates inversely to Blimp-1 expression in B cells and plasma cells from MM patients and healthy donors.
Semiquantitative gene-specific RT-PCRs were performed to determine relative levels of expression of A1 in B cells and plasma cells from both malignant and healthy subjects. P indicates MM patient; H, healthy donor. (A) (Lane M) A 100 bp ladder (Boehringer Mannheim). (Lane 1) A no-template control. (Lanes 2-9) A1 products (upper lanes) and β-actin products (lower lanes) generated using mRNA templates extracted from percursor B cells from P2, P6, P3, P5, H1, H4, H3, and H9, respectively. (B) (Lane M) A 100-bp ladder (Boehringer Mannheim). (Lane 1) A no-template control. (Lanes 2-5) A1 products (upper lanes) and β-actin products (lower lanes) generated using mRNA templates extracted from plasma cells from P3, P10, H12, and H13, respectively.
Discussion
The occurrence of multiple aberrant mRNA expression levels and multiple genetic translocations is a common finding in analyses of gene expression in BM cells from MM patients. Such multiple perturbations in gene expression in complex pathways could be the result of mis-splicing of a single transcription factor into variant isoform(s), producing both normal and abnormal isoforms to variable levels.
Our finding of a unique isoform of the Pax5 transcription factor in plasma cells of an MM patient prompted us to analyze Pax5 isoforms in healthy donors and MM patients. We concentrated our efforts on B-cell populations for 2 reasons: (1) Pax5 expression decreases at the plasma cell stage, and (2) our initial data revealed differences in the Pax5 profiles of healthy subjects and MM patients in B cells. We were able to determine the profile for Pax5 expression in healthy subjects although even healthy subjects occasionally exhibit a variable isoform. We identified multiple isoforms for Pax5 that were prevalent in MM patients and usually expressed in conjunction with decreased levels of the full-length Pax5 transcript. Unique forms of Pax5 have been previously encountered by others in mouse and human studies but were not fully characterized.24 31
The mechanisms(s) whereby Pax5 isoforms contribute to the disease phenotype is unclear. The altered isoforms could be replacing normal, functional Pax5 transcripts, thereby reducing the concentration of normal Pax5. It has been reported that Pax5 repressor and activator functions are independently dependent on Pax5 concentration: Pax5-specific DNA binding sites with positive regulatory activity have greater affinity for Pax 5 than those sites with negative regulatory activity.32 Thus, as expression levels of Pax5 decrease near the time of terminal differentiation, negative functions will be lost at higher concentrations than required for loss of positive functions.
Alternatively, the unique isoforms are translated and are directly responsible for misregulation downstream of Pax5. In vitro mutagenesis and transient transfection experiments with a murine plasma cell line have shown that the transactivating domain of Pax5 consists of an activator domain that is negatively regulated by the adjacent sequences at the C-terminus of the transactivating domain.23 If the repressor region is deleted, the ability of Pax5 to activate transcription can increase 8-fold.23 Dysfunctional Pax5 proteins apparently have considerable potential to disrupt normal cell development due to the large number of Pax5-regulated genes. Pax5-activated targets include CD19 and CD72 (costimulatory receptors), the ε gene (Iε, a prerequisite for a switch to immunoglobulin E [IgE] synthesis), and the lymphoid enhancer factor-1 (LEF-1) and N-myc transcription factors.12,33-35 Pax5-repressed targets incude the Ig J chain promoter, PD-1 (programmed cell death molecule), hXBP-1 (human X-box–binding protein-1), and the first exon of p53.12,35,36 Pax5 binds to 2 Igswitch region promoters (the μ promoter and the γ2α promoter) and 2 enhancer regions (the Ig heavy chain 3′ Cα enhancer and the Ig κ3′ enhancer).12 35
A prominent feature of the Pax5 profiles in B cells reported here is the isoform missing exons 7-8 that is routinely seen in healthy subjects. In contrast, it was detected in only 2 of 6 untreated MM patients. However, the MM patients frequently had the isoform missing exons 7-9. The loss of exons 7-9 is detected in the plasma cells of 2 of 4 healthy subjects; thus, a change to a 7-9–deleted isoform may be part of a normal transition to the plasma cell state. If so, the presence of the (7-9)− isoform in the B cells in some MM patients may indicate that these cells have prematurely progressed to a plasma cell–like state.
Another prominent feature of both B cells and plasma cells is that most exon deletions in MM patients occur within the 3′-end of Pax5. An insert between exons 8 and 9 was observed in one MM patient. An exon 9–deleted isoform is missing most of the repressor module of Pax5 upon translation and thus has the potential to mimic overexpression of Pax5. Such overexpression of Pax5 has been implicated in other cancers, including a subset of non-Hodgkin lymphomas, glioblastoma, and medulloblastoma.37-39 A translated exon 8–deleted isoform would be missing a portion of the activator region, which could explain the low level of CD19 expression that is observed in some MM patients.40 It is also notable that monoclonal IgE is only rarely observed in myeloma, and Pax5 positively regulates the germ-line transcription of the ε gene (Iε), which is a prerequisite for the switch to immunoglobulin E (IgE) synthesis.34
However, it has also been observed that expression of the mb-1 and LEF-1 genes are up-regulated by the paired domain polypeptide of Pax5 lacking any transactivation function.35 Thus, it is possible that all of the products that lack portions of the carboxy-terminus would retain some activating function. Interestingly, it has recently been reported that a frameshift mutation occurs in the transactivation domain of a Pax5 allele of the acute lymphoblastic leukemia cell line REH.23 This mutant transcript continues to translate, but not as Pax5 protein; thus, the carboxy-terminal end of Pax5 protein is also potentially disrupted in this tumor.
We used sequence data in the human genome databases to probe the exon/intron boundary sequences of Pax5 and to determine intron sizes (Figure 2). We confirmed that all exon/intron boundaries of human Pax5 are homologous to those in mice. Pax5 is an uncommonly large gene of 198 349 base pairs; an average human gene is 27 kb.41Most of the length of Pax5 is accounted for by 4 introns that are all more than 35 000 base pairs, and all of these lie downstream of exon 5 where we identified transactivating region deletions. Studies have shown that exon deletion frequency correlates directly with the sizes of the neighboring introns; thus, some endogenous exon loss might be expected for Pax5.42
It is also possible that aberrant splicing is causing the exon deletions in Pax5. Possible causes for aberrant splicing are point mutations at splice sites, gain or loss of long interspersed nuclear element-1's (LINE-1) in long introns such as are present in Pax5, or loss of proper mRNA surveillance.43-48 Also, it has been reported that elevated temperatures and low pH conditions, often found in tumor tissues, cause increases in alternative splicing.49
There are no obviously strong correlations between the Pax5 isoform profiles and the clinical data (Figure 6 and Table 1). It may be significant, however, that 2 patients (P13 and P17) with high PCLIs and 2 patients (P3 and P11) who exhibited poor response to treatment all have particularly pronounced disruptions of Pax5 expression. Some correlation between untreated and treated patients may exist, because the normal transcript that is missing exons 7-8 begins to reappear in some of the treated patients. It will be important to analyze same-patient Pax5 profiles throughout treatment to confirm this latter observation.
We considered that there might be a relationship between aberrant Pax5 expression and the frequently observed up-regulation of interleukin-6 (IL-6) in MM. The partial homeodomain of Pax5 is an interaction motif for the retinoblastoma gene product (Rb), and it has been reported that the Rb gene product may be involved as a transcriptional repressor in modulating IL-6 gene expression during cellular differentiation and oncogenesis.50,51 Homozygous deletion of RB-1 has been identified in some MM patients and in the IL-6–autocrine human myeloma cell line U266.52 In future work it will be important to determine if the isoforms of Pax5 bind Rb protein, perhaps competing with the IL-6 gene promoter.
The findings of the premature expression of Blimp-1, in conjunction with the potentially disrupted transactivating domains in Pax5 and the frequent low levels of full-length Pax5 expression, suggest that B-cell development in MM could be uncoupled from normal control by both of these transcription factors. Blimp-1 is believed to induce either Ig secretion and terminal differentiation in B cells or growth arrest and cell death, depending on the developmental stage of the cell, and it is up-regulated during the transition of mature B cells to Ig-secreting plasma cells.14,17 Blimp-1 also regulates several target genes, including transcription factor c-myc, antiapoptotic bcl-2 family member A1, syndecan-1, and J chain.30,53 54
We compared levels of full-length Pax5 expression in CD22+and CD22− cells from MM patients to levels of Blimp-1 expression. A clear inverse correlation in the expression levels was observed in 7 of 8 comparisons. There are conflicting reports regarding the reason for the inverse correlation between Pax5/Blimp-1 expression. The expression of Blimp-1 was shown to be indirectly repressed by Pax5 overexpression in a murine late B-cell line but not in a plasma cell line.14 Recent work suggests, however, that Blimp-1 is both necessary and sufficient to repress Pax5 during plasmacytic differentiation of primary splenic B cells in mice.16These contrasting observations are conceivably due to the function of variant Pax5 isoforms, particularly in systems that are being manipulated in vitro. Our detection of the strong expression of an alternative Pax5d/5e product in B cells from both MM patients and healthy subjects adds to the complexity of understanding the Pax5/Blimp-1 relationship. If Blimp-1 represses Pax5 expression, it does not appear to repress this unique isoform in the B cells in MM. Conversely, if Pax5 represses Blimp-1, this unique isoform would likely relieve that repression because it lacks the transactivating region. Clearly, more studies are needed to clarify the relationship between Blimp-1 and Pax5 in vivo, particularly in the wake of our findings of the altered transcription of these 2 genes in MM.
The findings of premature Blimp-1 expression in B cells from MM patients were also supported by our findings for expression of A1. A1 expression is normally repressed by Blimp-1, and we consistently observed the expected inverse correlation between Blimp-1 and A1 expression. We also investigated the expression levels of hXBP-1, another gene reportedly repressed by Pax5.35 In these experiments we did not find an apparent difference in levels of expression in the B cells between MM patients and healthy subjects (data not shown).
It has recently been found that Blimp-1 expression in germinal centers is associated with a subset of cells with a phenotype intermediate between germinal center mature B cells and plasma cells and that these cells are nonapoptotic, proliferating cells.18 It is conceivable that malignant plasma cells could develop if proliferating B cells were pushed to differentiate prematurely. Other research indicates that Blimp-1 overexpression abrogates IL-4– and CD40-mediated suppression of terminal B-cell differentiation but arrests isotype switching.55 The expression of Blimp-1 in B cells of MM patients may contribute to that paradox observed in MM: loss of polyclonality accompanied by proliferation of a monoclonal cell type. We propose that the coupling of premature Blimp-1 expression with alterations and deficits in Pax5 expression may cause some proliferating B cells to prematurely progress to a “plasma cell–like” state while bypassing isotype switching events and control of proliferation.
Supported in part by grant 2A2887, International Myeloma Foundation, North Hollywood, CA; grant Mayo-1: B-Cell; and grant CA62242, Studies of Monoclonal Gammopathies, Cancer Center; both of the Mayo Clinic, Rochester, MN.
The publication costs of this article were defrayed in part by page charge payment. Therefore, and solely to indicate this fact, this article is hereby marked “advertisement” in accordance with 18 U.S.C. section 1734.
References
Author notes
Nancy D. Borson, Rm 5-42A, Guggenheim Bldg, Mayo Clinic, 200 1st St SW, Rochester, MN 55905; e-mail:borson.nancy@mayo.edu.


