Key Points
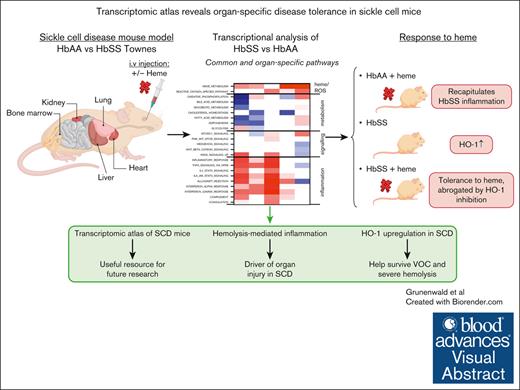
We provide a transcriptomic atlas of the Townes mouse model of SCD at rest and upon challenge with heme.
HbSS organs exhibit inflammatory signatures and heme metabolism reprogramming, allowing them to tolerate heme excess.
Visual Abstract
Sickle cell disease (SCD) is the most common genetic disease in the world and a societal challenge. SCD is characterized by multiorgan injury related to intravascular hemolysis. To understand tissue-specific responses to intravascular hemolysis and exposure to heme, we present a transcriptomic atlas of the primary target organs of hemoglobin S (HbSS) vs hemoglobin 1 (HbAA) transgenic SCD mice. We explored the transcriptomes of the liver, kidney, heart, lung, and bone marrow from HbAA and HbSS Townes littermates at resting state and their changes after the injection of heme, assessed by RNA sequencing. Inflammation and myeloid cell signatures were omnipresent in resting HbSS organs, with the liver being the most affected. The injection of heme triggered a robust inflammatory response in HbAA mice. Signatures of exposure to heme in HbAA mice were downstream of toll like receptor 4, sensor of lipopolysaccharides but also of heme, interleukin-1β (IL-1β), IL-6, and interferon gamma, similarly to HbSS mice at rest. Nevertheless, HbSS mice were strikingly unresponsive to the heme administration, irrespective of the organ. This tolerance was driven by upregulation of the heme-detoxifying enzyme heme oxygenase-1 and was abrogated by its specific inhibition. Therefore, HbSS mice develop robust protective mechanisms, which may explain how they and patients with SCD survive bouts of severe hemolysis.
Introduction
Sickle cell disease (SCD) is a genetic disease with an incidence of ∼350 000 births per year and the cause of severe morbidity and mortality,1 characterized by a single-point mutation of hemoglobin (Hb), HbS. Hemolysis-mediated sterile inflammation is recognized as a key component of most complications of the disease, including vaso-occlusive crises (VOCs), acute chest syndrome, pulmonary hypertension, nephropathy, coronary microvascular disease and myocardial fibrosis, bone marrow necrosis, and liver injury.1 Chronic organ dysfunction and higher mortality2 in SCD emphasize the need to understand shared and distinct mechanisms causing chronic organ damage. Despite significant advancements in understanding of the physiopathology of vaso-occlusions and endothelial activation in SCD, we need a deeper knowledge of the specific alterations occurring in each type of organ in response to HbS expression.
Transcriptomic analysis could help decipher the SCD pathophysiology. Analysis of whole blood from patients with SCD identified differences in oxidative stress response, inflammation and immune response, free radical scavenging, cell cycle regulation, apoptosis, protein modification, and hematopoiesis.3 Circulating transcriptomic profiles predictive of poor outcomes in patients with SCD showed increased porphyrin and xenobiotic metabolism, complement and coagulation, and bile secretion.4 Whole blood RNA sequencing (RNA-seq) of children with acute chest syndrome revealed enhanced interferon (IFN) signaling, neuro-inflammation, pattern recognition receptors, and macrophage activation.5 Metanalyses of SCD whole blood transcriptomes confirmed pathways related to innate immunity, IFN-α/β and interleukin-6 (IL-6) signaling, coagulation, platelet activation, oxidative stress, glutathione metabolism, hemopoiesis, heme biosynthesis, and apoptosis.6 Peripheral blood mononuclear cell analysis revealed differentially expressed genes (DEGs) related to iron response, toll-like receptor (TLR) 4/8 signaling, inflammasome pathway, and IL-6.7 Finally, exploration of the placenta from patients with SCD showed DEGs mainly associated with migration, trophoblast differentiation, and inflammation.8 Transcriptomic analyses of the other organs are very limited for patients and mouse models of SCD.
To better understand organ injury in SCD, here, we present a comprehensive transcriptomic atlas encompassing the liver, heart, kidney, lung, and bone marrow in HbSS (mutated Hb) vs HbAA (normal Hb) Townes mice at resting state and after challenge with heme.
Materials and methods
Animal experimentation
Two pairs of heterozygous Townes mice (AS), Hbb<tm2(HBG1,HBB∗)Tow>/ Hbb<tm3(HBG1,HBB)Tow>, were purchased from The Jackson Laboratory and bred in our animal facility to generate HbAA and HbSS littermates (supplemental Figure 1A). Experimental protocols were reviewed by the Charles Darwin ethical committee (Paris, France) and the French Ministry of Agriculture (approval number APAFIS#2148 2019091015099240v1). All experiments were conducted in accordance with their recommendations for the care and use of laboratory animals. All mice were genotyped and age- and sex-matched littermates. HbAA vs HbSS mice were used for experimentations at age 7 to 12 weeks to limit intragroup heterogeneity, because HbSS mice accumulate chronic organ alterations over time due to repetitive vaso-occlusions.
Modeling intravascular hemolysis by heme injection
Hemin (Ferriprotoporphyrin IX; Frontiers Scientific) was dissolved to a concentration of 10 mM in 50-mM NaOH and 145-mM NaCl in sterile conditions and further diluted in sterile phosphate-buffered saline (PBS) just before use. The hemin solution (designated further as heme) was freshly prepared immediately before each mouse experiment. Heme was injected IV into the retroorbital sinus at 24 μmol/kg, and mice were euthanized 4 hours after injection. The dose was determined by titration of 0, 3, 6, 12, and 24 μmol/kg. Control mice received PBS instead. Mice were anesthetized with 2% to 3% isoflurane for injections, blood collection, and euthanasia.
Inhibition of heme oxygenase-1 (HO-1) activity by SnMP in vivo
Sn(IV) Mesoporphyrin IX dichloride (SnMP; Frontier Scientific) was prepared similarly to heme and was diluted at 40 μmol/kg in sterile PBS. SnMP or PBS was injected intraperitoneally on days 0, 1, and 2 at the same hour. Heme or PBS was injected IV into the retroorbital sinus at a concentration of 24 μmol/kg 1 hour after the last injection of SnMP on day 2. All mice were euthanized 4 hours after heme or PBS injection.
Mouse sample processing
All mice were euthanized by cervical dislocation. Peripheral blood was collected retro-orbitally with a heparinized capillary tube and placed in microtubes with 10-μL EDTA. Microtubes were centrifuged at 13 000 rpm for 10 minutes at room temperature to recover plasma (storing at –80°C). The kidneys, lungs, hearts, and livers were immediately snap-frozen in liquid nitrogen without perfusion for transcriptomic analyses and tissue staining or dilacerated for flow cytometry analysis. Bone marrow was recovered by flushing the femoral and tibial bones with PBS, then centrifuged and frozen. Hematological and biochemical analyses were performed on whole blood using an 18-parameter hematology analyzer/blood counter (scil Vet abc) and on plasma using a Konelab Analyzer (Thermo Scientific).
Transcriptomic analyses by QuantiGene
Thirty-micrometers thick frozen tissue sections of kidneys were cut at −20°C with a Cryostat (Leica AS-LMD, Leica Biosystem) and homogenized in 200 μL of 1-Thioglycerol/Homogenization Solution (QuantiGene, ThermoFisher) 20 target and housekeeping genes were then submitted to targeted hybridization and signal amplification according to recommendations of the manufacturer. Streptavidin phycoerythrin signals were detected by Luminex photometer (Luminex Corporation). Blank well fluorescence was subtracted from median fluorescence and housekeeping genes were validated based on their standard deviation to mean ratio. Data analysis was performed with GraphPad Prism software after normalization of mean fluorescence values over housekeeping gene expression, and comparison of gene expression levels with those of pooled, PBS-treated HbAA mice.
Transcriptomic analyses by bulk RNA-seq
Frozen tissue sections of the livers, kidneys, lungs, and hearts of 30-μm thickness were cut as above and homogenized in 200 μL of 1-Thioglycerol/Homogenization Solution (Maxwell 16 LEV simplyRNA Tissue Kit Promega AS1280). Bone marrow RNA was extracted by Macherey Nagel kit, according to the manufacturer’s instructions. The quality and quantity of messenger RNA were evaluated using a 2100 bioanalyzer with TNA 6000 NanoKits (all Agilent Technologies, Palo Alto, CA). RNA integrity numbers >7 were eligible for subsequent reverse transcription into complementary DNA.
RNA-seq was performed at the Genom′IC plateform Cochin Institute INSERM U1016 (supplemental Methods). The “Enhancedvolcano” package was used for volcano plots. Genes with a log2 fold change >1 and a P value adjusted for false discovery rate (FDR; Benjamin Hochberg method) <.05 were considered differentially expressed. A heat map was realized for visualization with gplots package. Normalized counts of genes (RSEM software) in each mouse were represented with row scale normalization. Gene ontology analysis was performed to identify the biological pathways to which DEGs (fold change > 1; and adjusted P < .05) belong, using WebGestalt (WEB-based GEne SeT AnaLysis Toolkit) and Ingenuity Pathway Analysis (Qiagen). Pathways including only a single gene were excluded from the representation. Gene set enrichment analyses (GSEAs) were performed with the GSEA software (Hallmarks), providing a normalized enrichment score (NES) for each affected gene set. By analyzing groups of genes rather than a small number of DEGs, GSEA increases the statistical power to detect subtle but coordinated changes in expression, which might be missed when considering genes individually.9,10 The FDR was calculated by the Benjamini-Hochberg method. We applied an a priori significant threshold of FDR <0.05. The z score is calculated as NES × –log10 q value, in which the q value is the P value adjusted for FDR. For heat maps, the pathways are grouped manually depending on the overall biological processes to which they can be related.
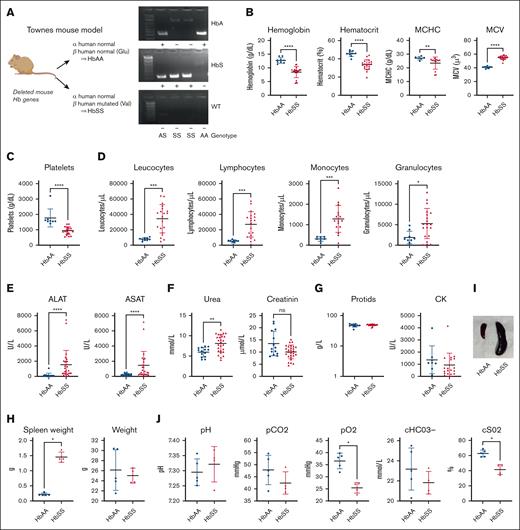
Alteration of organ functions in HbSS vs HbAA mice. (A) Representation of Townes genotypes. (B) Quantification of (from left to right) Hb, hematocrit, MCHC, MCV, and platelets in the blood of HbAA (blue) and HbSS (red) mice. (C) Quantification of platelets in the blood of HbAA (blue) and HbSS (red) mice. (D) Quantification of (from left to right) leukocytes, lymphocytes, monocytes, granulocytes, and eosinophils of HbAA (blue) and HbSS (red) mice. (E) Quantification of ALAT (left) and ASAT (right) of HbAA (blue) and HbSS (red) mice. (F) Quantification of urea (left) and creatinine (right) in the blood of HbAA (blue) and HbSS (red) mice. (G) Quantification of CK (left) and protids (right) in the blood of HbAA (blue) and HbSS (red) mice. (H) Weight of total spleen (left) or total weight of HbAA (blue) and HbSS (red) mice. (I) Picture of HbAA and HbSS mice spleen. (J) Measurement of pH (left), partial pressure in CO2 (pCO2; middle left), partial pressure in O2 (pO2; middle), and bicarbonates concentration (right) in venous blood of HbAA (blue) and HbSS (red) mice. Hematological parameters in Townes HbAA and HbSS mice evaluated by blood counter (∗P < .05; ∗∗P < .01; ∗∗∗P < .001; ∗∗∗∗P < .0001; Mann-Whitney test). ALAT, alanine aminotransferase; ASAT, aspartate aminotransferase; CK, creatine kinase; MCHC, mean corpuscular Hb concentration; MCV, mean corpuscular volume; WT, wild type C57Bl/6 mouse as a negative control.
Alteration of organ functions in HbSS vs HbAA mice. (A) Representation of Townes genotypes. (B) Quantification of (from left to right) Hb, hematocrit, MCHC, MCV, and platelets in the blood of HbAA (blue) and HbSS (red) mice. (C) Quantification of platelets in the blood of HbAA (blue) and HbSS (red) mice. (D) Quantification of (from left to right) leukocytes, lymphocytes, monocytes, granulocytes, and eosinophils of HbAA (blue) and HbSS (red) mice. (E) Quantification of ALAT (left) and ASAT (right) of HbAA (blue) and HbSS (red) mice. (F) Quantification of urea (left) and creatinine (right) in the blood of HbAA (blue) and HbSS (red) mice. (G) Quantification of CK (left) and protids (right) in the blood of HbAA (blue) and HbSS (red) mice. (H) Weight of total spleen (left) or total weight of HbAA (blue) and HbSS (red) mice. (I) Picture of HbAA and HbSS mice spleen. (J) Measurement of pH (left), partial pressure in CO2 (pCO2; middle left), partial pressure in O2 (pO2; middle), and bicarbonates concentration (right) in venous blood of HbAA (blue) and HbSS (red) mice. Hematological parameters in Townes HbAA and HbSS mice evaluated by blood counter (∗P < .05; ∗∗P < .01; ∗∗∗P < .001; ∗∗∗∗P < .0001; Mann-Whitney test). ALAT, alanine aminotransferase; ASAT, aspartate aminotransferase; CK, creatine kinase; MCHC, mean corpuscular Hb concentration; MCV, mean corpuscular volume; WT, wild type C57Bl/6 mouse as a negative control.
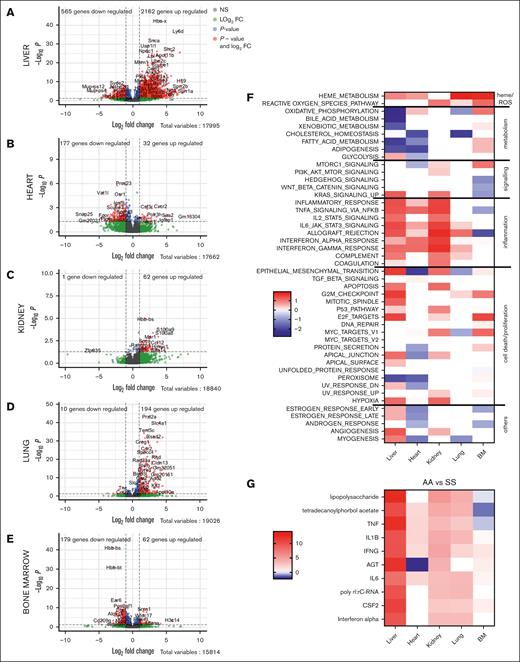
Global inflammatory and organ-specific transcriptomic signatures of the HbSS mice compared with HbAA. Volcano plots of the signature in the liver (A), heart (B), kidney (C), lung (D), and BM (E). The red dots represent the upregulated and downregulated genes in HbSS mice compared with HbAA (adjusted P < .5; log2 FC less than or equal to −1 or ≥1). (F) GSEA of the gene sets affected in the 5 organs. The heat map is built to represent the z score for each pathway, which is calculated as the NES multiplied by the −log10 q value, which is the P value adjusted for FDR. The Hallmarks pathways are grouped manually depending on the overall biological processes to which they can be related. (G) Upstream pathways, responsible for the transcriptomic changes in the tested organs, estimated by ingenuity pathways. AGT, angiotensin; BM, bone marrow; FC, fold change; NS, not significant.
Global inflammatory and organ-specific transcriptomic signatures of the HbSS mice compared with HbAA. Volcano plots of the signature in the liver (A), heart (B), kidney (C), lung (D), and BM (E). The red dots represent the upregulated and downregulated genes in HbSS mice compared with HbAA (adjusted P < .5; log2 FC less than or equal to −1 or ≥1). (F) GSEA of the gene sets affected in the 5 organs. The heat map is built to represent the z score for each pathway, which is calculated as the NES multiplied by the −log10 q value, which is the P value adjusted for FDR. The Hallmarks pathways are grouped manually depending on the overall biological processes to which they can be related. (G) Upstream pathways, responsible for the transcriptomic changes in the tested organs, estimated by ingenuity pathways. AGT, angiotensin; BM, bone marrow; FC, fold change; NS, not significant.
Evaluation of myeloid infiltrates in the kidney and liver
By flow cytometry
When HbAA and HbSS mice were euthanized, the kidneys and livers were collected for flow cytometry (supplemental Methods).
By gene expression
We evaluated the proportions of immune cells infiltrating the livers and kidneys with the mouse Microenvironment Cell Population counter algorithm (MCP-counter), which was based on highly specific transcriptomic markers that help quantify immune (and stromal) cell populations.11
Staining for HO-1
Frozen organs sections (6 μm) were fixed in acetone. Tissues we stained with anti–HO-1 (rabbit anti-mouse; 5 μg/mL Abcam, Ab13243). Staining was revealed by Anti Rabbit Plus HRP (Enzo; ENZ-ACC103-0150) and 3,3' Diaminobenzidine chromogen.
Hemopexin and C5a enzyme-linked immunosorbent assay
Mouse plasmas were diluted 1:20 000 and 1:100 in reagent diluent. Hemopexin and C5a assays were then performed using the Mouse Hemopexin enzyme-linked immunosorbent assay (ELISA) Kit (ab157716; Abcam) and the Mouse Complement Component C5a DuoSet ELISA kit (DY2150; R&D Systems), according to the manufacturer’s recommendations. Absorbance was measured at 450 nm with an Infinite 200 PRO spectrophotometer (Tecan).
Statistical analyses
Statistical analysis was performed using GraphPad Prism version 9 (La Jolla, CA). Continuous variables were compared using the Mann-Whitney test. When comparing >2 groups of mice, the Kruskall-Wallis test with Dunn correction for multiple pairwise comparisons was applied. Statistical significance was defined as P value < .05.
Results
Alteration of organ functions in HbSS mice
HbSS mice (Figure 1A) already at age 7 to 12 weeks presented mild anemia (Figure 1B), increased platelets (Figure 1C) and immune cell counts (Figure 1D), and injury of liver (measured by increased alanine aminotransferase and aspartate aminotransferase; Figure 1E) but not of kidney (very mild increase in urea but not in creatinine; Figure 1F), as well as normal protids and creatine kinase (Figure 1G). HbSS mice had splenomegaly (Figure 1H-I), and lung dysfunction, characterized by decreased partial pressure in O2, which reflects the amount of O2 dissolved in the blood and oxygen saturation measuring the percentage of Hb that is fully combined with oxygen (Figure 1J).
Transcriptomic atlas of HbSS mice reveals differential impact on the liver, kidney, lung, heart, and bone marrow but marked by an inflammatory signature
Having validated the presence of organ dysfunction, we proceeded with transcriptomic analysis. RNA-seq revealed that the different organs were not affected to the same degree by SCD. In the liver, 2162 genes were upregulated (DEGs defined by P value <.05 and log2 fold change ≥1), and 565 genes were downregulated in HbSS vs HbAA mice (Figure 2A). In the heart, 32 genes were upregulated, and 177 were downregulated (Figure 2B). In the kidney, 62 genes were upregulated, and 1 was downregulated (Figure 2C). In the lung, 194 genes were upregulated, and 10 were downregulated (Figure 2E). In the bone marrow, 62 genes were upregulated, and 179 were downregulated (Figure 2D). This differential sensitivity is illustrated by the lack of common DEGs among the 5 organs, and only 1 long non-coding RNA (Gm32051) with unknown function and Cxcr2, S100a9, S100a8, Csf3r, Slfn14, Trim10, Apol11b, and Gypa were common DEGs in 4 organs (supplemental Figure 1).
We compared the DEG lists with gene ontology analyses. Genes upregulated in HbSS organs were related to cytokine production, immune cell chemotaxis, and response to stress or danger in all studied organs, except the bone marrow (supplemental Figure 2). Hence, transcriptomic analysis revealed profound inflammatory changes in the organs of HbSS mice.
GSEA showed that heme metabolism and reactive oxygen species (ROS)–related gene sets were enriched in all HbSS organs (Figure 2F). The HbSS liver, heart, kidney, and to some extend the lung showed marked similarities in inflammatory remodeling, implicating the same pathways, whereas the other identified pathways were mostly organ specific (Figure 2F). GSEA confirmed the global enrichment of genes related to inflammation in all organs except the bone marrow (Figure 2F). IFN-α response gene sets were significantly enriched in all 5 organs. Two more inflammatory gene sets, IL-6 JAK STAT3 signaling and IFN-γ response, and 2 gene sets related to cell cycle arrest, P53 pathway and G2M checkpoint, were common in the liver, kidney, heart, and lung. These 2 processes are predominant, because additional gene sets falling broadly into these 2 categories were enriched in different combinations of 3 of the 5 tested organs. Inflammation-related gene sets include inflammatory response, tumour necrosis factor alpha (TNF-α) signaling via NF-κB, allograft rejection, complement, and coagulation. Proliferation-related gene sets, including E2F targets and MYC targets, are also enriched in 3 of the 5 organs. Cell metabolism, signaling, and epithelial to mesenchymal transition were also often affected in the tested organs, albeit in a different direction, illustrating again the organ specificities. Moreover, the expression of Hb genes was differentially expressed in different direction in the tested organs.
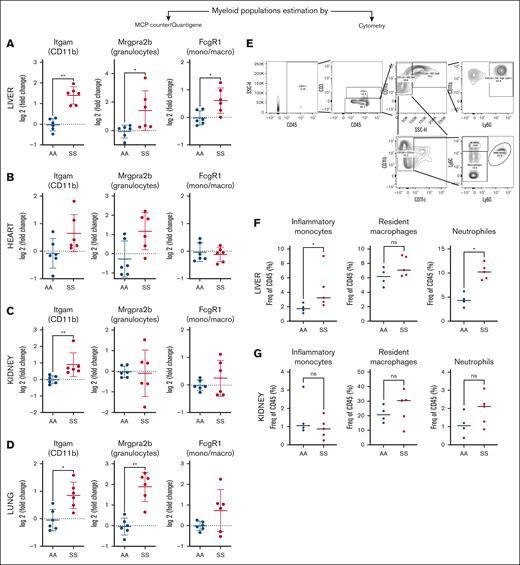
Upstream pathway analyses revealed LPS (hence TLR4) signaling, together with tetradecanoylphorbol acetate (Phorbol-myristate-acetate, activator of PKC/NF-κB), TNF-α, IL-1β, IFN-γ, angiotensin, IL-6, polyinosinic:polycytidylic acid, CSF2, and IFN-α. This inflammatory profile (for which key common genes from the RNA-seq signatures [supplemental Figure 1] were confirmed by QuantiGene [supplemental Figure 3]) suggests immune infiltrate at least in the liver, where the inflammatory signature was the strongest (Figure 2G). Indeed, in HbSS liver and lung but not kidney and heart, the abundance of myeloid cells, including granulocytes and monocytes/macrophages, was increased, as estimated by MCP-counter/QuantiGene (Figure 3A-D). This was confirmed by flow cytometry for the liver and kidney (Figure 3E-F). Their infiltration may be facilitated by the increased circulating pool (Figure 1D).
Immune infiltrate in the HbSS organs. Evaluation of the proportion of the myeloid cells in the liver (A), heart (B), kidney (C), and lung (D), based on the expression of genes extracted from the MCP-counter signatures, measured by QuantiGene. Gating strategy (E) for evaluation by flow cytometry of the immune infiltrate on fresh whole livers (F) and kidneys (G) from HbAA mice (AA; blue) and HbSS mice (SS; red). The gating strategy was as follows: inflammatory monocytes (LD/CD45+/CD11b+CD11c–/SSC low/LY6G–/Ly6C high) (left), macrophages (LD/CD45+/CD11b+/CD11c–/LY6G–/Ly6C low) (middle), neutrophiles (LD–/CD45+/CD11b+/CD11c–/SSC high/LY6G+) (right). ∗P < .05; ∗∗P < .01. Mann-Whitney test. LD, LIVE/DEAD viability marker; mono/macro, monocytes/macrophages; ns, not significant.
Immune infiltrate in the HbSS organs. Evaluation of the proportion of the myeloid cells in the liver (A), heart (B), kidney (C), and lung (D), based on the expression of genes extracted from the MCP-counter signatures, measured by QuantiGene. Gating strategy (E) for evaluation by flow cytometry of the immune infiltrate on fresh whole livers (F) and kidneys (G) from HbAA mice (AA; blue) and HbSS mice (SS; red). The gating strategy was as follows: inflammatory monocytes (LD/CD45+/CD11b+CD11c–/SSC low/LY6G–/Ly6C high) (left), macrophages (LD/CD45+/CD11b+/CD11c–/LY6G–/Ly6C low) (middle), neutrophiles (LD–/CD45+/CD11b+/CD11c–/SSC high/LY6G+) (right). ∗P < .05; ∗∗P < .01. Mann-Whitney test. LD, LIVE/DEAD viability marker; mono/macro, monocytes/macrophages; ns, not significant.
The heme-detoxifying enzyme HO-1 was upregulated in the organs of HbSS mice at messenger RNA level (QuantiGene; supplemental Figure 4A), even if it did not always reach significance in the RNA-seq. HO-1 overexpression was confirmed in liver and kidneys at protein level (supplemental Figure 4B-C).12,13
Setup of the heme challenge model in HbSS mice
Injection of heme is a well-established model to trigger VOC in HbSS mice.14-18 Published doses ranged from 1 to 50 μmol/kg to induce vascular stasis (model of VOC),14-19 most often 3.2 μmol/kg; 70 μmol/kg induced acute chest syndrome.16 Because 70 and 32 μmol/kg were reported to induce mortality, we restricted our range to 24 μmol/kg. We found a dose-dependent increase in Hmox1, C5aR1, and Ccl2 in HbAA as well as C5aR1 and Ccl2 in HbSS liver and kidney (supplemental Figure 5). The maximal dose of 24 μmol/kg repeatedly did not induce lethality and caused Hmox1 overexpression in HbAA but not in HbSS organs (supplemental Figure 6) and hemopexin consumption in HbAA but not in HbSS plasma (supplemental Figure 7); this also led to an increased in circulating monocytes and granulocytes both in HbAA and HbSS mice (supplemental Figure 8).
Therefore, we used 24 μmol/kg and performed analyses at 4 hours after administration of heme (the time point at which heme triggers VOC and upregulate selected genes in HbSS mice14-18). We validated the model by the mild but significant upregulation of genes related to endothelial activation and neutrophil and inflammatory monocyte chemoattraction and infiltration in the kidneys of HbSS mice exposed to heme, as measured by QuantiGene (supplemental Figure 9).
Transcriptomic atlas of heme-treated HbAA mice reveals organ-specific response to heme
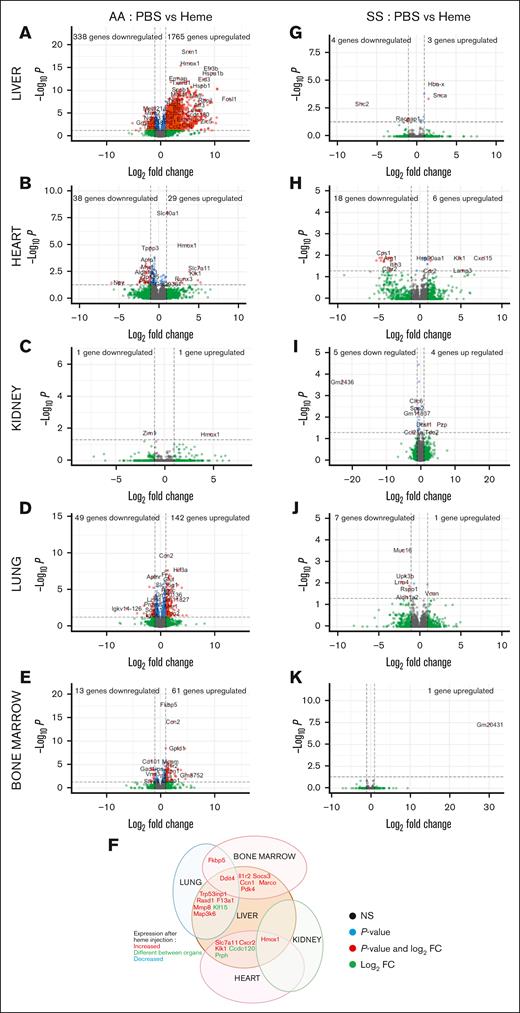
We extended our transcriptomic atlas to the kidney, liver, heart, lung, and bone marrow of heme-injected mice (Figure 4). In HbAA, heme strongly modify the transcriptomes of liver (1765 genes upregulated and 338 downregulated; Figure 4A), heart (29 genes upregulated and 38 downregulated; Figure 4B), lungs (61 genes upregulated and 13 downregulated; Figure 4D), and bone marrow (142 genes upregulated and 49 downregulated; Figure 4E). Heme only upregulated 1 gene and downregulated 1 gene in the kidneys (Figure 4C), with the selected cutoff of log2 fold change ≥1 (P < .05). Concerted responses to heme, evaluated by gene ontology, were only recorded in the HbAA liver, with an FDR <5% (supplemental Figure 10A). These included responses to stress, misfolded proteins, apoptosis, and vascular development (supplemental Figure 10A). The response of HbAA mice to heme seemed remarkably organ specific, with no upregulated or downregulated gene shared across the 5 organs (Figure 4K).
Unexpected resistance of organs of HbSS mice to acute heme toxicity. Volcano plots of the signature in the liver (A), heart (B), kidney (C), lung (D), and BM (E) of HbAA mice injected with heme, compared with HbAA mice injected with PBS. (F) Common DEGs between the different organs of heme-injected HbAA mice. Volcano plots of the signature in the liver (G), heart (H), kidney (I), lung (J), and BM (K) of HbSS mice injected with heme compared with HbSS mice injected with PBS. The red dots represent the upregulated and downregulated genes in HbSS mice, compared with HbAA (adjusted P < .5; log2 FC less than or equal to −1 or ≥ 1). NS, not significant.
Unexpected resistance of organs of HbSS mice to acute heme toxicity. Volcano plots of the signature in the liver (A), heart (B), kidney (C), lung (D), and BM (E) of HbAA mice injected with heme, compared with HbAA mice injected with PBS. (F) Common DEGs between the different organs of heme-injected HbAA mice. Volcano plots of the signature in the liver (G), heart (H), kidney (I), lung (J), and BM (K) of HbSS mice injected with heme compared with HbSS mice injected with PBS. The red dots represent the upregulated and downregulated genes in HbSS mice, compared with HbAA (adjusted P < .5; log2 FC less than or equal to −1 or ≥ 1). NS, not significant.
Transcriptomic atlas of heme-treated HbSS mice reveals a striking tolerance to heme
Contrary to HbAA mice, transcriptomic remodeling by heme was limited in HbSS mice. In the liver, only 3 genes were upregulated and 4 downregulated (Figure 4G); heart, 6 upregulated and 18 downregulated (Figure 4H); kidneys, 4 upregulated and 5 downregulated (Figure 4I); lungs, 1 upregulated and 7 downregulated (Figure 4J); and bone marrow, 1 gene upregulated (Figure 4K), with the selected cutoff. This relative tolerance of HbSS organs to heme is also illustrated by the heat maps of the top upregulated and downregulated genes in heme-injected HbAA and HbSS livers, hearts, and bone marrow (supplemental Figures 11A-C). On the contrary, heme-exposed HbSS lungs resembled heme-exposed HbAA lungs (supplemental Figure 11D).
HbSS and heme-exposed HbAA mice share common upstream pathways, triggered by heme sensing and inflammation
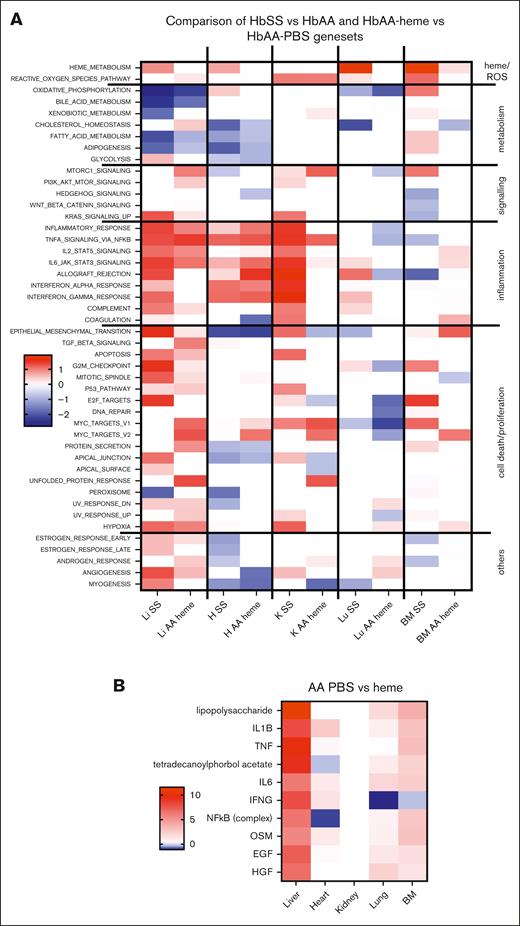
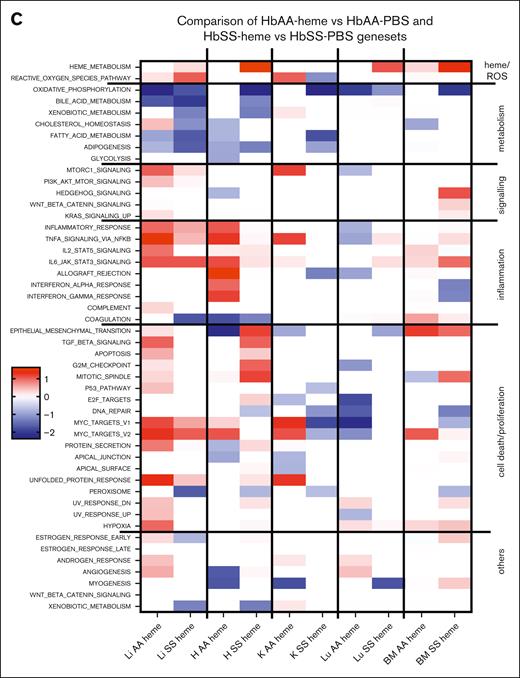
GSEA revealed that heme-exposed HbAA mice (vs PBS) and HbSS mice at rest (vs HbAA) share common gene sets with positive or negative NES, depending on the pathway, particularly in the liver and heart and to some extent in the kidney (Figure 5A). The inflammatory gene sets enriched in the HbSS liver and heart were replicated by the heme injection in HbAA mice. Moreover, both the HbSS and HbAA-heme mice shared common upstream pathways (Figures 2G and 4B), including signaling through TLR4 (annotated LPS). The other pathways included SCD-relevant inflammation,20 mediated by IL-1β, TNF-α, IL-6, and IFN-γ. Even though the HbSS mice injected by heme had only a few DEGs, the more sensitive method of GSEA still identified a few deregulated gene sets, which were similar to the ones found in the HbSS mice and HbAA-heme mice (Figure 4C).
Comparative analyses of the enriched gene sets and upstream pathways modulated by heme in HbAA or HbSS mice. (A) GSEA Hallmark pathways the 5 organs of HbSS compared with HbAA-heme mice. The heat map is built to represent the z score for each pathway, which is calculated as the NES multiplied by the −log10 q value, which is the P value adjusted for FDR. The Hallmarks pathways are grouped manually depending on the overall biological processes to which they can be related. (B) Heat maps of the 10 highest upstream regulators as determined by an Ingenuity Pathway Analyses comparison on HbAA vs AA-heme organs. Of note, the LPS pathway corresponds to TLR4 signaling, a common receptor for both LPS and heme. The heat map was generated with the scores provided by ingenuity pathways. (C) GSEA Hallmark pathways of the 5 organs of HbAA-heme vs HbAA-PBS compared with HbSS-heme vs HbSS-PBS mice. The heat map was generated similar to panel A. EGF, epidermal growth factor; H, heart; HGF, hepatocyte growth factor; K, kidney; Li, liver; Lu, lung; OSM, oncostatin M.
Comparative analyses of the enriched gene sets and upstream pathways modulated by heme in HbAA or HbSS mice. (A) GSEA Hallmark pathways the 5 organs of HbSS compared with HbAA-heme mice. The heat map is built to represent the z score for each pathway, which is calculated as the NES multiplied by the −log10 q value, which is the P value adjusted for FDR. The Hallmarks pathways are grouped manually depending on the overall biological processes to which they can be related. (B) Heat maps of the 10 highest upstream regulators as determined by an Ingenuity Pathway Analyses comparison on HbAA vs AA-heme organs. Of note, the LPS pathway corresponds to TLR4 signaling, a common receptor for both LPS and heme. The heat map was generated with the scores provided by ingenuity pathways. (C) GSEA Hallmark pathways of the 5 organs of HbAA-heme vs HbAA-PBS compared with HbSS-heme vs HbSS-PBS mice. The heat map was generated similar to panel A. EGF, epidermal growth factor; H, heart; HGF, hepatocyte growth factor; K, kidney; Li, liver; Lu, lung; OSM, oncostatin M.
The tolerance of HbSS organs to heme depends on the preexisting, enhanced HO-1 activity
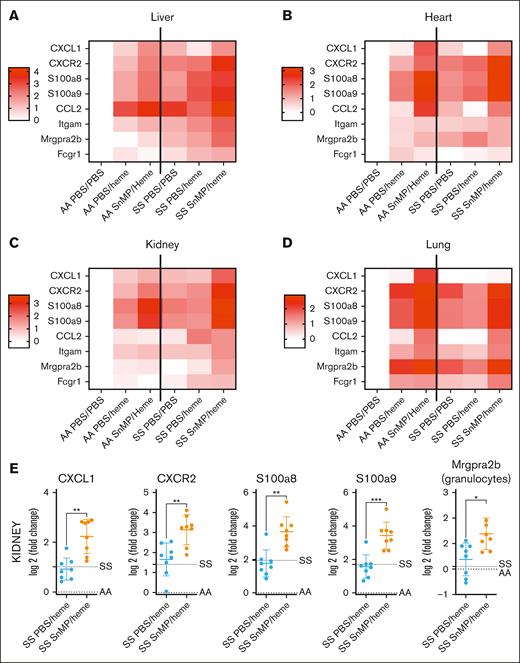
To understand the mechanisms behind the tolerance to heme in HbSS mice, we inhibited HO-1. HO-1–inhibited HbSS mice treated with heme (SnMP/heme) exhibited increased inflammatory gene overexpression and immune infiltrate, as represented by heat maps (Figure 6A-D) and illustrated for the kidney as an example (Figure 6E). In addition, complement activation, measured by C5a in plasma and C5aR1 expression in organs, was enhanced by HO-1 inhibition (Figure 7). These levels often exceeded those observed in the SnMP/heme HbAA mice. The neutrophil-attracting chemokine ligand-receptor couples chemokine (C-X-C motif) ligand 1 and 2 CXCL1/CXCR2 and C5a/C5aR1 were often elevated in the 4 tested organs of SnMP/heme HbSS mice, concomitant with neutrophil infiltration and neutrophil calprotectin S100a8/S100a9 overexpression.
HO-1 inhibition alleviates the resistance of the HbSS mice to heme. Inflammatory genes expression measured by QuanatiGene in the liver (A), heart (B), kidney (C), and lung (D) of HbAA mice or HbSS mice, pretreated or not with SnMP and injected or not by heme. Heat maps representing the average log2 FC of the different groups of mice (n = 8 mice per group for SS PBS/heme and SS SnMP/heme; n = 6 for AA PBS/PBS and SS PBS/PBS; and n = 3 for AA PBS/heme and AA SnMP/Heme). CXCL1 and CXCR2 are chemokine ligand/receptor couple that plays a crucial role in recruiting neutrophils in response to tissue injury. S100a8/S100a9 form the calprotectin, which is released by neutrophils to stimulate proinflammatory responses in hemolytic conditions. Ccl2 is a chemokine for monocytes and immune cells. Itgam is the gene coding for CD11b, marker of myeloid cells. Mrgpra2b is an MCP-counter signature gene for granulocytes. Fcgr1 is Fc gamma receptor 1, an MCP-counter signature gene for monocytes/macrophages. (E) Examples of the data used for the generation of the heat map; showing the increased expression of inflammatory genes and granulocytes infiltrate in the HbSS mice injected with SnMP and heme, compared with the HbSS mice injected with heme alone. The dotted line indicates the average level of the HbAA and HbSS mice. ∗P < .05; ∗∗P < .01; ∗∗∗P < .001; Mann-Whitney test.
HO-1 inhibition alleviates the resistance of the HbSS mice to heme. Inflammatory genes expression measured by QuanatiGene in the liver (A), heart (B), kidney (C), and lung (D) of HbAA mice or HbSS mice, pretreated or not with SnMP and injected or not by heme. Heat maps representing the average log2 FC of the different groups of mice (n = 8 mice per group for SS PBS/heme and SS SnMP/heme; n = 6 for AA PBS/PBS and SS PBS/PBS; and n = 3 for AA PBS/heme and AA SnMP/Heme). CXCL1 and CXCR2 are chemokine ligand/receptor couple that plays a crucial role in recruiting neutrophils in response to tissue injury. S100a8/S100a9 form the calprotectin, which is released by neutrophils to stimulate proinflammatory responses in hemolytic conditions. Ccl2 is a chemokine for monocytes and immune cells. Itgam is the gene coding for CD11b, marker of myeloid cells. Mrgpra2b is an MCP-counter signature gene for granulocytes. Fcgr1 is Fc gamma receptor 1, an MCP-counter signature gene for monocytes/macrophages. (E) Examples of the data used for the generation of the heat map; showing the increased expression of inflammatory genes and granulocytes infiltrate in the HbSS mice injected with SnMP and heme, compared with the HbSS mice injected with heme alone. The dotted line indicates the average level of the HbAA and HbSS mice. ∗P < .05; ∗∗P < .01; ∗∗∗P < .001; Mann-Whitney test.
Complement C5a/C5aR1 axis is a key inflammatory pathway, unleashed upon HO-1 inhibition and treatment with heme. (A) Plasma (C5a; measured by ELISA). (B-E) C5aR1 gene expression measured by QuantiGene in liver (B), heart (C), kidney (D), and lung (E). C5a is powerful anaphylatoxin generated after complement cascade activation, which signals through its main receptor C5aR1 on a variety of cells, mainly neutrophils, inflammatory monocytes, macrophages, and endothelial cells. ∗P < .05; ∗∗P < .01; ∗∗∗P < .001. ns, not significant.
Complement C5a/C5aR1 axis is a key inflammatory pathway, unleashed upon HO-1 inhibition and treatment with heme. (A) Plasma (C5a; measured by ELISA). (B-E) C5aR1 gene expression measured by QuantiGene in liver (B), heart (C), kidney (D), and lung (E). C5a is powerful anaphylatoxin generated after complement cascade activation, which signals through its main receptor C5aR1 on a variety of cells, mainly neutrophils, inflammatory monocytes, macrophages, and endothelial cells. ∗P < .05; ∗∗P < .01; ∗∗∗P < .001. ns, not significant.
Discussion
Chronic multiorgan dysfunction is a hallmark of patients with SCD. To get an unbiased overall characterization of each organ’s status and underlying mechanisms of dysfunction, we report, to our knowledge, the first bulk transcriptomic atlas of SCD mice. This atlas includes data sets for the liver, heart, kidney, lung, and bone marrow, comparing HbSS mice with HbAA mice. It unveils distinct transcriptomic alterations in each organ, with a common pervasive inflammatory phenotype. This immune dysregulation included innate immune signaling, complement activation, and recruitment of myeloid infiltrates. In the liver, heart, and kidney, this inflammatory pattern is partially recapitulated by heme injection in control HbAA mice, reinforcing the central role of heme in SCD chronic organ injuries. Remarkably, HbSS mice exhibit very few DEGs upon heme administration. This tolerance to heme is mediated by preexisting HO-1 upregulation, enabling SCD survival amid severe hemolysis.
Although HbSS Townes mice are the most widely used model in SCD research, the mechanisms of organ injury are still poorly understood. Transcriptomic analysis enables the deciphering of the mouse model and, therefore, could offer insights into human organ-specific SCD pathology, which often takes second place to VOC, despite its major contribution to morbidity and mortality. HbSS mice presented signs of anemia and organ injury at the time of testing, consistent with the extent of transcriptomic changes. Liver was strongly affected both at the gene and functional level, contrary to the kidney. No DEG was shared across all organs, and no gene set was similarly affected.
Despite these differences, transcriptomic analysis revealed key biological processes involved in tissue damage in HbSS mice, including heme metabolism, ROS generation, inflammation (including TLR4, IFN type I and IL-6 signaling, and complement), coagulation, cell cycle, and apoptosis. These pathways are consistent with findings in blood cells from patients with SCD.3-7,19,21 Proinflammatory cytokines stimulate endothelial adhesion molecule expression, while promoting leukocyte adhesion and triggering the ensuing vaso-occlusive events.22 Activated monocytes, neutrophils, and platelets are involved in the chronic inflammation of SCD.21 We adapted the murine MCP-counter tool, allowing the detection of immune infiltrate from transcriptomic signatures, to a more high-throughput approach by applying the QuantiGene method. We used previously identified highly specific genes (Mrgpra2b for granulocytes and FcgR1 for monocytes/macrophages11) and successfully validated the findings by flow cytometry. A strong infiltration by neutrophils and inflammatory monocytes was evidenced in the liver, in agreement with a recent single-cell RNA-seq and spatial transcriptomics study.23 These cells were likely attracted by CXCL1 and CCL-2 and by complement activation. Indeed, the anaphylatoxin C5a was elevated in the plasma of HbSS mice, and C5aR1 was consistently overexpressed in the liver, heart, kidney, and lung tissue, in relation to the myeloid infiltrate. Complement is emerging as a key factor in SCD pathophysiology and organ injury, and clinical trials are testing its inhibition as a therapeutic strategy.24-28 The upregulation of the neutrophil chemoattractant CXCL1, its receptor CXCR2, and the alarmin calprotectin (S100a8/S100a9) found here contribute to the inflammatory response and VOC.29,30 Upregulation of CCL-2 through IFN-I induced monocyte transmigration and differentiation into tissue monocyte–derived macrophages,31 consistent with our findings. Granulocyte infiltrate was also evidenced in the lungs, where it may promote lung injury, triggering VOC/acute chest syndrome.32 Kidney and heart showed greater myeloid infiltrate heterogeneity, despite homogenous increase in inflammatory mediators, albeit to a lesser extent than liver. These changes may be exacerbated by age, because transcriptomic analysis of HbSS kidney at 6 months revealed an increased number of DEGs (1029 vs 63 here) involved in heme and iron metabolism, electrolyte balance, immunity (including complement and IFN-α/β signaling), and fatty acid metabolism, etc,33 similar to our findings in liver and heart. Although the bone marrow inflammatory signature did not reach statistical significance here, previous transcriptomic analysis of bone marrow–sorted mesenchymal stem cells from HbSS mice, compared with HbAS, found alterations in TLR4 and NF-κB activation, ROS accumulation, and decreased self-renewal.34
Even though the consequences of microcirculation anomalies are at the forefront of clinical practice, intravascular hemolysis and heme release are also key triggers of the inflammatory process.35 TLR4 signaling is induced by heme,14,15,36-39 which may explain in part the inflammatory pattern we detect here. Indeed, heme metabolism, driven by HO-1 overexpression, is the dominant pathway in all tested organs, supporting its major contribution to chronic lesions. In SCD, heme induces 2 opposite effects: a direct sterile inflammation and anti-inflammatory pathways,40,41 triggered by the induction of heme-degrading HO-1 and by transcriptional reprogramming, making cells more tolerant to heme overload in HbSS mice. Intravascular hemolysis in SCD is thought to occur as sporadic peaks, leading to bursts of exposure to cell-free and globin-free heme. Hemolytic episodes may promote acute complications and worsen chronic tissue injury. To evaluate the protective effect of chronic HO-1 overexpression against tissue damage in HbSS mice, we modeled a spike of intravascular hemolysis and de novo exposure to heme by injecting a bolus of heme. In HbAA mice, heme triggered an organ-specific response, with no DEGs shared between the organs. Nevertheless, GSEA revealed that heme injection effectively recapitulated the SCD-relevant inflammation in the liver and heart, with upstream pathways including TLR4 signaling, likely mediated by heme15,36-38 and inflammatory signaling driven by IL-1β, TNF-α, IL-6, and IFN-γ. These results support the key contribution of heme to organ injury in SCD.
In contrast to HbAA, transcriptomic remodeling by heme was minimal in HbSS mice, indicating a remarkable tolerance to heme. Only heme-exposed HbSS lung showed similarity to heme-exposed HbAA lung. The limited prior tolerance to heme could explain why the lung is the target of one of the most severe acute complications in SCD: the acute chest syndrome. This relative heme tolerance in HbSS organs depended on preexisting, enhanced HO-1 expression and activity, because its pharmacological inhibition by SnMP reversed the protection, consistent with other SCD mouse models.13 HO-1–inhibited HbSS mice treated with heme showed increased immune infiltrates, inflammatory gene overexpression, and significant complement activation, as indicated by C5a levels in plasma and C5aR1 overexpression in organs. These levels often exceeded those observed in SnMP/heme HbAA mice. These results suggest that the elevated basal HO-1 in HbSS mice may be crucial for escaping heme-mediated inflammation, despite the well-described occurrence of vascular stasis.14-18 This adaptation echoes the notion of disease tolerance mechanisms in malaria,42,43 in which cell-free heme, released during the blood stage of the parasite cycle, induces tissue damage-control mechanisms via HO-1 upregulation, promoting tolerance to Plasmodium spp. infection.
Overall, our transcriptomic atlas of SCD mice at resting state uncovers a pervasive inflammatory phenotype across all tested organs, with each tissue showing a unique extent of transcriptomic alteration. The chronic overexpression of HO-1 in SCD mice may be essential for them to cope with bouts of extracellular heme, potentially providing insights into how patients can survive vaso-occlusions and acute chest syndrome.44,45 Therefore, this work suggests that the concept of disease tolerance could be extended to noninfectious conditions such as SCD, offering new perspectives on understanding chronic disease resilience.
Acknowledgments
The authors are grateful for the excellent technical assistance from the Centre d’Expérimentations Fonctionnelles team and the Genotyping team of the Centre de Recherche des Cordeliers, as well as for their support with animal experimentation. The authors thank the team at the Genom’IC platform, Institut Cochin, INSERM U1016 for the next-generation sequencing analyses, and the Plateforme d’exploration des fonctions rénales du petit animal (located in the Cordeliers Research Center, team Renal Physiology and Tubulopathies, G. Brideau) for the evaluation of the liver and kidney function parameters in the blood of the mice. The authors thank N. Merle for the help with the Ingenuity Pathways Analyses.
A.G. received a fellowship from the Fondation pour la Recherche Médicale. This project was supported in part by the SVAR Complement excellence award (L.T.R.).
Authorship
Contribution: L.T.R. and A.G. designed the research; A.G., J.P., J.L., M.R., E.V., and T.R.-R. performed the research; A.G. and L.T.R. analyzed the data; A.G., L.T.R., O.B.-B., J.D.D., and G.C. discussed the data; A.G., O.B.-B., and L.T.R. wrote the manuscript; and all authors revised and approved the manuscript.
Conflict-of-interest disclosure: L.T.R. reports research grants from CSL Behring and Roche on intravascular hemolysis and sickle cell disease. O.B.-B. reports a research grant from Roche. The remaining authors declare no competing financial interests.
Correspondence: Lubka T. Roumenina, Cordeliers Research Center, INSERM UMRS 1138; 15 rue de l'Ecole de Medecine; 75006 Paris, France; email: lubka.roumenina@sorbonne-universite.fr.
References
Author notes
All raw data from the RNA sequencing are publicly available in Zenado (accession numbers are as follows: bone marrow from HbAA mice injected or not with heme, 10.5281/zenodo.10961162; bone marrow from HbSS mice injected or not with heme, 10.5281/zenodo.10962782; liver from HbAA mice injected or not with heme, 10.5281/zenodo.10963640; liver from HbSS mice injected or not with heme, 10.5281/zenodo.10962971; kidney from HbAA mice injected or not with heme, 10.5281/zenodo.10963926; kidney from HbSS mice injected or not with heme, 10.5281/zenodo.10964023; heart from HbAA mice injected or not with heme, 10.5281/zenodo.10964042; heart from HbSS mice injected or not with heme, 10.5281/zenodo.10964159; lung from HbAA mice injected or not with heme, 10.5281/zenodo.10965912; and lung from HbSS mice injected or not with heme, 10.5281/zenodo.10966094).
The full-text version of this article contains a data supplement.

