Key Points
Over hypothermic storage, donor age was found to be a significant factor influencing the deformability of RBCs, regardless of biological age.
Heterogenous RCCs from teenage male donors have higher levels of biologically old and poorer quality RBCs with impaired deformability.
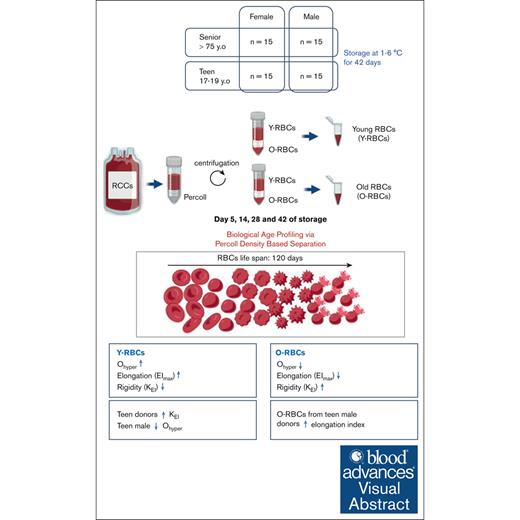
Visual Abstract
The quality of stored red cell concentrates (RCCs) has been linked to the biological age distribution of red blood cell (RBC) subpopulations. Teenage male RCCs contain higher proportions of biologically old RBCs, with poorer quality. This study sought to assess the contribution of donor sex and age on the deformability characteristics of RBC subpopulations in stored RCCs. On days 5, 14, 28, and 42 of hypothermic storage, RCCs from healthy teenage male (n = 15), senior male (n = 15), teenage female (n = 15), and senior female (n = 15) donors were biologically age profiled. The deformability of the resulting young RBCs and old RBCs (O-RBCs) was assessed using ektacytometry. Over storage, donor age was the biggest factor influencing the rheology of RBC subpopulations. Teenage male RCCs had the largest reduction in Ohyper (osmolality in the hypertonic region corresponding to 50% of the maximum RBC elongation [EImax]). The strongest correlations between Ohyper and mean corpuscular hemoglobin content (R2 > 0.5) were witnessed with O-RBCs from senior donors, and to a lesser extent with teenage males. Teen O-RBCs, particularly from males, had higher elongation indices, both under isotonic conditions and in the presence of an increasing osmotic gradient. Teen RBCs, regardless of biological age, were discovered to be more rigid (higher shear stress required to reach half the EImax). Donor variation in the age distribution of RBC subpopulations and its downstream effect on deformability serves as further evidence that factors beyond storage could potentially affect RCC quality and transfusion outcomes.
Introduction
Worldwide, red cell concentrates (RCCs) are frequently used as a lifesaving therapeutic.1,2 Although patient outcomes have improved because of advancements aimed at maintaining the quality of stored blood components, transfusion of RCCs is still associated with an increased risk of adverse clinical outcomes.3-6 It has been suggested that the deformability of red blood cells (RBCs) can be used as a critical indicator of their quality and posttransfusion viability.7-12 Deformability, defined as the ability of RBCs to adjust their shape to dynamically changing flow conditions, contributes to the physiological role of RBCs, which is to deliver oxygen to tissues.9,13,14 For RBCs to traverse through the microvasculature and splenic sinuses, deformability is influenced by biophysical factors such as RBC cellular morphology, RBC cytoplasmic viscosity or mean corpuscular hemoglobin content (MCHC), the surface area-to-volume (S:V) ratio of RBCs, and finally the mechanical properties of RBC membranes.15-17
The normal life span of RBCs under physiological conditions is 120 days.18 This naturally occurring aging process results in a heterogeneous population of RBCs with varying biological ages in blood circulation, from recently matured, less dense, young RBCs (Y-RBCs) to dense, senescent, old RBCs (O-RBCs).18,19 A decline in metabolic activity, together with progressive failure of both ion homeostasis and antioxidant defenses has been previously associated with RBC biological aging.20-31 The concentration of adenosine triphosphate, which is crucial for maintaining RBC deformability and cellular functions, declines with biological aging. Moreover, donor age, sex, and genetic factors significantly influence the levels of glycolytic metabolites, particularly adenosine triphosphate and hypoxanthine, in RBCs, which in turn exacerbate alterations in cell morphology and function.32 The deformability of RBCs degrades during normal biological aging because of RBC membrane remodeling that is associated with membrane lipid scrambling, phosphatidylserine externalization, and depletion of carnitine pools, ultimately resulting in progressive failure in membrane lipid repair.33,34 This, in turn, contributes to progressive cell shape transformation, microvesiculation, and expression of cell surface removal markers.21,35-39 Losing membrane fragments due to microvesiculation decreases the S:V ratio, thereby reducing the deformability of RBCs and increasing their osmotic and mechanical fragility.21,40-44 Furthermore, loss of intracellular water during RBC aging because of progressive failure of the ion homeostasis, decreases the mean corpuscular volume of RBCs, and increases the density of RBC cytoplasmic contents.16,17,45,46 Indeed, past in vitro investigations have revealed that, under nonisotonic conditions, Y-RBCs exhibit lower rigidity and higher Ohyper (the osmolality in the hypertonic region corresponding to 50% of the maximum RBC elongation [EImax]) measurements, whereas O-RBCs are more susceptible to destruction under a relatively lower level of shear stress and osmolality.47,48 The reduced deformability of O-RBCs also results in impaired perfusion and oxygen delivery because of vascular blockages and an increased propensity for O-RBCs to undergo splenic removal.49-56 A growing number of studies have associated donor characteristics, blood processing methods, and storage duration with RBC deformability.1,8,57-74 Assessment of RBC deformability during cold storage has repeatedly demonstrated a significant reduction at the beginning of the second week of storage that progresses with the standard 42-day storage duration.75,76 Blood units from female donors have demonstrated superior quality measurements compared with male RBCs, which include reduced susceptibility to storage-induced hemolysis, reduced mechanical fragility, and better rheological properties.47,57,77-80 Most recently, we found that RCCs from teenage males (TM) contain elevated numbers of small, hemoglobin-packed O-RBCs with increased susceptibility over storage to hemolyze under oxidative stress.81,82
The combined impact of RBC biological age, the storage lesion, and donor factors on RBC deformability has, to our knowledge, never been comprehensively examined in a single study. The main purpose of this study was to evaluate the contribution of RBC subpopulations with different biological ages to the deformability of RCCs during hypothermic storage. This study provides a comprehensive assessment of the rheological properties of Y- and O-RBCs, highlighting the various deformability indices and their association with donor sex and age. We hypothesized that donors with higher concentrations of O-RBCs immediately after donation and into storage, will have reduced deformability parameters.
Material and Methods
Blood collection
Sixty citrate-phosphate-dextrose/saline-adenine-glucose-mannitol (CPD/SAGM) RCCs from consenting donors were produced by the red cell filtration/buffy coat method at Canadian Blood Services (CBS) (Calgary, AB, Canada). Teenage (aged 17-19 years, n = 30) and senior (aged ≥75 years, n = 30) donors were separated by sex: TM (n = 15), teenage female (TF; n = 15), senior male (SM; n = 15), and senior female donors (SF; n = 15). A total of 60 unique donors was practically feasible and determined from historic CBS quality monitoring data to be a sample size that was >95% powered to detect a significant difference in RBC quality parameters.83 All RCCs were shipped within 24 hours of leucodepletion and were stored for 42 days (1°C-6°C) in a monitored refrigerator, between testing days (day 5, 14, 28, and 42 ±3 days]).
RBC hematologic indices
Samples were collected from well-mixed RCCs through the aseptic insertion of sterile couplers (Fresenius Kabi, Bad Homburg, Germany), and the required volumes drawn with 50 mL syringes (Becton Dickinson, Erembodegem, Belgium). On each testing day and for each donor’s RCC, the concentration of RBCs, hematocrit, mean corpuscular volume, and MCHC were acquired using a Beckman DxH 520 hematology analyzer (Beckman Coulter Inc, Brea, CA).
Biological age profiling of RCCs by Percoll density gradient centrifugation
To isolate portions of young, less-dense RBCs from old, more dense RBCs, Percoll (Percoll GE Healthcare, Sigma-Aldrich, St. Louis, MO) density gradient centrifugation was performed, as previously described,82 at 4 time points (day 5, 14, 28, and 42 [±3 days]) during hypothermic storage. Briefly, a panel of 8 solutions were chosen based on the MCHC measurement of each donor’s RCC on the day of testing, with densities ranging from 1.083 g/mL to 1.107 g/mL (supplemental Figure 1A). RBCs were layered on the Percoll solutions and centrifuged so separate RBC subpopulations. The volumes of isolated subpopulations were measured using a calibrated pipette. Based on the Gaussian distribution of RBCs, the top (26.1% ± 7.5%) and bottom (18.8% ± 8.5%) portions of RBCs were isolated as Y-RBCs and O-RBCs, respectively, which were then adjusted to a hematocrit between 40% and 55%. These subpopulations represent cells at the extreme ends of biological aging (supplemental Figure 1A). On each testing day, a population of unseparated RBCs (U-RBCs) was also retained as a control group. Using a hematology analyzer, RBC indices were determined to characterize the U-RBCs and resulting age-separated Y-RBCs and O-RBCs.
Assessment of RBC rheological properties
RBC deformability was assessed using an ektacytometer (LORRCA MaxSis, RR Mechatronics, Zwaag, The Netherlands).84,85 An aliquot of 9 μL of U-RBCs, O-RBCs, or Y-RBCs was diluted in 1 mL of isotonic polyvinylpyrrolidone solution and subjected to a shear stress between 0.53 Pa and 30 Pa. Resulting RBC deformability curves were transformed using an Eadie-Hofstee linearization technique, resulting in the following deformability parameters: EImax and KEI (shear stress required to reach half of the EImax) (Table 1; supplemental Figure 1B).84 Osmotic gradient curves of RBC deformability were obtained as a continuous function of suspending medium osmolality. A 200-μL aliquot of either U-RBCs or RBC subpopulation (Y-RBCs or O-RBCs) were diluted in 5 mL of isotonic polyvinylpyrrolidone solution and the elongation index of RBCs measured using the LORRCA across extracellular osmolalities ranging from 100 to 600 mOsm/kg at a constant shear stress (30 Pa) and temperature (37°C). The LORRCA indices (EImin, EImax, EIhyper, Omin, OEImax, and Ohyper) (definitions provided in Table 1) were determined and assessed for any associations with the biological age of RBCs, donor sex and age, or hypothermic storage (supplemental Figure 1C).
Definitions of ektacytometry indices used for assessing RBC deformability
| LORRCA Index | Definition |
| EImax | Maximal deformability at isotonic osmolality |
| Omin | Osmolality at which 50% of RBC lyse, minimum osmolality |
| Ohyper | Hypertonic osmolality at which 50% of EImax is achieved |
| EImin | Elongation index at hypotonic osmolality (Omin) |
| EIhyper | Elongation index (1/2 of EImax) at hypertonic osmolality |
| OEImax | Osmolality at which maximal EI is achieved |
Statistical analysis
Statistical analysis was performed using GraphPad Prism version 9.4.1 (GraphPad Software Inc, La Jolla, CA). Mixed-model analysis for repeated measurements was performed in order to estimate the effects of subpopulation (U-RBCs, Y-RBCs, and O-RBCs), sex (female or male), age (teenager or senior), group (TM, TF, SF, and SM) and storage time (5, 14, 28, and 42 days) and their various interactions. In all analyses, a P value <.05 was considered statistically significant. Correlations between Ohyper and MCHC were assessed with a linear regression model, and measured by the coefficient of determination, or R2. R2 of <0.3 indicated a weak relationship, whereas R2 values between 0.3 and 0.7 were considered a moderate correlation. R2 of >0.7 were designated as very strong relationships.
This study was reviewed and approved by the Canadian Blood Services and the University of Alberta Health research ethics boards. It was conducted in accordance with the Declaration of Helsinki.
Results
The Ohyper measurements of RBC subpopulations across hypothermic storage were significantly affected by both donor age and sex
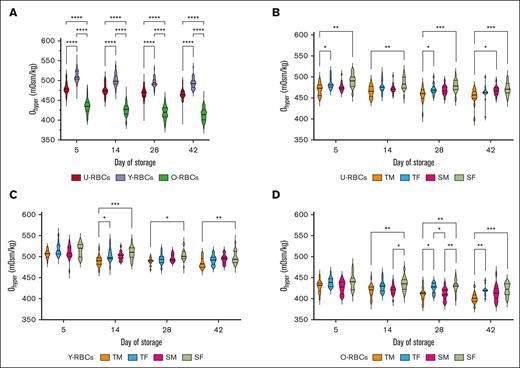
A gauge of RBC hydration and viscosity, Ohyper measurements demonstrated significant differences when RBC subpopulations were compared. O-RBCs exhibited the lowest Ohyper measurements at each time point and thus are likely more dehydrated than U-RBCs, and especially Y-RBCs, which possessed the highest Ohyper (P ≤ .0001; Figure 1A). U-RBCs from TM donors consistently exhibited significantly lower Ohyper values than SF donors across all time points, whereas Y- and O-RBCs from TM donors showed significantly lower Ohyper values than SF donors starting from day 14 (P ≤ .05; Figure 1B-D). Compared with TM, after at least 14 days of cold storage, O-RBCs from TF demonstrated higher Ohyper (P ≤ .05; Figure 1D). Except for the O-RBC subpopulations, age stratification of the donors revealed that seniors typically possessed higher Ohyper values than teenagers after at least 14 days of storage (P ≤ .05; supplemental Figure 2A,C,E). When all the donors’ Ohyper data were stratified by sex alone, on most storage days regardless of the biological age of subpopulations, female RBCs exhibited higher Ohyper measurements (P ≤ .05; supplemental Figure 2B,D,F).
Effect of age and sex stratification on the Ohyper of biological age–profiled RCCs. (A) Ohyper measurements for the 3 populations of RBCs (U-RBCs, Y-RBCs, and O-RBCs) examined without any stratification based on donor characteristics. (B-D) Ohyper conveyed as age and sex stratified for U-RBCs (B), Y-RBCs (C), and O-RBCs (D). Multiple comparisons tests were used to show significant differences (∗∗∗∗P < .0001; ∗∗∗P < .001; ∗∗P < .01; ∗P < .05). Median and interquartile ranges (IQR) are indicated as horizontal lines on the violin plots.
Effect of age and sex stratification on the Ohyper of biological age–profiled RCCs. (A) Ohyper measurements for the 3 populations of RBCs (U-RBCs, Y-RBCs, and O-RBCs) examined without any stratification based on donor characteristics. (B-D) Ohyper conveyed as age and sex stratified for U-RBCs (B), Y-RBCs (C), and O-RBCs (D). Multiple comparisons tests were used to show significant differences (∗∗∗∗P < .0001; ∗∗∗P < .001; ∗∗P < .01; ∗P < .05). Median and interquartile ranges (IQR) are indicated as horizontal lines on the violin plots.
The negative correlation between Ohyper and MCHC was strongest in biologically O-RBCs from TM and senior donors over most of the hypothermic storage period
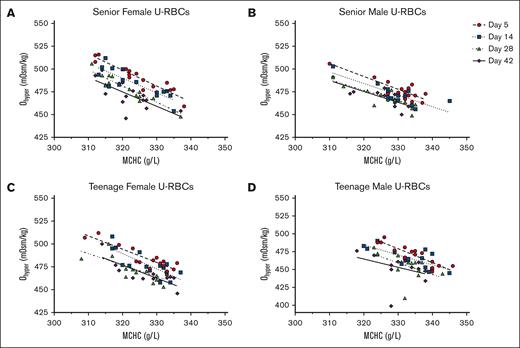
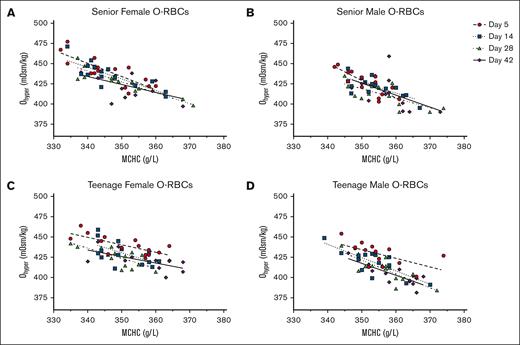
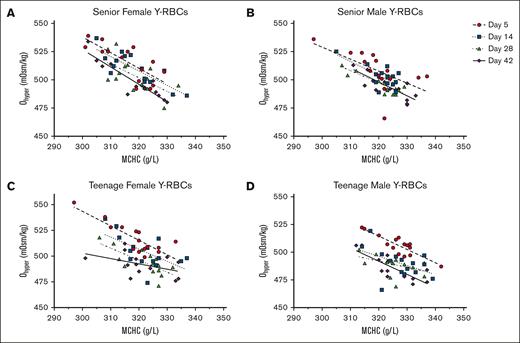
Individually, MCHC and Ohyper have both been shown to correlate with RBC biological age and exhibit a negative correlation to each other.15,82 However, donor factors including age and sex were not extensively considered in such analyses.15 In alignment with these previous research findings, a consistent negative correlation was observed between the Ohyper and MCHC measurements of each RBC subpopulation throughout the majority of the hypothermic storage period. This correlation was most evident when analyzing osmotic gradient curves for the U-RBC and O-RBC subpopulations, stratified by age and sex (Figures 2-4). Analysis of the U-RBC and O-RBC subpopulations revealed that senior donors exhibit correlations between Ohyper and MCHC, with R2 values of >0.5 that persisted until day 28 or 42 of hypothermic storage (Tables 2 and 3; Figures 2 and 3). The correlation between Ohyper and MCHC in O-RBCs from TM donors was not as strong at day 5; however, R2 values exceeded 0.5 as the storage period progressed (Table 3; Figure 3D). This contrasted with the findings for TF donors, for whom the correlation between Ohyper and MCHC in O-RBCs did not show similar strength (Table 3; Figure 3C). Early in hypothermic storage, correlation between MCHC and Ohyper was more evident in TF donors regardless of their biological age. However, with increasing storage time, Y- and O-RBCs from TF donors exhibited weaker correlations, with R2 values of ∼0.5 and lower (Tables 3 and 4; Figures 3 and 4).
For U-RBCs, the correlations between Ohyper and MCHC throughout storage and based on donor characteristics. Across hypothermic storage testing points, Ohyper and MCHC correlations for U-RBCs are shown as age and sex stratified into the following donor groups: SF (A), SM (B), TF (C), and TM (D). The corresponding R2 values are provided in Table 2.
For U-RBCs, the correlations between Ohyper and MCHC throughout storage and based on donor characteristics. Across hypothermic storage testing points, Ohyper and MCHC correlations for U-RBCs are shown as age and sex stratified into the following donor groups: SF (A), SM (B), TF (C), and TM (D). The corresponding R2 values are provided in Table 2.
For O-RBCs, the correlations between Ohyper and MCHC throughout storage and based on donor characteristics. Across hypothermic storage testing points, Ohyper and MCHC correlations for O-RBCs are shown as age and sex stratified into the following donor groups: SF (A), SM (B), TF (C), and TM (D). The corresponding R2 values are provided in Table 3.
For O-RBCs, the correlations between Ohyper and MCHC throughout storage and based on donor characteristics. Across hypothermic storage testing points, Ohyper and MCHC correlations for O-RBCs are shown as age and sex stratified into the following donor groups: SF (A), SM (B), TF (C), and TM (D). The corresponding R2 values are provided in Table 3.
For Y-RBCs, the correlations between Ohyper and MCHC throughout storage and based on donor characteristics. Across hypothermic storage testing points, Ohyper and MCHC correlations for Y-RBCs are shown as age and sex stratified into the following donor groups: SF (A), SM (B), TF (C), and TM (D). The corresponding R2values are provided in Table 4.
For Y-RBCs, the correlations between Ohyper and MCHC throughout storage and based on donor characteristics. Across hypothermic storage testing points, Ohyper and MCHC correlations for Y-RBCs are shown as age and sex stratified into the following donor groups: SF (A), SM (B), TF (C), and TM (D). The corresponding R2values are provided in Table 4.
Coefficients of determination (R2 values) for the relationship between Ohyper and MCHC among blood donor groups’ U-RBCs across cold storage
| U-RBCs . | n . | Day 5 . | Day 14 . | Day 28 . | Day 42 . |
|---|---|---|---|---|---|
| Donor group . | Goodness of fit R2 . | Goodness of fit R2 . | Goodness of fit R2 . | Goodness of fit R2 . | |
| SFs | 15 | 0.8765 | 0.7114 | 0.8280 | 0.4670 |
| TFs | 15 | 0.8050 | 0.6217 | 0.5529 | 0.6594 |
| SMs | 15 | 0.7278 | 0.6749 | 0.6123 | 0.6494 |
| TMs | 15 | 0.8011 | 0.5637 | 0.2785 | 0.1336 |
Coefficients of determination (R2 values) for the relationship between Ohyper and MCHC among blood donor groups’ biologically O-RBCs across cold storage
| O-RBCs . | n . | Day 5 . | Day 14 . | Day 28 . | Day 42 . |
|---|---|---|---|---|---|
| Donor group . | Goodness of fit R2 . | Goodness of fit R2 . | Goodness of fit R2 . | Goodness of fit R2 . | |
| SFs | 15 | 0.6626 | 0.6663 | 0.8242 | 0.2973 |
| TFs | 15 | 0.5163 | 0.3495 | 0.5429 | 0.4128 |
| SMs | 15 | 0.6969 | 0.5081 | 0.5227 | 0.2391 |
| TMs | 15 | 0.3576 | 0.6251 | 0.6432 | 0.6411 |
Coefficients of determination (R2 values) for the relationship between Ohyper and MCHC among blood donor groups’ biologically Y-RBCs across cold storage
| Y-RBCs . | n . | Day 5 . | Day 14 . | Day 28 . | Day 42 . |
|---|---|---|---|---|---|
| Donor group . | Goodness of fit R2 . | Goodness of fit R2 . | Goodness of fit R2 . | Goodness of fit R2 . | |
| SFs | 15 | 0.5837 | 0.6838 | 0.3840 | 0.8408 |
| TFs | 15 | 0.6848 | 0.3667 | 0.5356 | 0.2033 |
| SMs | 15 | 0.3590 | 0.4815 | 0.6744 | 0.6437 |
| TMs | 15 | 0.7568 | 0.2217 | 0.1980 | 0.6585 |
RBC biological age significantly affected elongation parameters, EImin and EIhyper, while donor age and sex impacted the elongation indices of RBC subpopulations to different extents
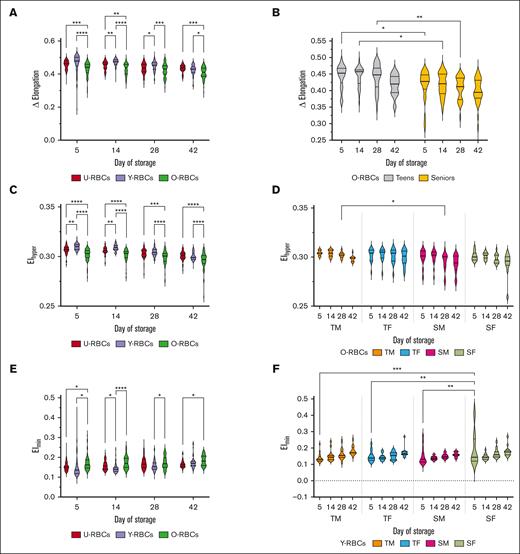
The variation in delta elongation, representing the difference between EImax and EImin, was significantly different between the RBC subpopulations. The delta elongation calculated for O-RBCs was consistently lower over the hypothermic storage period than the U- and Y-RBC groups (P ≤ .05; Figure 5A). Age stratification of osmoscan data from O-RBCs revealed a larger delta elongation within teenage donors than senior donors (P ≤ .05; Figure 5B). EIhyper, the elongation index at Ohyper, was significantly lower in O-RBCs than U- and Y-RBCs across the hypothermic storage period (Figure 5C). In O-RBCs, only the age of donors was found to influence EIhyper, with TMs demonstrating higher EIhyper than SMs at day 28 of hypothermic storage (P ≤ .05; Figure 5D; supplemental Figure 3A-B). The Omin value shows the osmolality at which RBC deformability is at its lowest EImin, which is indicative of the average S:V ratio of the cells. O-RBCs exhibited higher EImin than U-RBCs on days 5 and 42, and compared with Y-RBCs on days 5, 14, and 28 (P ≤ .05; Figure 5E). Upon donor age and sex stratification, significant differences in EImin were observed within Y-RBCs from SF donors compared with all other donor groups at day 5 (P≤.01; Figure 5F). Age and sex stratification of the EImin values from the different biological age subpopulations revealed only donor age significantly affected EImin in O-RBCs whereas donor sex and age affected EImin in Y-RBCs (P < .05; supplemental Figure 3C-F). On day 5 of hypothermic storage, seniors and females exhibited significantly increased EImin values in Y-RBCs (P ≤ .05), whereas on day 5 and day 28, only senior donors had higher EImin values in O-RBCs (P ≤ .05; supplemental Figure 3C-E).
Effect of age and sex stratification on multiple elongation measurements taken under an osmotic gradient of biological age–profiled RCCs. (A) Delta elongation measurements for the 3 populations of RBCs (U-RBCs, Y-RBCs, and O-RBCs) without any stratification based on donor characteristics. (B) Delta elongation conveyed as age stratified for O-RBCs only. (C) EIhyper measurements for the 3 populations of RBCs (U-RBCs, Y-RBCs, and O-RBCs) without any stratification based on donor characteristics. (D) EIhyper conveyed as age and sex stratified for O-RBCs only. (E) EImin measurements for the 3 populations of RBCs (U-RBCs, Y-RBCs, and O-RBCs) without any stratification based on donor characteristics. (F) EImin conveyed as age and sex stratified for Y-RBCs only. Multiple comparisons tests were used to show significant differences (∗∗∗∗P < .0001; ∗∗∗P < .001; ∗∗P < .01; ∗P < .05). Median and IQR are indicated as horizontal lines on the violin plots.
Effect of age and sex stratification on multiple elongation measurements taken under an osmotic gradient of biological age–profiled RCCs. (A) Delta elongation measurements for the 3 populations of RBCs (U-RBCs, Y-RBCs, and O-RBCs) without any stratification based on donor characteristics. (B) Delta elongation conveyed as age stratified for O-RBCs only. (C) EIhyper measurements for the 3 populations of RBCs (U-RBCs, Y-RBCs, and O-RBCs) without any stratification based on donor characteristics. (D) EIhyper conveyed as age and sex stratified for O-RBCs only. (E) EImin measurements for the 3 populations of RBCs (U-RBCs, Y-RBCs, and O-RBCs) without any stratification based on donor characteristics. (F) EImin conveyed as age and sex stratified for Y-RBCs only. Multiple comparisons tests were used to show significant differences (∗∗∗∗P < .0001; ∗∗∗P < .001; ∗∗P < .01; ∗P < .05). Median and IQR are indicated as horizontal lines on the violin plots.
The elongation of RBCs during cold storage was predominantly influenced by the age of the donor and the biological age of RBCs
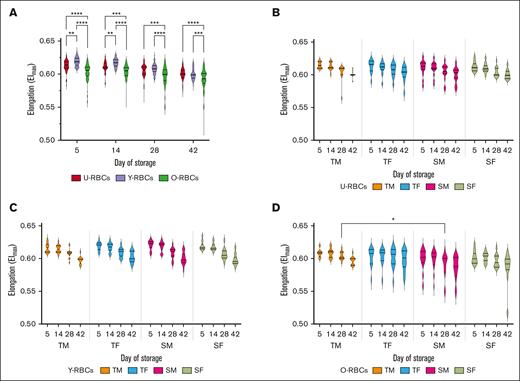
EImax, representing the maximal deformability obtained near the isotonic osmolality, was measured for each RBC subpopulations from donors at the extremes of the age spectrum. Overall, a significant decrease in EImax was observed with the biological aging of RBCs. Y-RBCs had significantly higher Elmax values, followed by U-RBCs, with O-RBCs having the lowest EImax at days 5 and 14 (P ≤ .01; Figure 6A). O-RBCs were found to possess significantly lower EImax across all days of hypothermic storage (P ≤ .001; Figure 6A). The EImax values for TM O-RBC samples were significantly higher than those for SMs on day 28 (P ≤ .05; Figure 6D). Sex-based stratification of the EImax data sets revealed that RBC elongation across the biological age subpopulations was independent of donor sex; however, by day 28 and 42 of hypothermic storage, age stratification showed O-RBCs from senior donors to have significantly lower EImax measurements than teenage donors (P ≤ .05; supplemental Figure 4).
Effect of age and sex stratification on the EImax of biological age–profiled RCCs. (A) EImax measurements for the 3 populations of RBCs (U-RBCs, Y-RBCs, and O-RBCs) examined without any stratification based on donor characteristics. (B-D) EImax conveyed as age and sex stratified for U-RBCs (B), Y-RBCs (C), and O-RBCs (D). Multiple comparisons tests were used to show significant differences (∗∗∗∗P < .0001; ∗∗∗P < .001; ∗∗P < .01; ∗P < .05). Median and IQR are indicated as horizontal lines on the violin plots.
Effect of age and sex stratification on the EImax of biological age–profiled RCCs. (A) EImax measurements for the 3 populations of RBCs (U-RBCs, Y-RBCs, and O-RBCs) examined without any stratification based on donor characteristics. (B-D) EImax conveyed as age and sex stratified for U-RBCs (B), Y-RBCs (C), and O-RBCs (D). Multiple comparisons tests were used to show significant differences (∗∗∗∗P < .0001; ∗∗∗P < .001; ∗∗P < .01; ∗P < .05). Median and IQR are indicated as horizontal lines on the violin plots.
Donor age stands out as the primary factor influencing the rigidity of RBCs
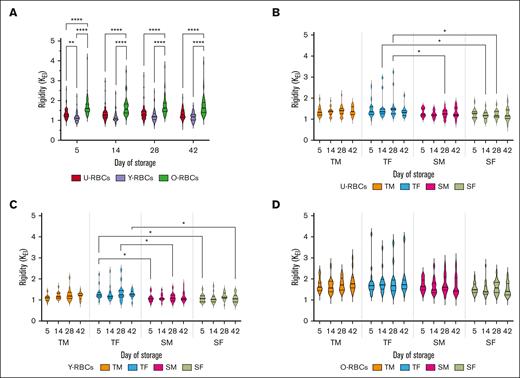
Significantly higher rigidity values were observed for O-RBCs, whereas Y-RBCs demonstrated the lowest rigidity across hypothermic storage (P ≤ .0001; Figure 7A). The KEI of both U- and Y-RBCs derived from TF donors was higher than those from senior groups (SMs and SFs) throughout storage (P ≤ .05; Figure 7B-C). Interestingly, when stratified by both donor age and sex, no significant differences in KEI were found between the various donor groups within the O-RBC subpopulation (Figure 7D). Although no significant increases in rigidity were seen upon sex stratification of this ektacytometry parameter, at various times during cold storage after day 14, RBCs from teenage donors were more rigid than RBCs from senior donors, regardless of their biological age (P ≤ .05; supplemental Figure 5).
Effect of age and sex stratification on the rigidity (KEI) of biological age–profiled RCCs. (A) KEI measurements for the 3 populations of RBCs (U-RBCs, Y-RBCs, and O-RBCs) examined without any stratification based on donor characteristics. (B-D) KEI conveyed as age and sex stratified for U-RBCs (B), Y-RBCs (C), and O-RBCs (D). Multiple comparisons tests were used to show significant differences (∗∗∗∗P < .0001; ∗∗∗P < .001; ∗∗P < .01; ∗P < .05). Median and IQR are indicated as horizontal lines on the violin plots.
Effect of age and sex stratification on the rigidity (KEI) of biological age–profiled RCCs. (A) KEI measurements for the 3 populations of RBCs (U-RBCs, Y-RBCs, and O-RBCs) examined without any stratification based on donor characteristics. (B-D) KEI conveyed as age and sex stratified for U-RBCs (B), Y-RBCs (C), and O-RBCs (D). Multiple comparisons tests were used to show significant differences (∗∗∗∗P < .0001; ∗∗∗P < .001; ∗∗P < .01; ∗P < .05). Median and IQR are indicated as horizontal lines on the violin plots.
Discussion
This study revealed the effects of donor factors and RBC biological age on several parameters associated with RBC deformability. Using our previously reported methodology of biological age profiling through Percoll density-based separation, we examined the rheological properties of Y-RBC and O-RBC subpopulations from female and male RCCs at both ends of the donor age spectrum.82 The heterogeneity within RCCs, particularly the higher proportion of poor quality, biologically older RBCs that exist in RCCs from TMs, are shown again here through ektacytometry measurements of RBCs. Understanding this heterogeneity helps highlight the importance of considering the role that donor factors play in “what’s in the bag,” and in reconciling the discordant clinical results that have been reported on the role that storage age plays in adverse transfusion outcomes.
Although a 2021 study by van Cromvoirt et al suggested that donor age rather than donor sex affects the Ohyper parameter, Cloutier et al in a multicenter BEST collaborative study, showed significant differences not only between teenage and senior age groups but male and female donors as well.62,86 Unique to our study is that the observed reduced deformability of TM RBCs under hypertonic stress was mostly in comparison with SF donors and regardless of RBC biological age. Female donors possessing higher Ohyper measurements than males, is in line with prior research in which higher estradiol levels have been shown to influence the mechanical properties of RBCs.87-89 The activation of nitric oxide production by estradiol in RBCs may enhance antioxidant capacity, positively affecting RBC deformability.1,61 Our results demonstrated that U-, Y-, and O-RBCs from SF donors tended to have higher Ohyper values than those from teenagers. This, taken with the fact that estradiol levels typically decrease with age in postmenopausal women, suggests that improved deformability is attributable to other donor factors such as lifestyle (diet, alcohol consumption, and/or smoking), which was not captured within this study.90 Further research is needed to fully understand the exact mechanisms underlying these observations.
Interestingly, senior donor measures of MCHC exhibited a higher propensity to be moderately to strongly correlated with Ohyper, another biomarker of RBC quality. Rather than the sustained positive correlation between MCHC and estimated median density as reported by Mykhailova et al, our work revealed that throughout hypothermic storage there exists a consistent negative correlation between MCHC and Ohyper.82 The negative correlation between Ohyper and MCHC became weaker over the storage period, particularly in TF donors, which might be explained by the progression of hemolysis and RBC membrane changes. Again, donor-specific medical factors and lifestyle could also have contributed to the variability observed in RBC indices, thereby influencing the strength of the relationship between quality parameters across different groups and time points.90 Mohandas et al previously found that higher MCHC levels are linked to decreased RBC deformability.15 Loss of intracellular water during RBC aging because of the progressive failure of the cellular homeostasis system, leads to a simultaneous increase in the cytoplasmic viscosity together with decreased RBC membrane elasticity.16-18,45,46,91 As long as the goal of personalized transfusion medicine exists, continued development of predictive signatures for donor-specific RBC characteristics will also persist, and rheological assessments such as Ohyper, could be added to a growing list of potential candidates currently comprising such parameters as osmotic fragility and estimated median density.82,92 As the utility of measuring deformability across heterogenous donor products has been growing over the past several years, adaptation of both bulk-flow and single-cell techniques is required to make its successful translation into the clinic a possibility.93 Future quality assessment studies will need to consider additional donor factors such as genetics in larger cohorts of both fresh and stored RCCs to truly assess whether Ohyper measurements in senior donors are reproducible enough to be a reliable biomarker for both optimal donor selection and ensuring that transfusion products continue to meet higher standards.
The discrepancies between our significant EImax findings under isotonicity and the insignificant differences reported by Cloutier et al, wherein stored teenage and senior RBCs were also tested by ektacytometry, can be explained by sample heterogeneity in the form of RBC subpopulations not being previously considered.86 Initially, donor age did not appear to influence EImax, however, O-RBCs from senior donors demonstrated decreased elongation compared with samples from teenage donor units later in storage. The reduced deformability of O-RBCs in senior donors may stem from typical age-related factors such as anemia that develop because of nutritional deficiency or chronic disease. Aging also leads to increased levels of dimethyl arginine, malondialdehyde, and cholesterol in the bloodstream, which, at elevated concentrations, have been shown to compromise membrane integrity, thereby impairing RBC deformability.94
We also expanded upon our past in vitro investigations, which reported that Y-RBCs exhibit lower rigidity, whereas O-RBCs were more susceptible to destruction under a relatively low amount of shear stress.47,48 O-RBCs consistently exhibited higher rigidity than U- and Y-RBCs, indicating reduced flexibility with advanced RBC biological age. Biological aging in RBCs has been correlated to reduced sialic acid content on the cell membrane of RBCs therefore leading to decreased electronegative surface charge.95 This loss of surface charge has been proposed to increase membrane rigidity, as evidenced by the reduced electrophoretic mobility of O-RBCs.96 Additionally, donor age was found as the primary factor influencing RBC rigidity, with rigidity measurements decreasing with donor age across all RBC subpopulations. The observed donor age-dependent decrease in RBC membrane rigidity may be attributed to the shorter average life span of circulating RBCs in senior donors, and that blood from older donors and premenopausal females tend to perform better metabolically and exhibits less hemolysis.97
This study had a few notable limitations, with the first being that no middle-aged donors were included in our study cohort. This ultimately limits our ability to apply the findings presented here to adults not falling at the extremes of donor age. Additionally, our inclusion of senior donors, especially women aged >50 years (the average postmenopausal age), may have overlooked important biological variations, such as those related to energy metabolism.97 Secondly, by using a Percoll density-based separation approach to biologically age profile RCCs, it subjects the resulting RBC subpopulations to extensive washes in isotonic phosphate-buffered saline (PBS). It is well-established that RBCs in PBS undergo morphological transformations to a more spherical appearance, in other words, the shape of PBS-exposed RBCs resembles that of naturally occurring O-RBCs.98 Previously, our group, while studying other aspects RBC quality on Y- and O-RBCs, could not rule out the effects of PBS washing on stress-induced hemolysis measurements.81 Similarly, because all RBC subpopulations were washed in PBS for this study, some of the negligible effects of biological age on deformability could potentially be a result of Y-RBCs undergoing morphological alterations resembling premature biological aging.
In conclusion, we have demonstrated the significant influence of donor age, donor sex, and the age distribution of RBCs on deformability parameters. Blood products from TMs, with their higher proportion of biologically older RBCs, demonstrated lower deformability. Our work provides further support for the conclusions of Roussel et al and Tuo et al regarding impaired transfusion recovery of stored RBCs, and demonstrates that the clearance rates of the smaller, more storage-prone O-RBCs in circulation will also be dependent on the rheological heterogeneity of the RBCs within donor blood products.10,55 In the future, metabolomic determination of the biological age of individual RBC subpopulations using known donor-dependent metabolites such as kynurenine,99 may be used to develop potential therapeutic interventions that improve overall RBC transfusion efficacy.
Acknowledgments
The authors are grateful to Canadian Blood Services’ blood donors who made this research possible. The authors acknowledge Kiarra Durand and April Xu for their assistance with data acquisition.
This work received funding support from Canadian Blood Services (grant/award number, IG2018-JA), which is funded by the Canadian federal government (Health Canada) and the provincial and territorial ministries of health. O.M. was supported by a postdoctoral fellowship from Canadian Blood Services.
The views herein do not necessarily reflect the views of the federal, provincial, or territorial governments of Canada.
Authorship
Contribution: O.M. was responsible for study design, data collection, data analysis, and data interpretation, in addition to drafting and reviewing the manuscript; M.B.-C. was involved with data analysis and data interpretation, in addition to manuscript writing and reviewing; S.H. contributed to both the data collection and manuscript writing processes; M.Y. was involved in the data interpretation and manuscript writing processes; C.O. assisted with study design, data collection, and manuscript reviewing; Q.-L.Y. was involved with the analysis and interpretation of the data collected in this study; and T.K. and J.P.A. were integral in study design, data interpretation, and manuscript reviewing.
Conflict-of-interest disclosure: The authors declare no competing financial interests.
Correspondence: Jason P. Acker, Innovation and Portfolio Management, Canadian Blood Services, 8249-114 St, Edmonton, AB, Canada; T6G 2R8; email: jason.acker@blood.ca.
References
Author notes
Data are available on request from the corresponding author, Jason P. Acker (jason.acker@blood.ca).
The full-text version of this article contains a data supplement.

