Key Points
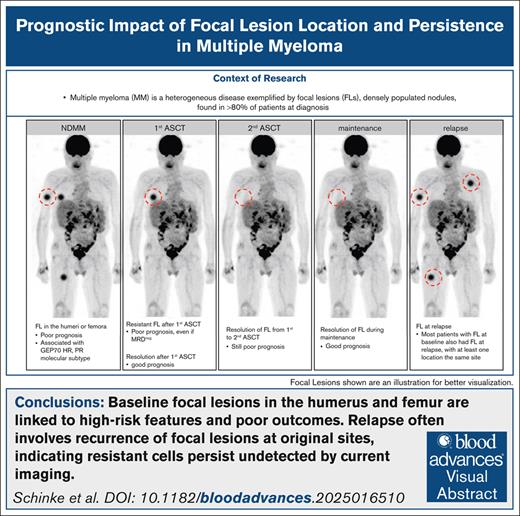
Baseline FLs in the humerus and femur are linked to high-risk features and poor outcomes.
Relapse often involves recurrence of FLs at original sites, indicating resistant cells persist undetected by current imaging.
Visual Abstract
Multiple myeloma (MM) is a heterogeneous disease exemplified by focal lesions (FLs), densely populated nodules whose number and persistence during treatment predict poor outcome. However, the prognostic role of FL location and the relationship between FLs at different time points remain underexplored, although they may provide critical clues to disease evolution and resistance mechanisms. We analyzed positron emission tomography (PET) and diffusion-weighted magnetic resonance imaging (DWI) scans from 243 patients with MM enrolled in total therapies at baseline, after autologous stem cell transplant (ASCT), and every 6 to 12 months thereafter until relapse or last follow-up. Baseline FLs in the humerus or femur were associated with poor prognosis. Although rare, residual PET-positive FLs after ASCT identified patients with worse outcomes. One-third of patients had residual FLs on DWI after ASCT, which also correlated with poor prognosis. Even FLs that resolved after the second ASCT in patients who underwent tandem ASCTs retained adverse prognostic significance, highlighting the limitations of late imaging in high-risk patients. Patients who achieved both minimal residual disease (MRD) and imaging negativity after ASCT had the best outcomes. Conversely, MRD-negative patients with FLs had as poor outcomes as double-positive patients. Residual FLs persisting to relapse were predominantly observed in early relapse cases, and resolved FLs frequently recurred at the same or nearby sites, suggesting limited imaging sensitivity for detection of focal resistant cells. Taken together, this study identifies long bone FLs as a risk factor, and underscores the value of serial imaging and the urgent need for alternative treatment strategies for patients with persistent FLs.
Introduction
Multiple myeloma (MM) is a malignancy of terminally differentiated plasma cells (PCs), and is the most common bone marrow (BM) cancer.1 Despite significant therapeutic improvements and prolonged progression-free survival (PFS), the disease remains largely incurable, with relapse ultimately leading to patient death.2 One of the major obstacles to curing MM is the subclonal heterogeneity, which provides the fuel for drug resistance and treatment failure.3 Subclones are often unevenly distributed in the BM, best reflected by the formation of densely populated nodules, also called focal lesions (FLs), which typically harbor MM cells with unique mutational profiles that eventually lead to disease relapse.4-6 The prognostic value of FLs has been investigated in several studies, demonstrating that the number and size of these nodules as well as their presence in patients who achieve complete remission or after autologous stem cell transplant (ASCT) are associated with poor outcome.7-11 However, little has been described about the prognostic role of the location of FLs, and the relationship between FLs at different time points. Sites with the highest BM content, such as the spine and pelvis, have historically been shown to harbor a high percentage of FLs, and many imaging studies have therefore focused on this area without considering bones of the appendicular skeleton, such as the humerus and femur.12,13 Consequently, the location and dynamics of FLs during treatment and the impact of these variables on outcome remain poorly characterized, although they may provide critical clues to disease evolution and resistance mechanisms. The functional imaging technique 18F-fluorodeoxyglucose (FDG) positron emission tomography (PET) is increasingly used to detect FLs in MM, as it visualizes not only anatomical and morphological features, but also captures the metabolic activity of tumor cells.14-16 However, its reliance on tumor metabolism presents a major limitation, and false-negative findings occur in up to 20% of patients.16,17 As a metabolism-independent approach, diffusion-weighted magnetic resonance imaging (DWI) has emerged as a powerful alternative.18,19 Recent studies suggest that DWI may even outperform FDG/PET in sensitivity. Nevertheless, DWI has its own limitations, particularly in detecting extramedullary disease and rib lesions.15 To address the limitations of both techniques, we combined them to achieve a more comprehensive assessment of FL dynamics, anatomical location, and their prognostic impact. We analyzed a cohort of 243 patients who received total therapy (TT), and who were enrolled between 2010 and 2015, to ensure adequate follow-up. Images were acquired at baseline and at multiple time points during the course of treatment until patients eventually relapsed or to latest follow-up. We show that FLs in the long bones such as the humerus or femur at baseline carry significantly worse prognosis compared with FLs in the axial skeleton. Persistence of FLs after ASCT is an independent marker for adverse outcome, even in patients who are minimal residual disease (MRD) negative. By combining imaging with molecular tumor data, we demonstrate that FLs in the long bones and persistent PET-positive FLs are associated with high-risk disease. In conclusion, the study emphasizes the power of combining functional imaging with other diagnostic and prognostic tools to address the negative impact of spatial tumor heterogeneity in MM.
Methods
Patients
A total of 243 patients that were enrolled into the prospective TT protocols: TT4 (n = 142), TT5 (n = 38), or TT6 (n = 63), from 2010 to 2015, and who had a PET and DWI available at diagnosis and after ASCT were included. Of 152 patients that relapsed, 132 patients also had PET and/or DWI available at relapse. The TT protocols have been described in detail previously.20-22 Briefly, they include 2 induction cycles with VDT-PACE (bortezomib, dexamethasone, thalidomide–cisplatin, adriamycin, cyclophosphamide, and etoposide), followed by tandem melphalan-based ASCT, and maintenance with a proteasome inhibitor, immunomodulatory drug and dexamethasone. Median follow-up time was 9.91 years. The study was performed under University of Arkansas for Medical Sciences Institutional Review Board approval (number 205415), and all patients signed written consent in accordance with the Declaration of Helsinki.
Functional imaging
The DWI examinations were performed on a 1.5-Tesla Philips Achieva scanner (Phillips, Koninklijke, The Netherlands) as previously described.15 In brief, the protocol included scanning from vertex to toes in 7 to 9 slabs depending on patient height. Each slab constituted 50 slices, 5 mm thick, field of view 450 mm, matrix 112 × 79, repetition time 7500 milliseconds, time to echo 69.9 milliseconds, number of acquisitions 2, with a “Q” body coil, b = 0, and 800 s/mm2. A coronal whole body T1 turbo spin echo image was obtained as a localizer. Total imaging time for the study was ∼26 minutes, of which 5 minutes was spent for T1 image acquisition. Focal intraosseous intensities with a diameter of at least 0.5 cm and a low signal on the inverted image compared with the surrounding background were visually inspected on the corresponding inverted gray-scale macrophage inflammatory protein exponential apparent diffusion coefficient map and corresponding source images to classify lesions as restricting (low apparent diffusion coefficient compared with the surrounding background) and nonrestricting. Only restricting lesions were considered after ASCT. PET was performed on a Biograph, Reveal, or Discovery scanner as previously described.17 For PET, a FL was defined as a circumscribed focus with increased FDG uptake compared with its surroundings.8,17 Because of potential reactive changes in the BM during treatment, we did not consider increased diffuse background signals as indicators of residual disease.
MRD diagnostics
For the flow-cytometric assessment of MRD, at least 2.5 × 10⁶ cells from BM samples were immunophenotyped on a FACSCanto II flow cytometer using an 8-color technique as previously described (CD138 [V-500], CD38 [fluorescein isothiocyanate], CD19 [phycoerythrin-Cyanine7], CD45 [V-450], CD27 [peridinin-chlorophyll-protein-Cyanine5.5], CD81 [allophycocyanin-H-7], CD56 [allophycocyanin], and CD20 [phycoerythrin]).23 The cut-off for defining a population of phenotypically aberrant clonal PCs was set at ≥20 events. The sensitivity for MRD negativity in this study was 1 × 10⁻⁵.
Risk stratification by GEP and R-ISS
CD138-enrichment of PCs was performed as published.24,25 Gene expression profiling (GEP) of CD138-enriched PCs using Affymetrix U133 2.0 plus arrays (Affymetrix, Santa Clara, CA), and GEP70-based risk designation and determination of the Revised International Staging System (R-ISS) were performed as described.26,27
Statistics
We used the Kaplan-Meier method for survival analyses. PFS and overall survival (OS) time were measured from baseline or after first ASCT to relapse or death from any cause or censored at the date of last contact. The locations of FLs and residual FLs after ASCT were tested in multivariate Cox regression models, including the established risk factors GEP70 and R-ISS.26,27 Fisher exact test was used to compare the distribution of discrete variables across groups. Main analyses were undertaken using R (version 4.3.2) software.
Results
FLs in long bones at baseline are associated with poor outcome
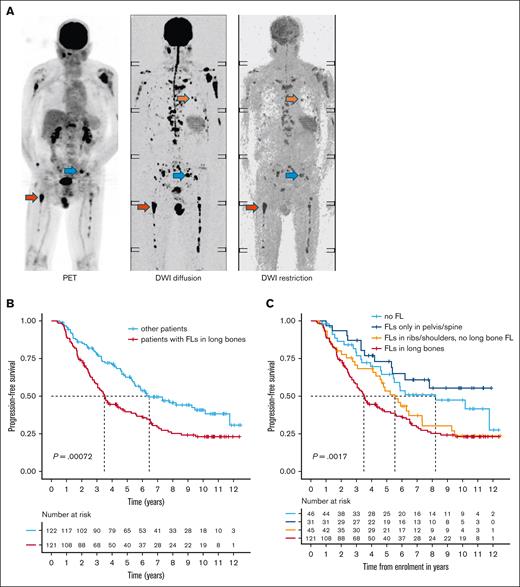
A total of 243 patients were included in the analysis, with a median follow-up of 9.91 years (interquartile range, 6.79-10.80). Detailed patient characteristics are shown in Table 1. At baseline, FLs were seen in 197 (81%) patients (Figure 1A). Of these, 146 (74%) had FLs detected by both imaging modalities, whereas 37 (19%) and 14 (7%) were positive for FLs only by DWI and PET, respectively, supporting the complementary value of combining both techniques. We then examined the anatomical distribution of FLs, categorizing them into 3 major regions: (1) spine and pelvis, (2) ribs and shoulders, and (3) humeri and femora. Using combined PET and DWI data, FLs in the spine and/or pelvis were present in the vast majority (n = 181/197 [92%]) of patients with FLs. FLs in the ribs and shoulders were detected in 140 of 197 patients (71%), whereas 121 of 197 patients (61%) had lesions in the humeri and/or femora. Very few patients had FLs exclusively in the ribs/shoulders (n = 7 [3.5%]) or humeri/femora (n = 8, 4%), indicating that multifocal involvement is common at diagnosis.
Patient characteristics
| Characteristic (N = 243 patients) . | Value . |
|---|---|
| Median age (range), y | 61 (34-76) |
| Gender, male, n (%) | 146 (60) |
| Race, n (%) | |
| White | 199 (82) |
| Black | 42 (17) |
| Asian/other | 3 (1) |
| R-ISS (n = 237), n (%) | |
| I | 52 (21) |
| II | 164 (69) |
| III | 21 (9) |
| Protocol enrollment, n (%) | |
| TT4 | 142 (58) |
| TT5 | 38 (16) |
| TT6 | 63 (26) |
| GEP70 high risk, n (%) | 35 (14) |
| EMD, n (%) | 12 (5) |
| Translocation t(4;14), n (%) | 28/243 (12) |
| Translocation t(14;16), n (%) | 13/243 (5) |
| Translocation t(11;14), n (%) | 55/243 (23) |
| Gain(1q), n (%) | 84/218 (39) |
| With concomitant other high-risk alteration∗ | 45/84 (54) |
| Amp(1q), n (%) | 33/218 (15) |
| With concomitant other high-risk alteration∗ | 20/33 (60) |
| Del(1p), n (%) | 45/218 (21) |
| Del(17p), n (%) | 29/231 (13) |
| Median follow-up time (IQR), y | 9.9 (6.79-10.80) |
EMD, extramedullary disease; IQR, interquartile range.
In combination with translocation t14;14, t14;16, del 1p, or del 17p.
The prognostic role of FL location. (A) Simultaneous PET and DWI scans for a patient newly diagnosed with MM are shown. Examples of FLs in the pelvis, rib, and femur are indicated by blue, orange, and red arrows, respectively. (B) PFS for patients with FLs in the long bones (femur or humerus) detected by DWI or PET at baseline, compared with all other patients. (C) Stratification of the other patients into those without FLs, those with FLs in the pelvis or spine only, and those with FLs in the ribs or shoulders. Group comparisons were performed using the log-rank test.
The prognostic role of FL location. (A) Simultaneous PET and DWI scans for a patient newly diagnosed with MM are shown. Examples of FLs in the pelvis, rib, and femur are indicated by blue, orange, and red arrows, respectively. (B) PFS for patients with FLs in the long bones (femur or humerus) detected by DWI or PET at baseline, compared with all other patients. (C) Stratification of the other patients into those without FLs, those with FLs in the pelvis or spine only, and those with FLs in the ribs or shoulders. Group comparisons were performed using the log-rank test.
Notably, patients with FLs in the long bones (humeri/femora) were enriched for the proliferation (PR) molecular subgroup (P = .008), and GEP70 high-risk (P = .03). In line with this finding, FLs in the long bones at baseline were associated with poor PFS (hazard ratio, 1.74; 95% confidence interval [CI], 1.26-2.40; P = .0008; Figure 1B-C), and OS (hazard ratio, 1.80; 95% CI, 1.23-2.65; P = .01; supplemental Figure 1). Interestingly, patients with FLs confined to spine and pelvis had a similar prognosis to those without FLs at baseline, suggesting that the location of FLs plays a critical role in prognosis.10,28 In a multivariate analysis including FLs in long bones alongside established risk markers (GEP70 and R-ISS), there were trends toward shorter PFS (P = .07) and OS (P = .1) in patients with FLs in the long bones (supplemental Table 1). Taken together, our data suggest that the presence of FLs in the long bones at MM diagnosis is a feature of aggressive disease.
Residual lesions after ASCT are indicative of primary resistant disease and are associated with poor outcomes
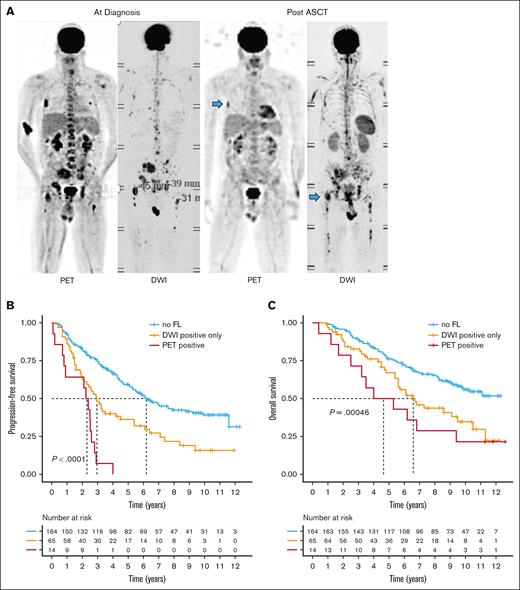
Subsequently, we assessed the prevalence and prognostic impact of FLs after ASCT. The proportion of patients with detectable FLs decreased to 33% (79/243). Notably, the most of these patients exhibited positive results on DWI only (65/79; supplemental Figure 2). Only 14 (18%) of them had PET-positive FLs, with 8 of them being PET/DWI double positive. In line with recent studies, residual FLs negatively impacted outcome.7,10,28 The worst outcome after ASCT was observed in patients with residual PET-positive FLs, with a median PFS of only 2.33 years (95% CI, 0.90-2.92; Figure 2). These patients showed a significant enrichment of the PR molecular subgroup (P = .01), del(17p) (P = .006), and an elevated risk according to the R-ISS (P < .001), suggesting a link between adverse risk characteristics at baseline and the persistence of PET-positive lesions.
Impact of residual FLs on outcome. (A) Example PET and DWI scans for a patient with MM at baseline and after ASCT. Treatment-resistant (residual) FLs are highlighted with blue arrows. Prognostic significance of residual FLs after ASCT detected by DWI alone or PET on (B) progression-free and (C) overall survival. Group comparisons were performed using the log-rank test.
Impact of residual FLs on outcome. (A) Example PET and DWI scans for a patient with MM at baseline and after ASCT. Treatment-resistant (residual) FLs are highlighted with blue arrows. Prognostic significance of residual FLs after ASCT detected by DWI alone or PET on (B) progression-free and (C) overall survival. Group comparisons were performed using the log-rank test.
The median PFS following ASCT for patients with residual FLs observed exclusively on DWI was 2.94 years (95% CI, 2.30-5.40), which was markedly inferior to that of patients with no residual lesions (median PFS = 6.20 years [95% CI, 5.25-9.20]). However, in contrast to patients with PET-positive lesions, no association was observed between high-risk features at baseline and residual DWI-positive FLs. We then conducted a multivariate analysis, integrating PET and DWI data for residual FLs following ASCT, along with FL location, and the GEP70 and R-ISS. This model demonstrated that residual FLs independently influenced outcome regardless of their location (supplemental Table 2).
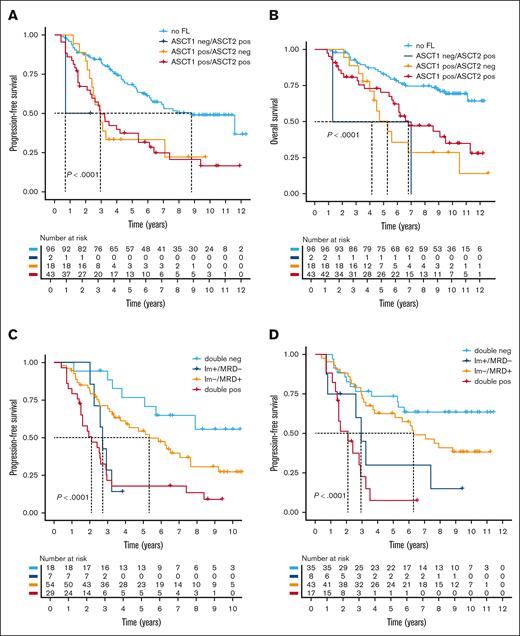
We then investigated the impact of tandem ASCT on residual FLs. In the initial analysis, we included the first image that was available after ASCT (supplemental Table 3). However, for 159 of 181 patients who underwent tandem ASCT, imaging data were accessible following both ASCTs. We again combined PET and DWI data to define a FL-positive group, and found residual FLs after the first ASCT in 61 of 159 patients (38%). After the second ASCT, 18 of these patients (30%) were negative by functional imaging. Intriguingly, these 18 patients had similar PFS and OS compared with patients who were positive at both time points (Figure 3A-B). Only 2 patients demonstrated new FLs after the second ASCT, heralding an early relapse.
Impact of residual lesions in patients undergoing tandem ASCT. For 150 patients who underwent tandem ASCT, combined imaging data (PET and DWI) were analyzed after the first and second ASCTs. Patients were stratified based on the presence or absence of FLs at these 2 time points. (A) PFS and (B) OS are presented using a landmark analysis starting from the first ASCT. Group comparisons were performed using the log-rank test. (C-D) The prognostic impact of combined MRD and imaging is shown. PFS from the first (C) or second (D) ASCT is shown, with patients stratified by the combination of MRD status determined by flow cytometry, and the presence or absence of residual FLs detected by imaging (PET and DWI combined). The log-rank test was used to calculate P values.
Impact of residual lesions in patients undergoing tandem ASCT. For 150 patients who underwent tandem ASCT, combined imaging data (PET and DWI) were analyzed after the first and second ASCTs. Patients were stratified based on the presence or absence of FLs at these 2 time points. (A) PFS and (B) OS are presented using a landmark analysis starting from the first ASCT. Group comparisons were performed using the log-rank test. (C-D) The prognostic impact of combined MRD and imaging is shown. PFS from the first (C) or second (D) ASCT is shown, with patients stratified by the combination of MRD status determined by flow cytometry, and the presence or absence of residual FLs detected by imaging (PET and DWI combined). The log-rank test was used to calculate P values.
Taken together, residual FLs define a cohort of patients with a poor prognosis. Importantly, residual FLs that resolve after the second ASCT maintain an adverse prognostic impact. This indicates that a substantial proportion of patients at high risk of early relapse might be overlooked by imaging after the second transplant.
Functional imaging and its relationship with MRD assessment
We then integrated functional imaging with MRD assessment by flow cytometry with a sensitivity of 1 × 10⁻⁵ after ASCT. Based on our experience with residual FLs after the first and second ASCTs, we separately analyzed the 2 time points. Combined data were available for 108 and 103 patients after the first and second ASCTs, respectively. After the first ASCT, 25 (23%) patients were MRD-negative. MRD/imaging double-negative patients (n = 18/25 [72%]) had an excellent outcome (median PFS and OS, not reached; Figure 3C; supplemental Figure 3A). Notably, the 7 MRD-negative patients with residual FLs exhibited a markedly inferior PFS (median, 2.72 years [95% CI, 2.25 to not available]), which was comparable to that observed in double-positive patients (median, 2.1 years [95% CI, 1.50-2.92]). Similar results were seen after the second ASCT (Figure 3D; supplemental Figure 3B). The percentage of MRD-negative patients increased to 42% (43/102), of whom 8 (18%) continued to have FLs on imaging. Again, the latter had a PFS (median, 2.94 years [95% CI, 2.61 to not determined]) that was comparable to that observed in double-positive patients (median, 2.1 years [95% CI, 1.50-3.5]).
Taken together, patients who are MRD and imaging negative after ASCT have the best outcome. Although it is a rare event, FLs in patients who are MRD-negative patients after ASCT define a group of patients with an outcome as poor as that seen in double-positive patients.
Persistent, recurrent, and new lesions at relapse
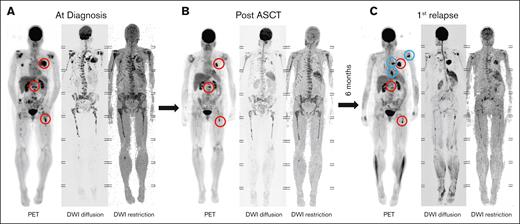
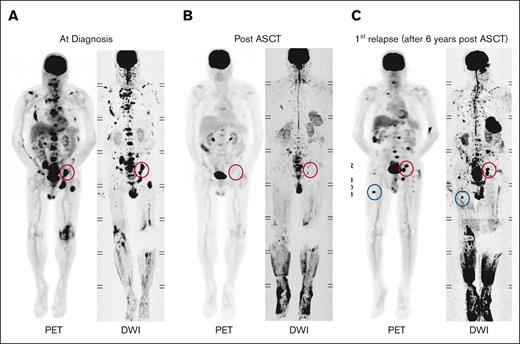
As described above, in ∼1 of 3 of patients, FLs observed after the first ASCT resolved after the second ASCT, indicating that the majority of FLs are eradicated by intensive treatment. To better understand the dynamics of FLs during long-term follow-up, we included imaging data collected during maintenance therapy and relapse. Among 132 patients who relapsed and had imaging data at relapse, 115 had FLs at baseline. Of these, 80 (69%) also had FLs at relapse. In most of these cases (n = 67 [84%]), at least 1FL was located at the same or very close location as at baseline. However, persistent residual lesions, detectable throughout follow-up until relapse, were observed in only 29 patients. The vast majority (n = 25) of these relapsed within 3 years from ASCT, indicating that persistent, treatment-resistant FLs are predominantly seen in early relapse patients (Figure 4). By contrast, 139 of 145 patients, who relapsed >3 years after ASCT or remained in remission at last follow-up, were already negative after the first ASCT (n = 112) or showed resolution of FLs during maintenance (n = 27). Notably, the latter is in contrast to the poor outcome of patients whose FLs resolved between the first and second ASCT (Figure 5).
FL persistence and relapse dynamics. (A) Imaging of a patient with multiple FLs at diagnosis. (B) Persistent PET-positive FLs are observed in the same patient after ASCT. (C) Six months after ASCT, the patient experienced a rapid relapse, characterized by regrowth of residual FLs (red circles) and the emergence of new FLs at other sites (blue circles).
FL persistence and relapse dynamics. (A) Imaging of a patient with multiple FLs at diagnosis. (B) Persistent PET-positive FLs are observed in the same patient after ASCT. (C) Six months after ASCT, the patient experienced a rapid relapse, characterized by regrowth of residual FLs (red circles) and the emergence of new FLs at other sites (blue circles).
Example of FL dynamics. (A) Imaging of a patient showing FLs at diagnosis. (B) FLs resolved following ASCT. (C) At relapse, 6 years after ASCT, FLs reemerged at their original sites (red circles), and new FLs appeared at other locations (blue circles).
Example of FL dynamics. (A) Imaging of a patient showing FLs at diagnosis. (B) FLs resolved following ASCT. (C) At relapse, 6 years after ASCT, FLs reemerged at their original sites (red circles), and new FLs appeared at other locations (blue circles).
New FLs at unrelated sites were detected in 35 patients (44%) with FLs at baseline, and in 6 of 17 patients without detectable FLs at baseline. These findings emphasize the importance of repeat imaging at relapse to reassess both prognosis and fracture risk. Despite the appearance of new FLs, the anatomical distribution of FLs at first relapse mirrored that at baseline. Among 64 patients with both PET and DWI at relapse, FLs were most commonly located in the pelvis/spine (n = 53 [83%]), followed by ribs/shoulders (n = 38 [59%]), and humerus/femur (n = 39 [61%]).
Together, persistent, treatment-resistant FLs are primarily observed in early relapse patients. Importantly, even in patients with relapse FLs at baseline locations, lesions often resolve during treatment, suggesting that resistant subclones may persist at original sites and remain undetectable by imaging for extended periods.
Discussion
This is one of the first and largest studies to investigate the dynamics of FLs using combined serial functional imaging with DWI and PET from diagnosis through to after ASCT to relapse over a follow-up period of almost 10 years. Our results shed light on previously unexplored imaging scenarios, with conclusions that have important clinical implications. First, the long recognized adverse prognostic impact of FLs appears to be significantly driven by FLs in the humerus and femur, because patients with lesions only in the axial skeleton, such as the spine and pelvis, tend to have a similar outcome to patients without FLs. The reasons for this finding are not entirely clear. Although patients with FLs in the long bones are enriched for high-risk disease, which could explain the poor outcome in these patients, multivariate analysis suggested that the peripheral location itself could play a crucial role. Because of the reduced amount of BM in appendicular bones, MM cells proliferating at these sites may be less dependent on the BM microenvironment, which is per se a feature of advanced disease and unfavorable tumor biology.29 This could mean that MM cells in these sites tend to be inherently more advanced, or that the surrounding tumor microenvironment in long bones may be different from that in the axial skeleton and confer increased treatment resistance. No study has systematically investigated the subclonal architecture and cell-cell interactions at these sites. Our results suggest that such analysis would be an important next step to better understand the mechanisms underlying relapse in MM. However, FLs in long bones are often inaccessible or too risky to sample.
Second, from a diagnostic perspective, the observation that the persistence of FLs until relapse was almost exclusively seen in patients who relapsed within 3 years may be highly relevant, as it demonstrates the limited sensitivity of current imaging approaches during treatment intensification and/or maintenance in late-relapsing patients. It also highlights that these sites of active MM can be a major driver of relapse, as previously reported.4,6 Furthermore, this finding is in line with previous observations that resolution over the treatment course is associated with improved outcome compared with significantly worse outcome in patients with persistent FLs.7,30-32 However, there was 1 exception in our study. Depletion of residual FLs by a second ASCT did not appear to improve prognosis. We can only speculate that residual FLs after the first ASCT in such patients are a marker of advanced disease with few highly treatment-resistant tumor cells in these FLs or anywhere in the BM. Consistent with this, we and others have recently shown a close phylogenetic relationship between early relapse subclones and tumor cells within FLs at baseline, and that early relapse may be driven by expansion of single tumor cells.4,33 Therefore, patients with persistent disease after the first ASCT may require alternative treatment approaches.
Finally, it is noteworthy that the majority of patients whose FLs resolve during treatment have new FLs at relapse. Interestingly, at least 1 FL at relapse was located at the same site or in close proximity to the site of a baseline FL, suggesting that resistant MM cells persist at these sites, providing further evidence that resistant MM cells persist below the detection limit of functional imaging. However, it is also likely that primary resistant cells migrate from other sites away from their initial localization.
Despite the strengths of our study, including available PET and DWI data for a large patient pool from prospective TT trials with long follow-up, we recognize the limitations of our work. Most importantly, patients in our study were not treated with upfront CD38-targeting antibodies, as is now widely used.34 However, although CD38 antibody-based quadruple therapies have significantly improved remission and MRD-negativity rates compared with earlier treatment regimens, including those used in our study population, we believe that the concepts proposed in this study still hold true regardless of the therapeutic approach. This is because FLs have been found to be universally enriched in high-risk disease, and contain microenvironmental changes that are thought to confer treatment resistance.35 Consequently, there is some evidence that the presence of FLs on functional imaging is an adverse risk factor for anti-CD38 antibody therapy.36 Further clinical trials using imaging modalities to monitor focal residual disease are needed to determine the impact of currently available novel therapies on the dynamics of FLs in patients with MM.
In conclusion, our data emphasize that although FL assessment at certain time points is prognostically meaningful, the best individualized assessment is likely to be achieved with regular and longitudinal evaluations to best understand the dynamics of resistant disease or to confirm sustained resolution of FLs, which appears to be a prerequisite for long-term disease remission. However, the sensitivity limitations of whole body imaging must be considered when making treatment decisions.
Authorship
Contribution: C.S., L.R., C.A., R.v.H., D.V.A., C.B., J.D.S. Jr, F.Z., and N.W. designed the research and analyzed the data; C.S., S.T., S.A.H., M.Z., B.B., and F.v.R. provided study data; C.S., L.R., and N.W. wrote the manuscript; and all authors approved the final draft of the manuscript.
Conflict-of-interest disclosure: The authors declare no competing financial interests.
Correspondence: Carolina Schinke, University of Arkansas for Medical Sciences, Myeloma Institute, 4301 W Markham St, slot 816, Little Rock, AR 72205; email: cdschinke@uams.edu; and Niels Weinhold, Heidelberg Myeloma Center, Department of Medicine V, Im Neuenheimer Feld 672, 69120 Heidelberg, Germany; email: niels.weinhold@med.uni-heidelberg.de.
References
Author notes
Data are available on request from the corresponding authors, Carolina Schinke (cdschinke@uams.edu) and Niels Weinhold (niels.weinhold@med.uni-heidelberg.de).
The full-text version of this article contains a data supplement.

