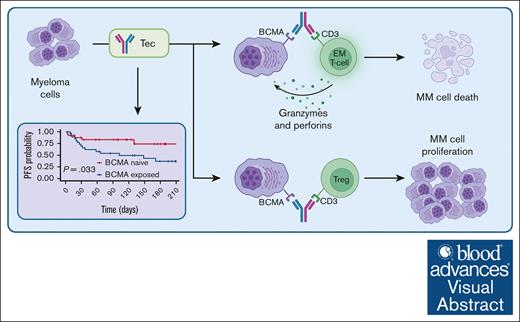
Teclistamab is effective in real-world patients with R/RMM, including those with prior anti-BCMA therapy exposure, albeit with slightly poorer progression-free survival.
Peripheral blood regulatory T cells associate with teclistamab failure, whereas CD8+ effector T cells associate with teclistamab response.
Visual Abstract
Teclistamab, a B-cell maturation antigen (BCMA)- and CD3–targeting bispecific antibody, is an effective novel treatment for relapsed/refractory multiple myeloma (R/RMM), but efficacy in patients exposed to BCMA-directed therapies and mechanisms of resistance have yet to be fully delineated. We conducted a real-world retrospective study of commercial teclistamab, capturing both clinical outcomes and immune correlates of treatment response in a cohort of patients (n = 52) with advanced R/RMM. Teclistamab was highly effective with an overall response rate (ORR) of 64%, including an ORR of 50% for patients with prior anti-BCMA therapy. Pretreatment plasma cell BCMA expression levels had no bearing on response. However, comprehensive pretreatment immune profiling identified that effector CD8+ T-cell populations were associated with response to therapy and a regulatory T-cell population associated with nonresponse, indicating a contribution of immune status in outcomes with potential utility as a biomarker signature to guide patient management.
Introduction
Multiple myeloma (MM) remains an incurable hematologic malignancy,1 but recent advances have drastically improved clinical outcomes. In particular, developments in B-cell maturation antigen (BCMA)–targeted approaches, including T-cell redirecting therapies such as chimeric antigen receptor (CAR) T-cell and bispecific antibody therapies, have shown impressive therapeutic efficacy, including for individuals with multiply relapsed/refractory (R/R) disease.2-6
Teclistamab is a Food and Drug Administration (FDA)–approved bispecific antibody that binds CD3 and BCMA to promote T-cell engagement with BCMA-expressing myeloma cells, leading to T-cell mediated myeloma cell lysis.7 In the MajesTEC-1 study, teclistamab was highly effective in R/RMM, but patients with prior anti-BCMA therapy exposure were excluded from participation.8 Clinical data for teclistamab activity in patients exposed to anti-BCMA therapies are currently lacking. Identifying appropriate therapies for patients who relapse after anti-BCMA treatments is essential to guide the optimal timing and sequencing of anti-BCMA agents.9,10
Resistance mechanisms to bispecific antibodies are incompletely understood. Target tumor antigen loss or alteration has been described in the context of anti-BCMA therapies but are rare.11-13 Because anti-BCMA CAR T-cell and bispecific antibody therapies rely on immune function, the role of immune dysfunction in diminished therapeutic efficacy has been explored and may represent a more common mode of treatment resistance.14,15 Thus, identifying baseline patient–specific immune profiles predictive of treatment response is warranted and would optimize therapy selection in the landscape of expanding anti-BCMA treatment options. The discovery of relevant immune signatures may also reveal new therapeutic T-cell targets to augment bispecific antibody treatment and further improve response rates.
We conducted a retrospective analysis of clinical outcomes in patients treated with commercial teclistamab at our center, many of whom had previously received anti-BCMA therapies. In addition, we performed comprehensive pretreatment immune profiling with high-dimensional spectral cytometry to identify immunophenotypes related to therapeutic response.
Methods
Study cohort and clinical data collection
This study included all patients with R/RMM at Memorial Sloan Kettering Cancer Center (MSKCC) who received standard-of-care commercial teclistamab since its FDA approval on 26 October 2022. A total of 52 patients received treatment between 29 November 2022 and 25 July 2023. Clinical data were retrospectively collected through manual review of the electronic health record with a data cutoff date of 25 July 2023. Eligible patients received at least 1 dose of teclistamab and were monitored until progressive disease (PD) or death. Treatment response was classified according to the International Myeloma Working Group (IMWG) response criteria, and response designation assessment was performed by a consensus of 3 investigators. Because this represents a standard-of-care population, bone marrow biopsies were not required to designate complete response in individuals with no detectable monoclonal protein by serum protein electrophoresis or immunofixation. Teclistamab dosing was as described in the MajesTEC-1 study,8 and cytokine release syndrome (CRS) was diagnosed and managed in accordance with MSKCC institutional guidelines (SI methods A1), which are derived from standard recommendations.16 The primary goal was to determine whether prior anti-BCMA therapy was associated with inferior outcomes with teclistamab. The study was approved by the MSKCC Institutional Review Board (IRB 18-143 and 14-276) and conducted in accordance with the Declaration of Helsinki and the Belmont report.
Peripheral blood collection and storage
Peripheral blood (PB) samples for flow cytometry analysis and plasma soluble BCMA measurements were collected from patients in the clinical outcome cohort who provided consent to an MSKCC Institutional Review Board–approved biospecimen procurement protocol and had PB samples collected before receiving teclistamab. PB mononuclear cells (PBMCs) and plasma were collected and cryopreserved according to institutional practice (supplemental Methods, section A2). The median time between pretreatment PBMC collection and the first dose of teclistamab was 14.5 days.
Bone marrow plasma cell BCMA expression and plasma soluble BCMA measurement
Plasma cell BCMA expression analysis by immunohistochemistry (IHC) was available for patients undergoing pre-teclistamab standard-of-care bone marrow biopsies, which were done at the discretion of the treating clinician and not available in all cases.
Hematoxylin and eosin–stained sections from collected bone marrow biopsy samples were reviewed to identify areas with neoplastic plasma cells. IHC was performed on formalin-fixed, paraffin-embedded tissue blocks using BMCA antibody (D-6; dilution, 1:400; Santa Cruz) and an automated system following the manufacturers’ protocol (Benchmark Ultra, Roche). BMCA staining was scored as 0 (negative), 1+ (weakly positive), 2+ (moderately positive), or 3+ (strongly positive).
PB plasma concentrations of soluble BCMA (sBCMA) was measured via the Simpleplex assay following manufacturers’ instructions (ProteinSimple, San Jose, CA).
Flow cytometry
Cryopreserved PBMCs were thawed and washed before being resuspended in 1× phosphate-buffered saline. The cells were then incubated with Human TruStain FcX Fc receptor blocking solution (BioLegend) and Live/DEAD fixable Blue Dead Cell Stain (Invitrogen), following the manufacturers’ specifications, for 20 minutes at ambient temperature and protected from light. After a wash in flow wash buffer (RPMI 1640, no phenol red, with 4% FBS and 0.01% sodium azide), the cells were incubated with the antibody mix (supplemental Table 2) for 20 minutes at ambient temperature and protected from light in the presence of Brilliant Staining Buffer. The cells were washed and resuspended in 0.5% paraformaldehyde/phosphate-buffered saline and immediately acquired using a Cytek Aurora 5L flow cytometer. The optimal antibody concentrations were determined through titration.
Single-stained controls were created by staining individual aliquots of UltraComp beads (Thermo Fisher Scientific) with each fluorescently labeled antibody. The staining protocol was identical to the cell sample preparation, but without the Brilliant Stain Buffer. A single-stained control for the LIVE/DEAD Blue viability dye was created by incubating cells at 95°C for 30 minutes before staining. The single-stained controls were used for spectral unmixing of the fully stained samples using the SpectroFlo software (Cytek), along with unstained control cells to account for autofluorescence. Fluorescence-minus-one control samples were created for CD197-BUV496 and CD14-Nova B 585 as part of the standard protocol to verify the appropriate unmixing of these fluorochromes.
Flow cytometry data were analyzed using FlowJo Software (version 10.8.2). T cells were isolated by gating for single cells based on light scatter, followed by selection of live cells using the Live/DEAD marker, and further selection for T cells by identifying the CD45+CD3+ fraction (described in supplemental Methods, section A3). The same gating strategy was applied to all samples from the patients in the study.
High-dimensional spectral flow cytometry analysis
T-cell populations were downsampled to 5000-cell populations per patient using the FlowJo DownSample plugin (version 3.3.1). The downsampled T cells from all patients were concatenated, and uniform manifold approximation and projection (UMAP) was performed using the fluorescence intensity values from panel markers. Default settings of 15 nearest neighbors, 0.5 minimum distance, 2 components, and Euclidean distance metric were used for UMAP analysis and implemented via the FlowJo UMAP plugin (version 3.1). Algorithm-assisted clustering was performed using the FlowJo Phenograph plugin (version 2.5) with a K parameter of 30, yielding 24 unique T-cell clusters.17 Fluorescence-minus-one samples were not included in the UMAP or Phenograph analysis. T-cell clusters were classified into T-cell sublineages based on the mean fluorescence intensity values for the markers involved, and clusters were merged if they represented similar T-cell lineages (supplemental Figure 5).18-22 All merged clusters were spatially adjacent on the UMAP plot generated by the analysis. Patient-specific cluster density was used to compare the relative abundances of T-cell populations in each patient stratified by clinical outcome. Outlier analysis was performed on all relative cluster density measurements using the ROUT method, and no outliers were identified. All observations made by comparing relative cluster density were replicated using traditional flow cytometry gating.
Statistical analysis
Survival and progression-free survival (PFS) metrics were assessed by the Kaplan-Meier method. Comparisons between patient populations were made using the Mantel-Cox model. Survival analysis stratified by events occurring after the first dose of teclistamab was performed using landmark analysis. The relative abundance of T-cell populations between clinical outcome groups were compared using individual unpaired 2-sided t tests. All statistical analyses were conducted using R and GraphPad Prism. Given the exploratory nature of this analysis, correction for multiple comparisons was not performed.
Results
Clinical outcomes with commercial teclistamab
A total of 52 patients received commercial teclistamab. Of these, 47 patients (90%) were response evaluable because they met the criteria of at least 1 month elapsed since treatment start date and at least 1 disease monitoring test performed, including serum protein electrophoresis, quantitative light chain measurements, or radiographic/pathologic assessments of disease. Among the 5 patients who were not evaluable, 3 had not completed 1 month of therapy, and 2 lacked disease assessment testing.
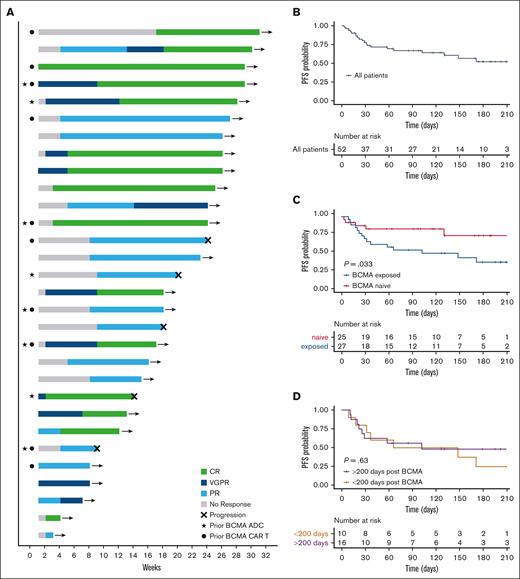
Baseline characteristics of the patients treated with commercial teclistamab were compared with that of the patients in the MajesTEC-1 study (Table 1).8 Our commercial cohort had a higher median age and poorer Eastern Cooperative Oncology Group performance status. The commercial cohort also had a higher percentage of heavily pretreated patients, including more patients who were triple-class exposed and those who were penta-drug refractory. Most notably, 27 of 52 patients (52%) in the commercial cohort had prior exposure to anti-BCMA therapies, including belantamab mafodotin (n = 16 [31%]), anti-BCMA CAR T-cell therapies (n = 19 [37%]), and anti-BCMA bispecific antibodies (n = 2 [4%]). Furthermore, a subgroup of patients (n = 9 [17%]) had exposure to multiple anti-BCMA agents including at least belantamab mafodotin and an anti-BCMA CAR T-cell therapy in all cases (Figure 1A).
Baseline patient characteristics for the MajesTEC-1 and commercial patient cohorts
| . | MajesTEC-1 (n = 165) . | Commercial cohort (n = 52) . |
|---|---|---|
| Median age, y (range) | 64 (33-84) | 70 (39-88) |
| Age >75 y, n (%) | 24 (15) | 15 (29) |
| Median time since diagnosis, y (range) | 6 (0.8-22.7) | 6.3 (0.7-29) |
| ≥1 extramedullary plasmacytoma | 28 (17) | 18 (35) |
| ECOG performance score, n (%) | ||
| 0 | 55 (33) | 8 (15) |
| ≥1 | 110 (67) | 44 (85) |
| High risk cytogenetic profile, n (%) | 38 (26) | 17 (33) |
| Median number of lines of previous therapy (range) | 5 (2-14) | 7 (4-14) |
| Previous autologous stem cell transplantation | 135 (82) | 40 (77) |
| Previous allogeneic stem cell transplantation | Not reported | 3 (6) |
| Therapy refractoriness, n (%) | ||
| Triple-class exposed | 128 (78) | 50 (96) |
| Penta-drug refractory | 50 (30) | 35 (67) |
| BCMA–directed therapy exposure, n (%) | ||
| Any prior anti-BCMA therapy | Excluded | 27 (52) |
| Prior anti-BCMA ADC | Excluded | 16 (31) |
| Prior anti-BCMA CAR T | Excluded | 19 (37) |
| Prior anti-BCMA Bispecific antibody | Excluded | 2 (4) |
| Multiple prior anti-BCMA Tx | Excluded | 9 (17) |
| Prior non-BCMA TCR therapy, n (%) | ||
| Prior CAR T | Not reported | 3 (6) |
| Prior bispecific antibody | Not reported | 5 (10) |
ADC, antibody drug conjugate; ECOG, Eastern Cooperative Oncology Group.
Clinical outcomes with commercial teclistamab. (A) Swimmer plot for patients responding to teclistamab colored by treatment response according to IMWG criteria, with “→” designating ongoing treatment response as of the data cutoff. (B) PFS for all patients treated with commercial teclistamab. (C) PFS with teclistamab stratified by BCMA therapy exposure. (D) PFS for patients exposed to BCMA therapy with >200 days since their most recent anti-BCMA therapy vs <200 days since their most recent anti-BCMA therapy. IMWG, International Myeloma Working Group.
Clinical outcomes with commercial teclistamab. (A) Swimmer plot for patients responding to teclistamab colored by treatment response according to IMWG criteria, with “→” designating ongoing treatment response as of the data cutoff. (B) PFS for all patients treated with commercial teclistamab. (C) PFS with teclistamab stratified by BCMA therapy exposure. (D) PFS for patients exposed to BCMA therapy with >200 days since their most recent anti-BCMA therapy vs <200 days since their most recent anti-BCMA therapy. IMWG, International Myeloma Working Group.
The overall response rate (ORR) to teclistamab for all evaluable patients, defined as a partial response (PR) or better by IMWG criteria, was 64% (30/47), with 38% achieving a very good partial response (VGPR) or better. Among evaluable patients with prior anti-BCMA therapy exposure, the ORR was 50% (13/26). With a median follow-up time of 3.1 months (range, 0.1-7.3 months), median PFS was not reached (NR) for the full cohort (Figure 1B) and the BCMA-naïve subgroup, but it was worse in the anti-BCMA–exposed subgroup (NR vs 3.4 months; P = .033; Figure 1C). Patients with prior-BCMA exposure >200 days before teclistamab treatment had equivalent PFS to those with exposure <200 before teclistamab treatment (Figure 1D; P = .63). PFS was not significantly different among patients exposed to anti-BCMA therapy when stratifying by the type of prior anti-BCMA therapy received (supplemental Figure 2).
Patients with prior anti-BCMA therapy had poorer performance status (89% vs 80%; Eastern Cooperative Oncology Group performance status, ≥1), were more heavily pretreated (median prior lines of therapy, 8 vs 5), and were more often penta-drug refractory (85% vs 68%), possibly contributing to poorer PFS (supplemental Table 3). Among responding patients, 5 of 30 had disease progression as of the data cutoff, with a median duration of response of 4.3 months (range, 2.2-5.6 months). Several patients who achieved a PR or VGPR had ongoing deepening responses with some patients achieving a complete response (CR) after >16 weeks of therapy (Figure 1A).
Pretreatment plasma cell BCMA expression
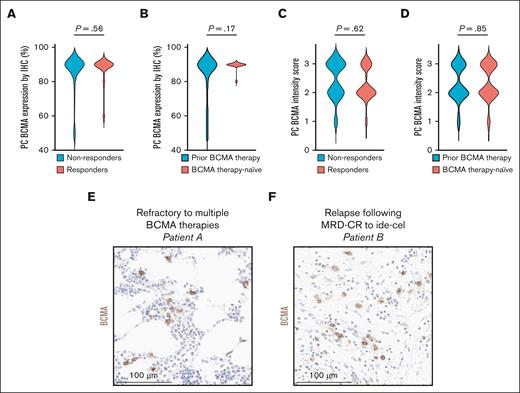
IHC-based BCMA staining of plasma cells from pretreatment bone marrow biopsies were available for 31 of the 47 response-evaluable patients, including 11 of 15 therapy nonresponders. Moreover, 2 patients without IHC results, including 1 responder and 1 nonresponder, had PB plasma sBCMA measured, with sBCMA values of 325 ng/mL and 226 ng/mL, respectively, which is associated with active MM with positive BCMA expression.12,23-26 Among the 14 response-evaluable patients whose plasma-cell BCMA expression could not be assessed by either technique, 11 patients had not had a bone marrow biopsy before initiating therapy, and 3 did not have sufficient disease identified on biopsy for analysis. None of the patients with bone marrow BCMA expression measured had <50% BCMA expression by IHC, and 29 of 31 patients had BCMA expression ≥80% (Figure 2A-B). Only 2 patients had BCMA staining at <2+ intensity (Figure 2C-D). Positive BCMA staining by IHC was observed in patients who were both refractory and strongly responding to prior anti-BCMA therapies (Figure 2E-F).
BCMA-expression profiles of plasma cells. (A-B) BCMA expression measured as a percentage of total plasma cell BCMA expression comparing (A) teclistamab nonresponders and responders and (B) patients with and without prior anti-BCMA exposure. (C-D) Plasma cell BCMA expression measured by BCMA staining intensity by IHC (scale, 0-3) comparing (C) teclistamab nonresponders with responders, and (D) patients with and without prior anti-BCMA exposure. (E-F) Pretreatment bone marrow biopsies showing positive BCMA staining (brown) by IHC for representative patients including (E) a patient refractory to both belantamab mafodotin and idecabtagene-vicleucel but responding to teclistamab, and (F) a patient who achieved MRD-CR after idecabtagene-vicleucel now responding to teclistamab after relapse. CR, complete response; MRD, minimal residual disease.
BCMA-expression profiles of plasma cells. (A-B) BCMA expression measured as a percentage of total plasma cell BCMA expression comparing (A) teclistamab nonresponders and responders and (B) patients with and without prior anti-BCMA exposure. (C-D) Plasma cell BCMA expression measured by BCMA staining intensity by IHC (scale, 0-3) comparing (C) teclistamab nonresponders with responders, and (D) patients with and without prior anti-BCMA exposure. (E-F) Pretreatment bone marrow biopsies showing positive BCMA staining (brown) by IHC for representative patients including (E) a patient refractory to both belantamab mafodotin and idecabtagene-vicleucel but responding to teclistamab, and (F) a patient who achieved MRD-CR after idecabtagene-vicleucel now responding to teclistamab after relapse. CR, complete response; MRD, minimal residual disease.
Treatment safety
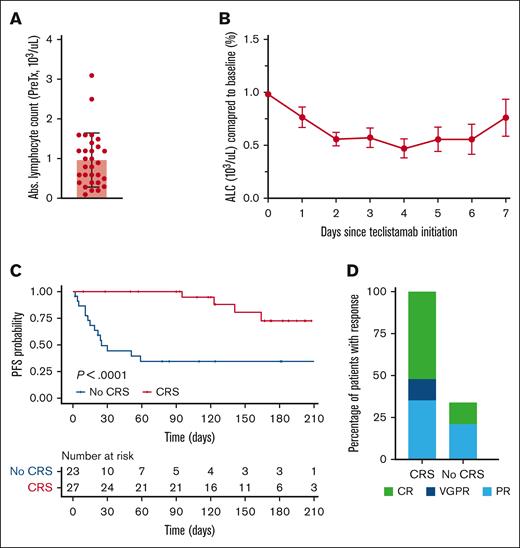
During teclistamab step-up dosing, 27 of 52 patients (52%) developed CRS, with initial symptoms occurring within 7 days of the first dose. Patients without CRS during step-up dosing had significantly reduced PFS compared with those who did (Figure 3C; P < .0001). The absolute lymphocyte count in teclistamab patients typically reached a nadir of ∼50% of pretreatment levels before beginning to rebound toward pretreatment levels ∼7 days after therapy (Figure 3B). This appeared more consistent in therapy responders (supplemental Figure 3). Responding patients included individuals with grade 3 and grade 4 lymphopenia before initiating therapy (Figure 3A), although responding patients had higher lymphocyte counts than nonresponding patients (supplemental Figure 4).
Absolute lymphocyte count trend and cytokine release syndrome incidence associate with teclistamab clinical outcomes. (A) Pretreatment absolute lymphocyte count for patients responding to teclistamab includes several patients with grade 3 or grade 4 lymphopenia. (B) ALC level changes during step-up dosing for teclistamab patients. (C) PFS with teclistamab stratified by patients with and without CRS during step-up dosing. (D) Response rates by IMWG classification for patients with and without CRS during step-up dosing. ALC, absolute lymphocyte count; IMWG, International Myeloma Working Group.
Absolute lymphocyte count trend and cytokine release syndrome incidence associate with teclistamab clinical outcomes. (A) Pretreatment absolute lymphocyte count for patients responding to teclistamab includes several patients with grade 3 or grade 4 lymphopenia. (B) ALC level changes during step-up dosing for teclistamab patients. (C) PFS with teclistamab stratified by patients with and without CRS during step-up dosing. (D) Response rates by IMWG classification for patients with and without CRS during step-up dosing. ALC, absolute lymphocyte count; IMWG, International Myeloma Working Group.
Pretreatment T-cell profiling
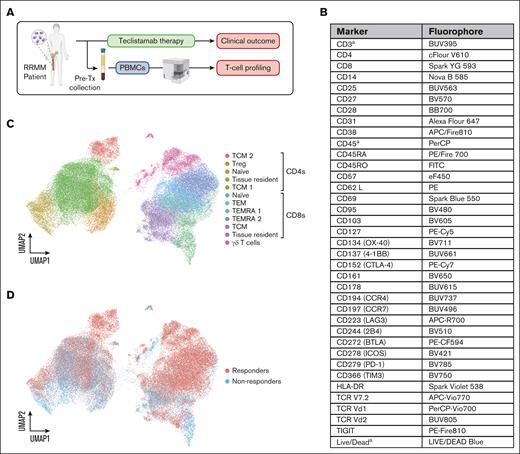
Among the patients included in T-cell profiling assessments (Figure 4), positive BCMA expression was confirmed either by IHC (Figure 2) or plasma sBCMA levels for 5 of 5 teclistamab nonresponders and 7 of 9 teclistamab responders. Among the 2 teclistamab responders without BCMA expression data, bone marrow samples provided insufficient cell quantity for analysis.
High–dimensional spectral cytometry of pretreatment PBMCs. (A) Immune profiling workflow. (B) The spectral cytometry flow panel including subset, lineage, exhaustion markers, and activation markers is shown with (A) designating markers not included in dimensionality reduction analysis. (C) Dimensionality reduction analysis of pretreatment PB T cells identified 12 unique T-cell populations. (D) T-cell populations separated by teclistamab responders and nonresponders.
High–dimensional spectral cytometry of pretreatment PBMCs. (A) Immune profiling workflow. (B) The spectral cytometry flow panel including subset, lineage, exhaustion markers, and activation markers is shown with (A) designating markers not included in dimensionality reduction analysis. (C) Dimensionality reduction analysis of pretreatment PB T cells identified 12 unique T-cell populations. (D) T-cell populations separated by teclistamab responders and nonresponders.
Teclistamab responders had a higher CD8+:CD4+ T-cell ratio than nonresponders (Figure 5A-C; P = .0176). Dimensionality reduction analysis using UMAP and algorithm-assisted clustering with Phenograph identified 12 unique T-cell populations each comprising at least 0.1% of the total T-cell population (Figure 4). Gamma-delta T cells were increased in teclistamab responders, but this was primarily observed in patients who recently received other bispecific antibody therapies and was not seen in all responders. Increases in both CD4+ and CD8+ naïve T cells were observed in the concatenated nonresponder group, but this was skewed by elevated levels for 2 individuals and not a trend for all nonresponders (supplemental Figure 7).
Effector CD8+ T cells are enriched in teclistamab responders. T-cell gating for CD4 and CD8 for (A) teclistamab nonresponders and (B) responders. (C) CD8+:CD4+ T-cell ratios in teclistamab nonresponders vs responders. (D) TEM and (E) TEMRA cell abundance in teclistamab responders vs nonresponders. (F) Feature plots highlighting the differential expression of TIGIT, PD1, CTLA4, LAG3, and TIM3 by TEM and TEMRA CD8+ T-cell subpopulations.
Effector CD8+ T cells are enriched in teclistamab responders. T-cell gating for CD4 and CD8 for (A) teclistamab nonresponders and (B) responders. (C) CD8+:CD4+ T-cell ratios in teclistamab nonresponders vs responders. (D) TEM and (E) TEMRA cell abundance in teclistamab responders vs nonresponders. (F) Feature plots highlighting the differential expression of TIGIT, PD1, CTLA4, LAG3, and TIM3 by TEM and TEMRA CD8+ T-cell subpopulations.
Patients responding to teclistamab had a higher fraction of CD8+CD45RO+CCR7–CD62L– T effector memory cells (6.2-fold increase; P = .0498) and CD8+CD45RA+CCR7–CD62L– effector memory reexpressing CD45RA (TEMRA) cells (6.7-fold increase; P = .0115) in their PB than nonresponders (Figure 5D-E). A subset of TEMRA cells showed elevated T cell immunoreceptor with Ig and ITIM domains (TIGIT) expression but lower expression of other inhibitory/exhaustion markers (Figure 5F).
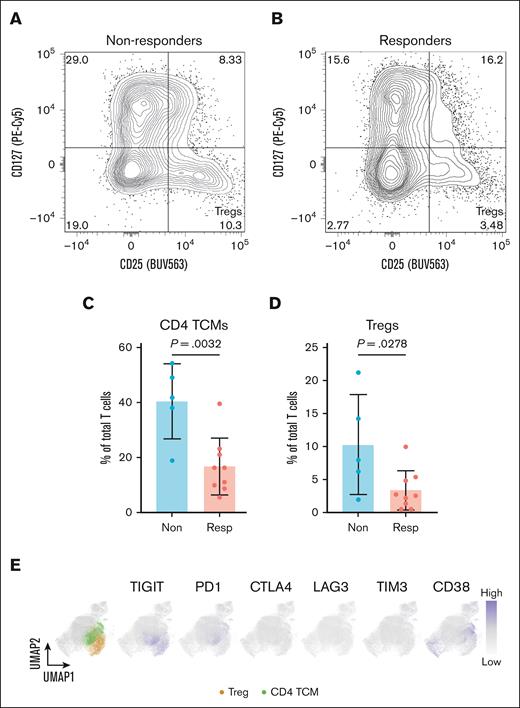
Patients failing to respond to teclistamab had a higher CD4+CD25hiCD127lo regulatory T-cell (Treg) population (threefold increase; P = .0278), with high TIGIT expression, but relatively lower expression of other inhibitory/exhaustion markers (Figure 6A-E). Notably, the Treg population enriched in nonresponders had sparse CD38 expression (Figure 6E).27,28 Furthermore, a higher proportion of CD4+CD45RO+CCR7+ central memory T cells (TCM) were seen in nonresponders (2.4-fold increase; P = .0032), with a subset of TCMs coexpressing elevated levels of both TIGIT and PD-1, suggestive of an exhausted phenotype (Figure 6D).
TIGIT+ Tregs are increased in teclistamab nonresponders. T-cell gating of the CD4+ subpopulation identifies CD25+CD127lo Tregs in (A) teclistamab nonresponders and (B) teclistamab responders. Values shown in panels A and B refer to percentage of total T cells, whereas contour plots refer to percentage of total CD4+ T cells. (C) CD4+ central memory T cells and (D) Treg abundance in teclistamab nonresponders vs responders. (E) Feature plots highlighting the differential expression of TIGIT, PD1, CTLA4, LAG3, TIM3, and CD38 by CD4+ TCM and Treg subpopulations.
TIGIT+ Tregs are increased in teclistamab nonresponders. T-cell gating of the CD4+ subpopulation identifies CD25+CD127lo Tregs in (A) teclistamab nonresponders and (B) teclistamab responders. Values shown in panels A and B refer to percentage of total T cells, whereas contour plots refer to percentage of total CD4+ T cells. (C) CD4+ central memory T cells and (D) Treg abundance in teclistamab nonresponders vs responders. (E) Feature plots highlighting the differential expression of TIGIT, PD1, CTLA4, LAG3, TIM3, and CD38 by CD4+ TCM and Treg subpopulations.
Discussion
Our findings show that teclistamab remains effective in patients with R/RMM who had prior anti-BCMA therapies, which represents a growing patient population with limited effective standard-of-care treatment options.29 Despite our commercial cohort having several risk factors associated with poor outcomes compared with the MajesTEC-1 population (Table 1),30,31 we observed only slightly poorer PFS in patients exposed to BCMA than those naïve to anti-BCMA therapies, with treatment failure potentially linked to baseline patient-specific T-cell phenotypes.
In our study, patients previously treated with either belantamab mafodotin or an anti-BCMA CAR T-cell therapy had slightly poorer outcomes than patients who were naïve to anti-BCMA therapy. The small difference in outcomes between the 2 groups was statistically significant but may be attributed to additional predictors of poor outcome in the BCMA-exposed cohort (supplemental Table 3). The rarity of treatment-related BCMA loss, which has only been reported in individual cases after CAR T-cell therapy11-13 and has not been shown after belantamab mafodotin,32 likely explains the equivalent pretreatment BCMA expression by plasma cells in patients exposed to anti-BCMA compared with those naïve to anti-BCMA. Although our analysis does not include assessments for structural variants in BCMA or point mutations in TNFRSF17, these alterations have only been observed after BCMA–directed bispecific antibody therapy and have yet to be reported in relapse after anti-BCMA CAR T-cell therapy.11-13
Unlike CAR T-cell therapies, bispecific antibodies such as teclistamab activate T cells independently of antigen specificity or MHC:TCR binding to trigger target cell lysis.33-35 The pretherapy endogenous T-cell repertoire is therefore crucial for therapeutic efficacy. In our study, several patients with grade 3 or 4 lymphopenia responded well to teclistamab, suggesting that lymphocyte composition, rather than quantity, is a key parameter of response. Our observation of CRS during step-up dosing with a subsequent development of relative lymphopenia and the relationship to treatment response indicates that immediate immune engagement is critical to therapy success, which is consistent with recent reports.14
The importance of the T-cell composition is further supported by our data that patients with a higher fraction of CD8+ T cells had improved responses to teclistamab. Specifically, the highly cytotoxic CD8+ T effector memory cell and TEMRA populations correlated with therapy response. These cells are likely responsible for the immediate and robust immune response triggered by teclistamab (Figures 3 and 5).36 In contrast, patients who did not respond to teclistamab had increased fractions of Tregs and CD4+ TCMs, which can be similarly engaged by the CD3 binding arm of teclistamab. Tregs expressing TIGIT can inhibit Th1- and Th17-mediated immune responses and if engaged by teclistamab, may hinder efficacy.37 In some teclistamab nonresponders, we also identified a subset of TIGIT+PD-1+ TCMs, which have been associated with immune dysfunction in other hematologic malignancies and chronic viral infections,38,39 and may further contribute to therapy resistance. However, it should be noted that, given the small sample size in this study, this data set is largely exploratory and will require external validation, ideally with prospective data sets, to determine its clinical significance.
TIGIT has emerged as an important T-cell marker in MM, and its blockade has shown potential in enhancing response to cytotoxic chemotherapy in mouse models.40,41 TIGIT is more widely expressed by T cells at MM relapse,42,43 with TIGIT blockade, especially in combination with lenalidomide, enhancing CD8+-mediated myeloma cell killing in mouse models,44 than negative-regulatory markers with FDA-approved targeted therapies such as CTLA4, LAG3, and PD-1, which have shown limited efficacy in MM. Strategies to augment bispecific antibody activity with anti-TIGIT blockade to mitigate the immune-suppressive potential of TIGIT+ Tregs and TIGIT+PD-1+ TCMs merit consideration,45 as well as Treg depletion with anti-CD25 monoclonal antibodies.46
To our knowledge, this is the first report of commercial teclistamab efficacy in patients with R/RMM with previous exposure to BCMA-directed therapies. Critically, we demonstrate encouraging outcomes with teclistamab in patients exposed to anti-BCMA and in those naïve to anti-BCMA. Our findings also highlight the potential utility of assessing the relative quantity of pretreatment cytotoxic effector CD8+ T cells and Tregs as immune biomarkers to predict response and nonresponse, respectively, to bispecific antibody therapy.
Acknowledgments
The authors thank all patients who participated in the study and their caregivers.
This work was supported in part by MSK Cancer Center support grant P30 CA008748 and by funds from the Leukemia and Lymphoma Society and the Wilkes Family Fund.
U.A.S. received grants from National Institutes of Health/National Cancer Institite (NCI) Cancer Center (P30 CA008748), MSK Paul Calabresi Career Development Award for Clinical Oncology (K12CA184746), Paula and Rodger Riney Foundation, Parker Institute for Cancer Immunotherapy at MSK, HealthTree Foundation, International Myeloma Society, American Society of Hematology (ASH), and Allen Foundation Inc. K.H.M. reports grant support from ASH, MMRF and IMS. A.M.L. reports grants from Novartis and Bristol Myers Squibb.
The authors thank Charlotte R. Wayne for her support with figure preparation. Portions of the graphical abstract and Figure 4 were created using BioRender templates.
Authorship
Contribution: R.S.F. and S.Z.U. conceived the project and designed all experiments; R.S.F., E.S., D.P., C.R.T., M.H., S.M., H.H., U.S., N.K., K.M., H.J.L., M.S., G.L.S., O.B.L., S.G., D.J.C., A.M.L., and S.U. collected samples and recruited patients; R.S.F., D.M., and K.K.H. performed and analyzed all spectral cytometric experiments; K.M. and W.G.Q. performed soluble BCMA assays; R.S.F. and M.Z. analyzed immunohistochemistry data; R.S.F. performed all computational and statistical analysis; R.S.F., T.S., I.H., A.W., C.R.T., and S.U. collected clinical data; R.S.F., D.J.C., A.M.L., D.M., K.K.H., K.M., M.Z., and S.U. analyzed the data; R.S.F., D.J.C., A.M.L., and S.U. wrote the manuscript; and all authors reviewed the manuscript.
Conflict-of-interest disclosure: T.S. reports receiving honoraria from Roche-Genentech. M.Z. has received advisory or consulting fees from Leica Biosystems. C.R.T. reports research funding from Janssen and Takeda; personal fees from Physician Educations Resource and MJH Life Sciences; and has participated in advisory boards for Janssen and Sanofi, outside of the submitted work. M.H. reports research funding from GlaxoSmithKline, BeiGene, AbbVie, and Daiichi Sankyo, and has received honoraria for consultancy/participated in the advisory boards for Curio Science LLC, Intellisphere LLC, Bristol Myers Squibb, Janssen and GlaxoSmithKline. S.M. received consulting fees from EviCore, Optum, BioAscend, Janssen Oncology, Bristol Myers Squibb, AbbVie, HMP Education, and Legend Biotech, and honoraria from OncLive, Physician Education Resource, MJH Life Sciences, and Plexus Communications. Memorial Sloan Kettering Cancer Center receives research funding from the NCI, Janssen Oncology, Bristol Myers Squibb, Allogene Therapeutics, Fate Therapeutics, Caribou Therapeutics, and Takeda Oncology for conducting research. U.A.S. reports research support from Celgene/Bristol Myers Squibb and Janssen; personal fees from ACCC, MashUp MD, Janssen Biotech, Sanofi, Bristol Myers Squibb, MJH LifeSciences, Intellisphere, Phillips Gilmore Oncology Communications, i3 health, and RedMedEd; and nonfinancial support from American Society of Hematology Clinical Research Training Institute and TREC Training Workshop (R25CA203650; PI: Melinda Irwin). N.K. reports research funding through Amgen; participates in the advisory board with MedImmune and Janssen; and reports research funding through Amgen, Janssen, Epizyme, and AbbVie; consults for CCO, OncLive, and Intellisphere Remedy Health. H.J.L. has served as a paid consultant for Takeda, Genzyme, Janssen, Karyopharm, Pfizer, Celgene, and Caelum Biosciences, and has received research support from Takeda. M.S. served as a paid consultant for McKinsey & Company, Angiocrine Bioscience, Inc, and Omeros Corporation; received research funding from Angiocrine Bioscience, Inc, Omeros Corporation, and Amgen; served on ad hoc advisory boards for Kite, a Gilead company; and received honoraria from i3 Health, Medscape, and Cancer Network for CME-related activity. G.L.S. reports research funding from Janssen, Amgen, Bristol Myers Squibb, Beyond Spring, and serves on the data safety monitoring board for ArcellX. G.S. reports research funding to the instiution from Janssen, Amgen, Bristol Myers Squibb, BeyondSpring, and GPCR, and serving on a data safety monitoring board for ArcellX. O.B.L. reports serving on the advisory board for MorphoSys. S.G. reports personal fees from and an advisory role (scientific advisory board) for Actinium, Celgene, Bristol Myers Squibb, Sanofi, Amgen, Pfizer, GlaxoSmithKline, Jazz, Janssen, Omeros, Takeda, and Kite, outside the submitted work. D.J.C. receives research funding from Genentech. A.M.L. reports nonfinancial support from Pfizer; grants and personal fees from Janssen, outside the submitted work; and patent US20150037346A1 with royalties paid. S.U. reports grants and personal fees from AbbVie, Amgen, Bristol Myers Squibb, Celgene, GlaxoSmithKline, Janssen, Merck, Mundipharma, OncopeptidesPharmacyclics, Sanofi, Seattle Genetics, SkylineDX, and Takeda. The remaining authors declare no competing financial interests.
Correspondence: Ross S. Firestone, Department of Medicine, Memorial Sloan Kettering Cancer Center, 1275 York Ave, New York, NY 10065; email: firestor@mskcc.org; and Saad Usmani, Myeloma Service, Department of Medicine, Memorial Sloan Kettering Cancer Center, 530 E 74th St, New York, NY 10021; email: usmanis@mskcc.org.
References
Author notes
The full-text version of this article contains a data supplement.
Data available on request from the corresponding authors, Ross S. Firestone (firestor@mskcc.org) and Saad Z. Usmani (usmanis@mskcc.org).

