TO THE EDITOR:
We read with interest the study by Akahoshi et al.1 In this very large study, the authors found an association between cytomegalovirus (CMV) reactivation and reduced relapse rates, although the effect size was small. They also found an increased incidence of the competing event (nonrelapse mortality [NRM]) with CMV reactivation, another important finding but omitted from the title. We believe that the association between CMV reactivation and reduced relapse rates may be spurious and secondary to the method (Fine and Gray subdistribution hazard model) they have chosen. We think they should have confirmed their results with a Cox model (cause–specific hazard model).
According to Austin et al,2 the Fine and Gray subdistribution hazard model is more appropriate for prognostic reasons, while the cause-specific hazard model (Cox model) is more suitable for etiological reasons. Others have concluded that the Fine and Gray subdistribution hazard model is not well suited for etiological/causal questions through simulation study.3 We do believe that Akahoshi et al were pursuing etiological reasons.
Suppose a trial comparing treatment A with placebo, and treatment A increases NRM in the first 3 months (50% vs 25%). Then, after 3 months, there would be 50% left in the treatment A compared with 75% in the placebo group. Now, suppose the risk of relapse in surviving patients, after 3 months, is the same in both arms, say it is 40%. Then, there would be 50% × 40% = 20% relapses in treatment A, compared with 75% × 40% = 30% relapses with placebo. Although the risk of relapse is the same, the cumulative incidence of relapse is numerically and paradoxically lower with treatment A compared with placebo (20% vs 30%). With many patients, this difference may be statistically significant. This small example illustrates how the Gray test and the Fine and Gray method works.
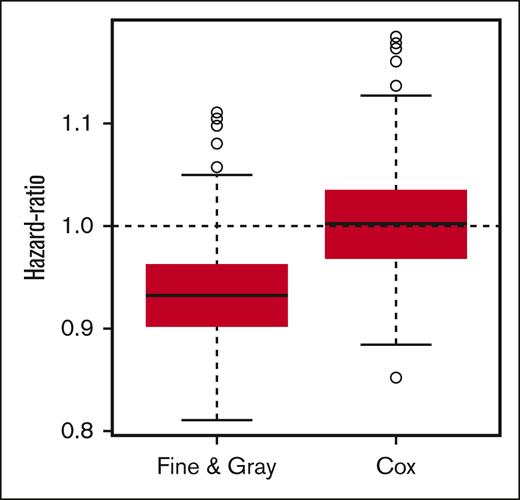
We ran 1000 simulations of a 4000-individual database, with an equal number of CMV-reactivated and nonreactivated patients. Ethics committee's approval does not apply. We simulated the database with an exponential distribution with a hazard of 20% and 10% per year of relapse and nonrelapse mortality, respectively, for the non–CMV reactivated patients, and a hazard ratio (HR) of 1.0 (no effect) for relapse and 1.375 (small increase) for NRM in the CMV-reactivated group. Follow-up times were simulated with a uniform distribution between 3 and 5 years (maximal follow-up). The R code (R: A Language and Environment for Statistical Computing, Vienna, Austria) used for these simulations is provided in the supplemental File, which is the R script. First, we analyzed the association between CMV reactivation and relapse with Cox models. For relapse, 5.2% of the simulations yielded a statistically significant result, which is quite what we would expect from an alpha error (P value) set at 5% when there is no association between the independent (CMV reactivation) and dependent (relapse) variables (just like we simulated). The mean of the simulated HR for relapse with Cox cause-specific models was 1.00, which is numerically the same as we have simulated. Then, we analyzed it through Fine and Gray subdistribution hazard model. Interestingly, using the same databases simulated before, in 36.6% of them we found a protective effect of CMV reactivation on relapse (which is much higher than we would expect from a P value set at 5%). The mean of the simulated HR for relapse with Fine and Gray subdistribution hazard models was 0.93, which is lower than the parameters we used for the simulation and suggests that the Fine and Gray model, in this particular situation where a covariate is a risk factor for the competing event (NRM), is systematically underestimating the HR for the event of interest (relapse). We simulated the data with a small increase in the competing event (NRM) risk due to CMV (HR = 1.375), close to the found in Akahoshi et al. The underestimation of the Fine and Gray model for the HR for relapse could be even higher if we had simulated the data with a higher HR for NRM. Figure 1 shows how the Fine and Gray models systematically bias the HR. There was a −0.50 correlation between the parameters of the relapse and nonrelapse mortality Fine and Gray models (which would mean weak/moderate correlation4). The corresponding correlation for the Cox models was 0.05 (negligible correlation). In almost all simulations (99.9%), the association of CMV reactivation and NRM was statistically significant, with either Fine and Gray or Cox models. In the simulations, relapse rates varied from 42% to 48%, and nonrelapse mortality, from 24% to 29%. Due to how the simulated databases were built, the prevalence of previous CMV reactivation was set at 50%.
Boxplot of simulated hazard-ratios obtained by Fine & Gray and Cox models. Boxplot of hazard-ratios obtained from Cox and Fine and Gray models, for each of the 1000 simulated databases.
Boxplot of simulated hazard-ratios obtained by Fine & Gray and Cox models. Boxplot of hazard-ratios obtained from Cox and Fine and Gray models, for each of the 1000 simulated databases.
In summary, we have shown that the interpretation of the Fine and Gray models is not straightforward, and it can be cumbersome to draw conclusions based on them.
Contribution: L.J.A. performed all analyses; and all authors designed and conducted the study.
Conflict-of-interest disclosure: The authors declare no competing financial interests.
Correspondence: Leonardo Javier Arcuri, Hospital Israelita Albert Einstein, Guaramomis 480/64, Sao Paulo, SP, Brazil, 04076-010; email: leonardojavier@gmail.com.
References
Author notes
The R code used in the analyses are provided in the supplemental Material.
The authors declare that the study is original, has not been published before, and is not under consideration in any other journal.
The full-text version of this article contains a data supplement.

