Key Points
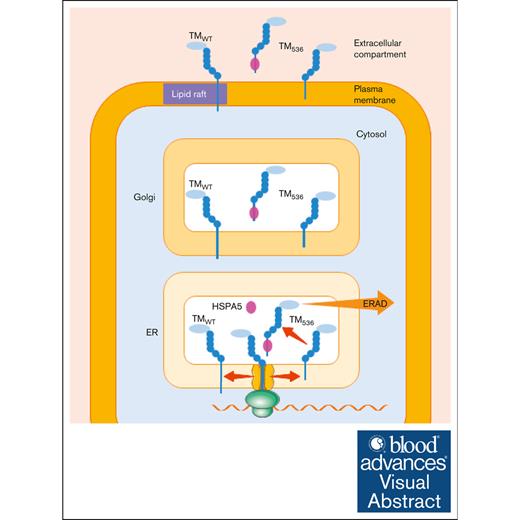
TM536 is inserted into the ER membrane, then spontaneously escapes from it to be released into the extracellular environment.
Intracellular trafficking of TM536 is impaired, its expression on the cell surface is low, and it is not localized in lipid rafts.
Visual Abstract
Expression of the thrombomodulin (TM) variant c.1611C>A (p.Cys537Stop) leads to the synthesis of a protein with no cytoplasmic tail and a transmembrane domain shortened by 3 amino acids (TM536). However, little is known regarding the release mechanism and properties of TM536. Using umbilical vein endothelial cells and peripheral blood-derived endothelial colony-forming cells from a heterozygous carrier of the TM536 variant as well as overexpression cell models, we demonstrated that TM536 is released from cells by an unusual mechanism. First, TM536 is inserted into the endoplasmic reticulum (ER) membrane, then, because of the low hydrophobicity of its intramembrane domain, it escapes from it and follows the conventional secretory pathway to be released into the extracellular compartment without the involvement of proteolysis. This particular secretion mechanism yields a soluble TM536, which is poorly modified by chondroitin sulfate glycosaminoglycan compared with conventionally secreted soluble forms of TM, and therefore has a suboptimal capacity to mediate thrombin-dependent activation of protein C (PC). We also showed that TM536 cellular trafficking was altered, with retention in the early secretory pathway and increased sensitivity to ER-associated degradation. As expected, activation of ER-associated degradation increased TM536 degradation and reduced its release. The expression of TM536 at the cell surface was low, and its distribution in lipid raft-like membrane microdomains was altered, resulting in low thrombin-dependent PC activation on the cell surface.
Introduction
Thrombomodulin (TM) is a type-1 transmembrane glycoprotein expressed on the surface of vascular endothelial cells, consisting of an amino-terminal lectin-like domain, followed by 6 epidermal growth factor-like domains, a serine threonine-rich region containing chondroitin sulfate (CS) glycosaminoglycan addition sites, a transmembrane domain (TMD) and a short cytoplasmic tail.1
TM mediates endothelial anticoagulant function: it binds thrombin (Factor IIa [FIIa]) to form TM-FIIa, which prevents FIIa from converting fibrinogen to fibrin and enables it to activate protein C (PC). Active PC degrades coagulation cofactors Va and VIIIa, thereby reducing FIIa generation. Binding of PC to the endothelial cell PC receptor (EPCR) amplifies and concentrates PC activation at the surface of the vessel wall.2 Interestingly, TM and EPCR have been localized in lipid rafts of endothelial cells plasma membrane.3-5 TM also mediates anti-inflammatory6 and antifibrinolytic processes.1,7
Low concentrations (<10 ng/mL) of soluble forms of TM (sTM) are present in the circulation of healthy individuals.8 Increased circulating levels are considered an indication of endothelial damage.9 The mechanisms underlying TM release have been reviewed.10 Briefly, microvesicles derived from endothelial cells have been shown to carry TM.11,12 Consequently, increased release of microvesicles raises plasma levels of TM. It has been suggested that TM release from endothelial cells involves proteolysis by matrix metalloproteinases (MMPs), a disintegrin and metalloproteinases (ADAMs),13,14 and neutrophil serine proteases.15,16 TM cleavage by the intramembrane rhomboid protease RHBDL2 has been described,15 but its occurrence in endothelial cells remains uncertain.
Mutations in the THBD gene (encoding TM), which is responsible for high plasma levels of sTM, have been identified in patients with bleeding phenotypes. The frameshift variant c.1487delC (p.Pro496Argfs∗10) results in the synthesis of a secreted TM (TMFS) lacking cytoplasmic tail and TMD.17 The variant c.1611C>A (p.Cys537Stop) produces a truncated TM (TM536, ending at Leu536) lacking cytoplasmic tail and with the TMD shortened by 3 amino acids.14,18-23 High levels of sTM in the plasma of these patients have been shown to be responsible for increased PC activation, leading to reduced FIIa generation,17,20 and have therefore been suggested as the cause of the bleeding phenotype.
Despite its short intramembrane domain (IMD), TM536 is still expressed on the cell surface,14 and the mechanisms contributing to its high plasma levels are poorly understood. This work elucidates the mechanisms responsible for the excessive release of TM536 and characterizes the regulation of its efficacy as a cofactor in PC activation.
Methods
Cell culture and transfection
Human umbilical venous endothelial cells (HUVECs) were isolated and cultured as described.24 HEK293 cells (GripTite 293 MSR; Thermo Fisher Scientific) were cultured as described by the manufacturer. Plasmid transient transfection was performed using PolyJet reagent (SignaGen Laboratories).
GPMV preparation
Giant plasma membrane vesicles (GPMVs) were prepared as described.25 Transfected HEK293 cells were incubated for 2 hours in vesiculation buffer (20 mM HEPES [N-2-hydroxyethylpiperazine-N′-2-ethanesulfonic acid; pH 7.4], 150 mM NaCl, 2 mM CaCl2, 1.9 mM dithiothreitol, and 27.6 mM formaldehyde). The supernatant was centrifuged (500 g; 5 minutes) to remove detached cells, and GPMV was concentrated by centrifugation (25 000g; 35 minutes) and resuspended in a culture medium.
Plasma membrane–depleted microsome preparation
Transfected HEK293 cells were harvested by scraping, pelleted by centrifugation (300g; 3 minutes), resuspended in 10 mM HEPES (pH 7.8), 250 mM sucrose, 1 mM EGTA, and 2.5 mM KCl sonicated (3 bursts of 5 seconds), and centrifuged (12 000g; 15 minutes). The supernatant containing microsomes was supplemented with CaCl2 and MgCl2 (1 mM), incubated with Concanavalin-A Sepharose (45 minutes; 4°C), and centrifuged (500g; 3 minutes) to remove glycoprotein-rich membranes (plasma membrane). Supernatant containing plasma membrane–depleted microsomes was centrifuged (100 000g; 2 hours). Pelleted microsomes were disrupted by 30-minute incubation in Na2CO3 (100 mM, pH 11.5) or saponin (0.32%) solution, and then centrifuged (100 000g; 2 hours) to separate intravesicular proteins from vesicle membranes.
Soluble His-TM purification
HEK293 cells expressing His-TM were incubated overnight in a serum-free medium. The culture medium was supplemented with protease inhibitors, centrifuged (100 000g; 1 hour), concentrated by filtration (30 kilodalton [kDa] molecular weight cutoff), and then diluted in binding buffer (Na3PO4, 50 mM [pH 8], NaCl 300 mM, Tween 20 0.01%). Soluble His-TM was isolated by immobilized metal affinity chromatography using a Dynabeads His-tag isolation kit, as described by the manufacturer (Invitrogen).
Cell surface biotinylation
Cells were incubated with the membrane-impermeable biotinylation reagent Sulfo-NHS-SS-Biotin (0.25 mg/mL; 30 minutes; 4°C), washed with Tris 50 mM (pH 8) to stop the reaction, and then lysed. Biotinylated proteins were isolated using NeutrAvidin Agarose resin and analyzed by immunoblot.
PC activation
Cells in a 48-well plate were incubated with PC (200 nM; 30 minutes; 25°C) then washed to remove unbound PC and incubated with 50 μL of FIIa solution (0.02 U/mL in Hanks balanced salt solution; 45 minutes; 37°C). The incubation medium was transferred to a 96-well plate, FIIa was inhibited with antithrombin (0.5 μM) and heparin (10 U/mL) addition, then the colorimetric substrate of activated PC (S-2366) was added. Absorbance was read at 405 nm every 5 minutes for 50 minutes. In some experiments, PC activation was performed in vitro using soluble TM.
Immunoblot
Cells were lysed in the presence of protease inhibitors. Identical amounts of proteins were heat-denatured, reduced, and then separated by sodium dodecyl sulfate–polyacrylamide gel electrophoresis (SDS-PAGE) using NuPAGE gels (Thermo Fisher Scientific) and MES (2-(N-morpholino) ethanesulfonic acid) migration buffer, and then transferred to a polyvinylidene fluoride membrane for immunoblot detection.
Flow cytometry
The cell-surface expression of TM and EPCR was analyzed using flow cytometry (BD Accuri C6; BD Biosciences). The cells were gated on the forward and side scatter to exclude dead cells, debris, and aggregates.
Statistical analyses
All data were analyzed using GraphPad Prism software, and individual statistical 2-sided tests used are identified in the figure legends. P values ≤ .05 were considered statistically significant.
Results
Patients’ description
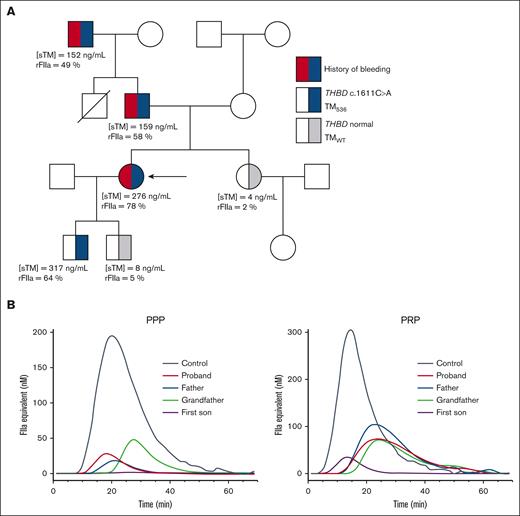
A 22-year-old French woman was referred to the “Center for Hemorrhagic and Thrombotic Diseases” at Timone Hospital (Marseilles, France) because of a personal and family history of unexplained bleeding after trauma or surgery (Figure 1A; supplemental Table 1). The patient showed no abnormalities in coagulation, fibrinolysis (supplemental Table 2), platelet function, or the expression of major platelet membrane glycoproteins (supplemental Tables 3 and 4). Plasma from the patient, her father, grandfather, and first son showed higher concentrations of sTM (Figure 1A) and lower FIIa generation than healthy subjects (Figure 1B; supplemental Table 5). High concentrations of FIIa were found in the serum derived from their coagulated plasma (Figure 1A). The sTM concentration in patients' plasma was not reduced by microvesicle removal (supplemental Table 6), indicating that sTM is not carried by microvesicles. Sequencing of the THBD gene revealed the heterozygous c.1611C>A mutation, which led to the synthesis of TM536 (Figure 1A; supplemental Table 7).
Patients’ description. (A) Pedigrees of the affected family. Squares denote males; circles denote females; slash denote deceased family member; solid red and black symbols represent family members with a history of bleeding and heterozygous carriers of the THBD variant (c.1611C>A giving TM536), respectively. The arrow indicates the proband. Plasma sTM concentrations were measured by enzyme-linked immunosorbent assay (ELISA; normal value <10 ng/mL). rFIIa was measured in the serum derived from the coagulation of plasma (normal value <30%). (B) FIIa generation assays were performed in PPP and PRP plasma from a control participant and 4 family members affected by the TM536 mutation. PPP, platelet-poor plasma; PRP, platelet-rich plasma; rFIIa, residual FIIa.
Patients’ description. (A) Pedigrees of the affected family. Squares denote males; circles denote females; slash denote deceased family member; solid red and black symbols represent family members with a history of bleeding and heterozygous carriers of the THBD variant (c.1611C>A giving TM536), respectively. The arrow indicates the proband. Plasma sTM concentrations were measured by enzyme-linked immunosorbent assay (ELISA; normal value <10 ng/mL). rFIIa was measured in the serum derived from the coagulation of plasma (normal value <30%). (B) FIIa generation assays were performed in PPP and PRP plasma from a control participant and 4 family members affected by the TM536 mutation. PPP, platelet-poor plasma; PRP, platelet-rich plasma; rFIIa, residual FIIa.
TM536 release is elevated and its expression on the cell surface and in lipid rafts is reduced
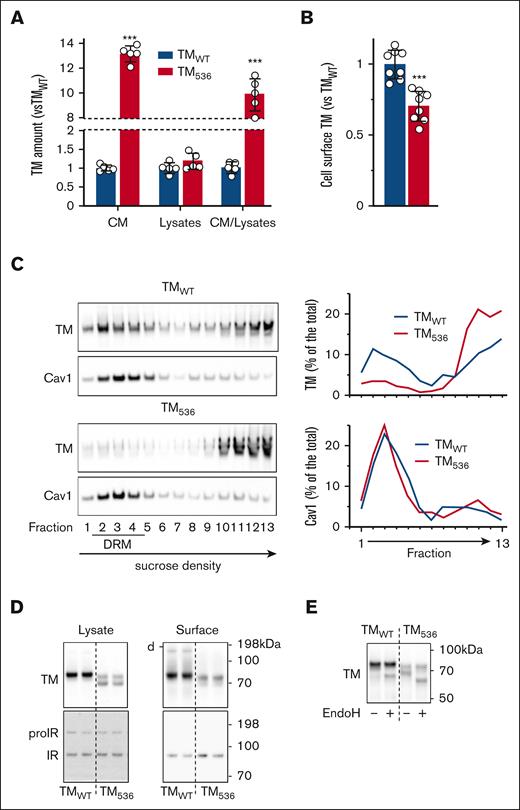
We investigated the behavior of wild-type TM (TMWT) and TM536 overexpressed in HEK293 cells. TM536 accumulated more in cell culture media (CM) than in TMWT, although their cellular amounts were similar (Figure 2A). Flow cytometry analysis revealed that TM536 exhibited lower cell-surface expression than TMWT (Figure 2B).
Expression and release of TM536. TMWT and TM536 were overexpressed in HEK293 cells then (A) TM was measured by ELISA in cell CM after 17 hours of accumulation and in cell lysates (CM/lysate ratio reflects TM release capacity) and (B) TM cell-surface expression was measured by flow cytometry. (C) Cells were homogenized for DRM preparation, and TM and Cav1 (DRM marker) were detected by immunoblot in each fraction of the sucrose density gradient. Densitometric analysis of the immunoblots (right panels) shows TM and Cav1 distribution in the gradient as a percentage of their total amount. (D) Immunoblot detection of TM and endogenous IR in lysates of cells overexpressing TMWT and TM536 and on their surfaces after biotinylation and enrichment of cell-surface–exposed proteins (d- indicates the position of TM homodimers). The enrichment of cell-surface–exposed proteins is attested by the detection of IR. The proIR is intracellular and only detected in cell lysates, whereas its mature form (IR) is exposed at the cell surface. (E) Lysates from cells overexpressing TMWT or TM536 were left untreated (−) or deglycosylated with EndoH (+), and TM was detected using immunoblot. Values are mean ± standard deviation (SD) expressed as fold change relative to TMWT. Statistical analyses were performed using unpaired t test in panels A,B. ∗∗∗P < .001. CaV1, Caveolin 1; IR, insulin receptor; proIR, proform of IR.
Expression and release of TM536. TMWT and TM536 were overexpressed in HEK293 cells then (A) TM was measured by ELISA in cell CM after 17 hours of accumulation and in cell lysates (CM/lysate ratio reflects TM release capacity) and (B) TM cell-surface expression was measured by flow cytometry. (C) Cells were homogenized for DRM preparation, and TM and Cav1 (DRM marker) were detected by immunoblot in each fraction of the sucrose density gradient. Densitometric analysis of the immunoblots (right panels) shows TM and Cav1 distribution in the gradient as a percentage of their total amount. (D) Immunoblot detection of TM and endogenous IR in lysates of cells overexpressing TMWT and TM536 and on their surfaces after biotinylation and enrichment of cell-surface–exposed proteins (d- indicates the position of TM homodimers). The enrichment of cell-surface–exposed proteins is attested by the detection of IR. The proIR is intracellular and only detected in cell lysates, whereas its mature form (IR) is exposed at the cell surface. (E) Lysates from cells overexpressing TMWT or TM536 were left untreated (−) or deglycosylated with EndoH (+), and TM was detected using immunoblot. Values are mean ± standard deviation (SD) expressed as fold change relative to TMWT. Statistical analyses were performed using unpaired t test in panels A,B. ∗∗∗P < .001. CaV1, Caveolin 1; IR, insulin receptor; proIR, proform of IR.
As the length of a protein TMD determines its distribution in lipid rafts,26 we analyzed the repartition of TMWT and TM536 in the detergent-resistant membrane fraction (DRM). TMWT was detected both inside and outside the DRM, whereas TM536 was mainly detected outside the DRM (Figure 2C). The presence of the entire IMD in TM539 (supplemental Table 7) prevented its release (supplemental Figure 1A) but did not restore its normal distribution in the DRM (supplemental Figure 1B), indicating that the high release of TM536 is not due to its altered membrane distribution and that TM distribution in lipid rafts involves factors other than the TMD length alone.
TM536 accumulates in the early secretory pathway (ESP)
TMWT was detected by immunoblot as a single band above 70 kDa, whereas TM536 appeared as 2 bands above and below 70 kDa (Figure 2D). TM detection in cell-surface–biotinylated proteins (Figure 2D) and in proteins from the plasma membrane model GPMV (supplemental Figure 2A) showed that bands >70 kDa represent cell-surface–exposed TMWT and TM536.
As expected, cell surface TMWT migrated slightly slower in SDS-PAGE than the 38 amino acid shorter TM536 (Figure 2D; supplemental Figure 2A).
Treatment of cell lysates with Endoglycosidase H (EndoH), which removes N-linked glycans from glycoproteins that have not trafficked to the cis-medial Golgi, altered the migration of TM536 detected <70 kDa, indicating that it localizes in the ESP. The high proportion of EndoH-sensitive TM536 compared with TMWT (Figure 2E) indicates its preferential accumulation in the ESP.
The form of TM detected at ∼150 kDa (Figure 2D) likely corresponds to SDS-resistant dimers (supplemental Figure 2).
Confirmation of TM536 behavior in patient cells
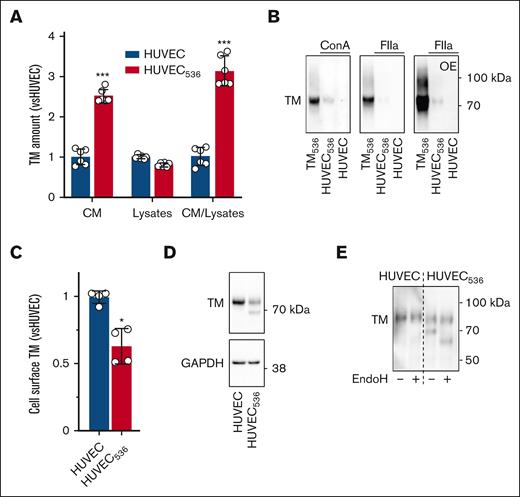
Endogenous TM expression and release were characterized in HUVEC from control patients (HUVEC) and the proband (HUVEC536), who had given birth to a son carrying the TM536 mutation. TM messenger RNA levels were similar in both HUVEC types (supplemental Figure 3A), but HUVEC536 released more sTM (Figure 3A). sTM contained in the CM of HUVEC536 and sTM536 produced by overexpression in HEK293 cells showed similar mobility on SDS-PAGE (Figure 3B), suggesting that both cell types release the same form of sTM. HUVEC536 expressed less TM at their surface than HUVEC (Figure 3C). TM was detected as a single band >70 kDa in HUVEC lysates and as 2 bands in HUVEC536 (Figure 3D), with a migration profile similar to that of TM and TM536 coexpressed in HEK293 cells (supplemental Figure 3B). Similarly, TM was detected as 2 bands in the patient’s endothelial colony forming cells lysate (supplemental Figure 3C). TM detected <70 kDa in HUVEC536 lysates was sensitive to EndoH deglycosylation, indicating its ESP localization (Figure 3E). The coexpression of TMWT and TM536 in HUVEC536 and the impossibility of specifically detecting TM536 prevented the characterization of TM536 distribution in the DRM (supplemental Figure 3D).
Expression and release of TM from HUVEC. (A) TM was measured by ELISA in HUVEC and HUVEC536 CM and lysates (CM/lysate ratio reflects TM release capacity). (B) TM contained in the CM of HUVEC and HUVEC536 was concentrated by Con A or FIIa affinity purification and run on SDS-PAGE alongside sTM produced by HEK293 cells overexpressing TM536, then TM was detected by immunoblot. (C) Expression of TM on the surface of HUVEC and HUVEC536 was measured using flow cytometry. (D) Immunoblot detection of TM and GAPDH (loading control) in lysates of HUVEC and HUVEC536. (E) TM was detected in the lysates of HUVEC and HUVEC536 submitted (+) or not (−) to EndoH deglycosylation. Value are mean ± SD expressed as fold change relative to TMWT or HUVEC. Statistical analyses were performed using an unpaired t test for panel A or Mann-Whitney test for panel C. ∗P < .05; ∗∗∗P < .001. Con A, Concanavalin A; GAPDH, glyceraldehyde-3-phosphate dehydrogenase; OE, overexposed blot.
Expression and release of TM from HUVEC. (A) TM was measured by ELISA in HUVEC and HUVEC536 CM and lysates (CM/lysate ratio reflects TM release capacity). (B) TM contained in the CM of HUVEC and HUVEC536 was concentrated by Con A or FIIa affinity purification and run on SDS-PAGE alongside sTM produced by HEK293 cells overexpressing TM536, then TM was detected by immunoblot. (C) Expression of TM on the surface of HUVEC and HUVEC536 was measured using flow cytometry. (D) Immunoblot detection of TM and GAPDH (loading control) in lysates of HUVEC and HUVEC536. (E) TM was detected in the lysates of HUVEC and HUVEC536 submitted (+) or not (−) to EndoH deglycosylation. Value are mean ± SD expressed as fold change relative to TMWT or HUVEC. Statistical analyses were performed using an unpaired t test for panel A or Mann-Whitney test for panel C. ∗P < .05; ∗∗∗P < .001. Con A, Concanavalin A; GAPDH, glyceraldehyde-3-phosphate dehydrogenase; OE, overexposed blot.
In summary, TM536 expression results in high sTM release and low TM cell-surface expression. TM536 is not incorporated into lipid rafts and its intracellular trafficking is impaired.
The high release of TM536 does not involve proteolysis
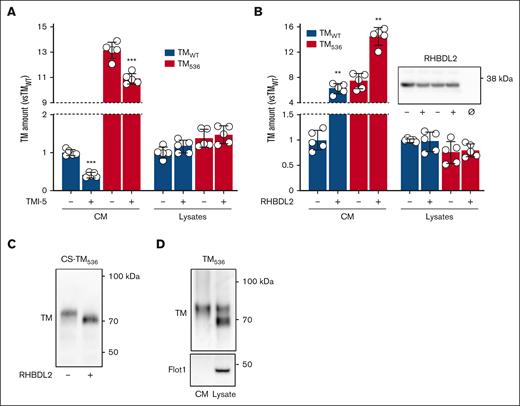
Treatment of HEK293 cells with MMPs and ADAMs inhibitors strongly decreased the release of overexpressed TMWT (by up to 80%) and only slightly decreased that of TM536 (by up to 20%) (Figure 4A; supplemental Figure 4) without altering their cellular content. This result indicates that MMPs or ADAMs are not involved in the high release of sTM536. Overexpression of RHBDL2 increased the release of sTMWT and sTM536 (Figure 4B). However, RHBDL2-cleaved sTM536 migrated faster in SDS-PAGE than sTM536 released without RHBDL2 action (Figure 4C), ruling out the involvement of RHBDL2 in the excessive basal release of TM536. To facilitate visualization of the difference in mobility between RHBDL2-cleaved and uncleaved sTM536, TM536 lacking CS addition sites was used (supplemental Table 7). Interestingly, sTM536 in the CM and TM536 present at the cell surface (upper band detected in the cell lysate) showed similar mobility in SDS-PAGE (Figure 4D), suggesting the release of full-length TM536 into the CM. Supporting this notion, mass spectrometry analysis of sTM536 contained in CM identified a C-terminal tryptic peptide ending at Leu536 (supplemental Figure 5).
Characterization of released sTM536. (A) HEK293 cells overexpressing TMWT and TM536 were treated with TMI-5 (+; 5 μM; 17 hours), and TM was measured by ELISA in CM and cell lysates. (B) TMWT and TM536 were overexpressed together with inactive (−) or active (+) RHBDL2, and TM was measured by ELISA, as in panel A (inset shows RHBDL2 expression in cell lysates; Ø, no RHBDL2). (C) CS-TM536 was overexpressed together with inactive (−) or active (+) RHBDL2, and sTM536 in CM was detected by immunoblot. (D) Immunoblot detection of TM536 and Flot1 (used as a cell lysate marker) contained in CM and cell lysate. Values are mean ± SD, expressed as fold change relative to TMWT-overexpressing cells. Statistical analyses were performed using an unpaired t test for panel A or Mann-Whitney test for panel B. ∗∗P < .01; ∗∗∗P < .001. CS-TM536, CS-devoid TM536; Flot1, Flotilin 1.
Characterization of released sTM536. (A) HEK293 cells overexpressing TMWT and TM536 were treated with TMI-5 (+; 5 μM; 17 hours), and TM was measured by ELISA in CM and cell lysates. (B) TMWT and TM536 were overexpressed together with inactive (−) or active (+) RHBDL2, and TM was measured by ELISA, as in panel A (inset shows RHBDL2 expression in cell lysates; Ø, no RHBDL2). (C) CS-TM536 was overexpressed together with inactive (−) or active (+) RHBDL2, and sTM536 in CM was detected by immunoblot. (D) Immunoblot detection of TM536 and Flot1 (used as a cell lysate marker) contained in CM and cell lysate. Values are mean ± SD, expressed as fold change relative to TMWT-overexpressing cells. Statistical analyses were performed using an unpaired t test for panel A or Mann-Whitney test for panel B. ∗∗P < .01; ∗∗∗P < .001. CS-TM536, CS-devoid TM536; Flot1, Flotilin 1.
TM536 leaks from ER membrane
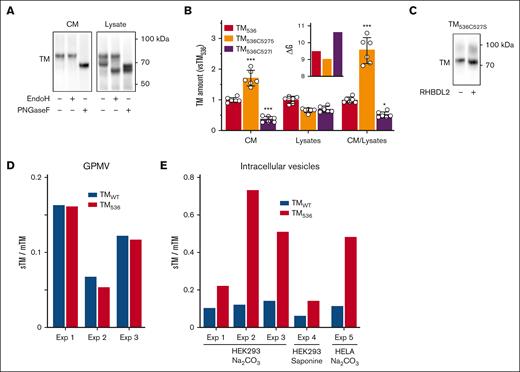
Soluble TM536 in CM was deglycosylated by PNGaseF but not by EndoH (Figure 5A), indicating that it follows the canonical endoplasmic reticulum (ER)/Golgi-dependent secretion pathway.
Mechanism of TM536 release from cells. (A) CM from TM536-overexpressing cells were left untreated (−) or deglycosylated with EndoH or PNGaseF (+), then TM was detected by immunoblot. Enzyme’s ability to deglycosylate TM536 was confirmed using TM536 from the cell lysate. (B) The indicated forms of TM536 were overexpressed in HEK293 cells, then TM was measured by ELISA in the CM and cell lysates (CM/lysate ratio reflects TM release capacity). The inset shows the hydropathy scores (ΔG) of IMD. Values are mean ± SD, expressed as fold change compared with TM536. Statistical analyses were performed using analysis of variance (ANOVA) followed by Dunnett multiple comparison tests (vs TM536): ∗P < .05; ∗∗∗P < .001. (C) Immunoblot detection of soluble forms of TM536C527S contained in the CM of HEK293 cells overexpressing the inactive (−) or active form (+) of RHBDL2. (D) GPMV was prepared from HEK293 cells overexpressing TMWT and TM536 and incubated for 5 hours. TM in CM (sTM) and GPMV lysates (mTM) was measured by ELISA. The release of TM from GPMVs is shown by the ratios of sTM/mTM from 3 independent experiments (Exp 1-3). (E) Intracellular vesicles prepared from HEK293 and HELA cells overexpressing TMWT and TM536 were disrupted by incubation in Na2CO3 or saponin, and soluble TM (sTM) and mTM levels were measured by ELISA. The release of TM in the lumen of intracellular vesicles is shown by the ratios of sTM/mTM from 5 independent experiments (Exp 1-5). Exp, experiment; mTM, membrane TM.
Mechanism of TM536 release from cells. (A) CM from TM536-overexpressing cells were left untreated (−) or deglycosylated with EndoH or PNGaseF (+), then TM was detected by immunoblot. Enzyme’s ability to deglycosylate TM536 was confirmed using TM536 from the cell lysate. (B) The indicated forms of TM536 were overexpressed in HEK293 cells, then TM was measured by ELISA in the CM and cell lysates (CM/lysate ratio reflects TM release capacity). The inset shows the hydropathy scores (ΔG) of IMD. Values are mean ± SD, expressed as fold change compared with TM536. Statistical analyses were performed using analysis of variance (ANOVA) followed by Dunnett multiple comparison tests (vs TM536): ∗P < .05; ∗∗∗P < .001. (C) Immunoblot detection of soluble forms of TM536C527S contained in the CM of HEK293 cells overexpressing the inactive (−) or active form (+) of RHBDL2. (D) GPMV was prepared from HEK293 cells overexpressing TMWT and TM536 and incubated for 5 hours. TM in CM (sTM) and GPMV lysates (mTM) was measured by ELISA. The release of TM from GPMVs is shown by the ratios of sTM/mTM from 3 independent experiments (Exp 1-3). (E) Intracellular vesicles prepared from HEK293 and HELA cells overexpressing TMWT and TM536 were disrupted by incubation in Na2CO3 or saponin, and soluble TM (sTM) and mTM levels were measured by ELISA. The release of TM in the lumen of intracellular vesicles is shown by the ratios of sTM/mTM from 5 independent experiments (Exp 1-5). Exp, experiment; mTM, membrane TM.
If a fraction of TM536 behaved like a “conventional” secreted protein, it would not be inserted into the membrane and would be found as a full-length protein in the CM. This full-length sTM536 would escape proteolysis by RHBDL2, which only cleaves membrane-anchored substrates. Consequently, full-length sTM536 and RHBDL2-cleaved sTM536 coexisted in the CM. Immunoblot analyses of sTM536 contained in the CM revealed a different situation: upon RHBDL2 overexpression, the band corresponding to full-length sTM536 disappeared, whereas that corresponding to RHBDL2-cleaved sTM536 appeared (Figure 4C), indicating that all synthesized TM536 was inserted into the ER membrane. Therefore, the basal release of full-length TM536 is likely due to spontaneous leakage from the membranes.
We tested the hypothesis that the IMD of TM536 is not sufficiently hydrophobic to confer stable membrane insertion. Substitution of Cys527 (in the middle of the IMD) with Ser or Ile to reduce or increase IMD hydropathy (supplemental Table 7) resulted in the increased and reduced release of TM536, respectively (Figure 5B). These data support the idea that the high release of TM536 is due to the low hydropathy of its IMD. TM536C527S, with the least hydrophobic IMD, was no longer detected in the CM of RHBDL2-overexpressing cells (Figure 5C), indicating that it follows the same secretion mechanism as TM536.
To identify the membrane compartment from which TM536 is released, we first measured TM liberation from GPMV derived from cells overexpressing TMWT or TM536. Both types of GPMV exhibited similar TM release capacities (Figure 5D), suggesting that TM536 does not escape from the plasma membrane. We then investigated the presence of sTM536 inside the vesicles of the secretory pathway (supplemental Figure 6). The proportion of intraluminal TM536 was higher than that of TMWT (Figure 5E), implying that sTM536 exists in the lumen of the ER and/or Golgi.
TM536 is a substrate for ER-associated degradation (ERAD)
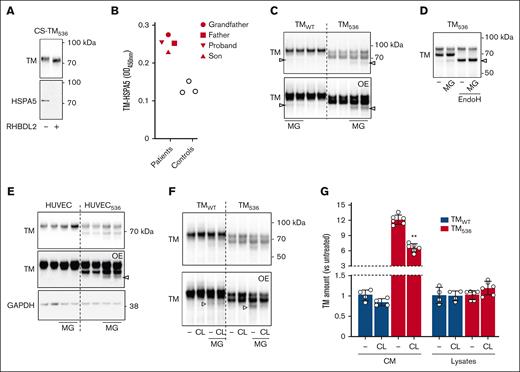
sTM536 contained in the CM was found to be associated with the ER protein chaperone heat shock protein family A (Hsp70) member 5 (HSPA5) (Figure 6A), and this interaction was barely detected with RHBDL2-cleaved sTM536, which lacks IMD. An enzyme-linked immunosorbent assay specifically detecting the TM-HSPA5 complex (supplemental Figure 7A) revealed its increased presence in plasma from TM536 patients compared with healthy patients (Figure 6B; supplemental Figure 7B).
Degradation of TM536 by ERAD. (A) His-tagged CS-TM536 was overexpressed with inactive (−) or active (+) RHBDL2, soluble TM was purified by immobilized metal affinity chromatography from CM, and TM and HSPA5 were detected by immunoblot. (B) The TM-HSPA5 complex was detected by ELISA in the plasma from TM536 patients (patients) and healthy participants (controls). (C) Cells overexpressing TMWT or TM536 were treated or not with MG (5 μM; 17 hours) then TM in cell lystates was detected by immunoblot. (D) Cells overexpressing TM536 were treated with MG, cell lysates were deglycosylated with EndoH, and TM was detected by immunoblot. (E) TM detected by immunoblot in lysates of HUVEC and HUVEC536 treated with MG (5 μM; 17 hours; GAPDH, loading control). (F) Cells overexpressing TMWT or TM536 were treated with CL (10 μM; 17 hours) and MG, and TM was detected by immunoblot of cell lysates. (G) Cells overexpressing TMWT or TM536 were treated with CL, and then TM in CM and cell lysates were measured by ELISA. Values are mean ± SD expressed as fold change compared with TMWT without CL. Statistical analyses were performed using the Mann-Whitney test. ∗∗P < .01. Arrowheads on overexposed blots (OE) indicate bands that appear with MG132 treatment. MG, MG132.
Degradation of TM536 by ERAD. (A) His-tagged CS-TM536 was overexpressed with inactive (−) or active (+) RHBDL2, soluble TM was purified by immobilized metal affinity chromatography from CM, and TM and HSPA5 were detected by immunoblot. (B) The TM-HSPA5 complex was detected by ELISA in the plasma from TM536 patients (patients) and healthy participants (controls). (C) Cells overexpressing TMWT or TM536 were treated or not with MG (5 μM; 17 hours) then TM in cell lystates was detected by immunoblot. (D) Cells overexpressing TM536 were treated with MG, cell lysates were deglycosylated with EndoH, and TM was detected by immunoblot. (E) TM detected by immunoblot in lysates of HUVEC and HUVEC536 treated with MG (5 μM; 17 hours; GAPDH, loading control). (F) Cells overexpressing TMWT or TM536 were treated with CL (10 μM; 17 hours) and MG, and TM was detected by immunoblot of cell lysates. (G) Cells overexpressing TMWT or TM536 were treated with CL, and then TM in CM and cell lysates were measured by ELISA. Values are mean ± SD expressed as fold change compared with TMWT without CL. Statistical analyses were performed using the Mann-Whitney test. ∗∗P < .01. Arrowheads on overexposed blots (OE) indicate bands that appear with MG132 treatment. MG, MG132.
The interaction between TM536 and HSPA5 supports the notion that a fraction of TM536 with its HSPA5-coated IMD is present in the ER lumen, suggesting that TM536 in the ER lumen triggers the unfolded protein response (UPR). Indeed, overexpression of TM536 significantly increased messenger RNA levels of the ER stress markers HSPA5 and the spliced form of XBP1 compared with overexpression of TMWT (supplemental Figure 8). Proteasome inhibition by MG132 revealed a low-molecular-weight form of TM536 (Figure 6C) with SDS-PAGE mobility similar to that of EndoH-deglycosylated TM536 (Figure 6D), suggesting that it accumulates in the ER. Such a form of TM was barely detected with TMWT. Similarly, proteasome inhibition resulted in TM accumulation in the ER of HUVEC536 but not in HUVEC (Figure 6E). These results indicate that TM536 is more likely than TMWT to induce UPR and undergo proteasome-dependent ERAD.
Claramine reduces TM536 release
Although TM536 is sensitive to ERAD, a significant amount escapes it and accumulates in the CM. We hypothesized that ERAD stimulation would reduce the release of TM536. We have previously shown that claramine (CL) enhances the ERAD-dependent elimination of misfolded proteins.27
Treatment of HEK293 cells with CL reduced the amount of TM536 accumulated in the ER upon proteasome inhibition (Figure 6F), indicating that CL increased TM536 degradation via a pathway that bypasses the proteasome. Consistently, the release of TM536 was reduced by CL (50%), whereas that of TMWT was minimally affected (Figure 6G; supplemental Figure 9A). Other molecules intended to modulate ER protein quality control systems did not reduce TM536 release (supplemental Figure 9B). Readthrough-promoting molecules did not rescue full-length TM expression in TM536-expressing cells or decrease TM536 release (supplemental Figure 9C-D).
These results indicate that the ER protein quality control system can be targeted to reduce TM536 release.
Cells expressing TM536 exhibit low PC activation on their surface
We investigated whether the reduced amount of TM on the surface of TM536-expressing cells and the poor integration of TM536 in lipid rafts influenced FIIa-dependent PC activation.
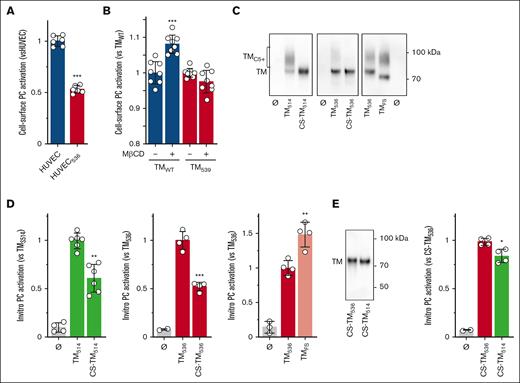
HUVEC and HUVEC536 expressed similar amounts of EPCR on their surfaces (supplemental Figure 10A). However, FIIa-dependent activation of EPCR-bound PC was lower in HUVEC536 than in HUVEC (Figure 7A; supplemental Figure 10B), which is consistent with TM expression on the surface of these cells (Figure 3C). The role of TM localization in lipid rafts on PC activation was analyzed using HEK293 cells overexpressing EPCR and TMWT or TM539 (poorly integrated in lipid rafts but not released from cells; supplemental Figure 1). Disruption of lipid rafts by methyl-β-cyclodextrin increased PC activation on TMWT cells, but not on TM539 cells (Figure 7B; supplemental Figure 10C), suggesting that TM localization in lipid rafts plays a role in regulating its cofactor activity in PC activation.
Cofactor activity of TM. (A) PC activation measured on the surfaces of HUVEC and HUVEC536. (B) HEK293 cells expressing EPCR and TMWT or TM539 were treated (+) or not (−) with 10 mM MβCD for 20 minutes before starting the PC activation protocol, and PC activity was measured. (C) Immunoblot detection of the indicated sTM and their CS-devoid counterparts accumulated in the CM. TMCS+ indicates the position of the CS-modified TM, and Ø indicates the absence of the TM. (D) FIIa-dependent PC activation measured in vitro in the presence of the same amount of the indicated sTM. (E) Immunoblot detection of soluble CS-TM536 and CS-TM514 and their efficacy as cofactors in PC activation. Relative PC activities (mean ± SD) obtained after 30 to 50 minutes of PC substrate conversion are shown. Statistical analyses were performed using unpaired t test. ∗P < .05; ∗∗P < .01; ∗∗∗P < .001. CS-TM, CS-devoid TM; MβCD, methyl-β-cyclodextrin.
Cofactor activity of TM. (A) PC activation measured on the surfaces of HUVEC and HUVEC536. (B) HEK293 cells expressing EPCR and TMWT or TM539 were treated (+) or not (−) with 10 mM MβCD for 20 minutes before starting the PC activation protocol, and PC activity was measured. (C) Immunoblot detection of the indicated sTM and their CS-devoid counterparts accumulated in the CM. TMCS+ indicates the position of the CS-modified TM, and Ø indicates the absence of the TM. (D) FIIa-dependent PC activation measured in vitro in the presence of the same amount of the indicated sTM. (E) Immunoblot detection of soluble CS-TM536 and CS-TM514 and their efficacy as cofactors in PC activation. Relative PC activities (mean ± SD) obtained after 30 to 50 minutes of PC substrate conversion are shown. Statistical analyses were performed using unpaired t test. ∗P < .05; ∗∗P < .01; ∗∗∗P < .001. CS-TM, CS-devoid TM; MβCD, methyl-β-cyclodextrin.
Consequently, TM cofactor activity during PC activation is determined by its expression on the cell surface and its localization in lipid rafts.
TM secretion mechanisms affect its CS modification and cofactor activity in PC activation
Overexpression of secreted TM514 (supplemental Table 7) in HEK293 cells produced a soluble form that migrated on SDS-PAGE as 2 bands: 1 smeared ∼100 kDa and the other thin, slightly >70 kDa (Figure 7C). The smeared band corresponded to CS-modified TM514 because it was not present upon substitution of the CS attachment sites (supplemental Table 7; Figure 7C). The proportion of CS-modified full-length sTM536 was lower than that of TM514 and the naturally secreted variant TMFS (Figure 7C), suggesting that the addition of CS to the soluble forms of TM depends on their secretion mechanisms.
The presence of CS in TM is known to enhance its binding to FIIa,28 we therefore examined the impact of this modification on the efficacy of soluble TM to mediate FIIa-dependent PC activation in vitro (supplemental Figure 11A). As expected, TM514 and sTM536 provided greater PC activation than same amounts of their CS-devoid counterparts (Figure 7D; supplemental Figure 11B-C). TMFS, which is more CS-modified than TM536, was more effective than the latter as a cofactor in PC activation (Figure 7E; supplemental Figure 11D) and in supporting thrombin activatable fibrinolysis inhibitor cleavage by FIIa (supplemental Figure 12).
PC activation mediated by CS-devoid TM536 was barely different from that mediated by TM514 lacking CS and IMD (Figure 7F; supplemental Figure 11E), highlighting the modest role of the IMD in this activation.
Therefore, the efficacy of sTM as a cofactor in PC activation is determined by the proportion of its CS-modified form.
Discussion
Patients with the TM536 mutation have high plasma concentrations of TM, making them prone to bleeding. In this work, we have elucidated the mechanism responsible for the increased release of TM536 from cells and proposed a strategy to reduce it. We have shown that TM536-expressing cells have a reduced capacity to promote PC activation by FIIa and that the efficiency of soluble TM536 as a cofactor in PC activation is lower than that of TMFS. Some features of TM536 inferred from cellular overexpression models were confirmed by observations in HUVEC and endothelial colony forming cells obtained from a patient carrying the TM536 mutation.
The clinical features of newly identified patients with TM536 mutation were similar to those of previously studied patients,19,20,22,23 with sTM plasma levels ∼40 times higher than normal and reduced FIIa generation. Our results further show that the high TM levels in the plasma of TM536 patients are not due to TM-carrying microvesicles.
Cells expressing TM536 release more sTM than TMWT-expressing cells14 (and this work) and this release occurs via the conventional secretory pathway. Mass spectrometry analyses revealed that TM536 is released from cells with its entire IMD, ruling out the possibility that its substantial release results from increased proteolysis. Consistent with this, TM536 release was minimally reduced by inhibitors of MMPs and ADAMs compared with TMWT. This result contrasts with that of a previous study showing that the MMP inhibitor GM6001 was very effective in reducing sTM536 release.14 However, this study did not examine the effect of GM6001 on the cellular levels of TM, which may have biased the interpretation of the results. The high release of TM536 is also not due to its increased cleavage by RHBDL2. However, the fact that TM536 without a cytoplasmic tail is cleaved by RHBDL2 contradicts a previous study concluding that the TM cytoplasmic tail is required for its cleavage by RHBDL2.29 However, in that study, the cytoplasmic tail of TM was replaced by that of other proteins and not completely deleted, as in the case of TM536.
The detection of sTM536 in the lumen of ESP vesicles suggests that either the protein enters the ER lumen as a secreted protein or is first inserted into the ER membrane before leaking from the membranes of the ESP vesicles. Because RHBDL2 cleaves only membrane-anchored substrates30 and overexpression of RHBDL2 increases the amount of cleaved sTM536 at the expense of full-length sTM536, we conclude that all synthesized TM536 is inserted into the ER membrane. Therefore, full-length sTM536 present in CM originates from the spontaneous leakage of TM536 from the membranes of ESP vesicles. A hydrophobic mismatch between the short IMD of TM536 and the lipid bilayer could explain the nonpermanent nature of TM536 insertion in membranes, leading to its release. Supporting this interpretation, the substitution of an amino acid in the IMD of TM536 to increase or reduce its hydropathy reduces or increases the release of sTM536. We identified dimers of TMWT and TM536 in cells. Because oligomerization of transmembrane proteins is a process that attenuates the hydrophobic mismatch between intramembrane α-helical peptides and the lipid bilayer,31 it is possible that the fraction of TM536 that remains inserted into membranes consists of TM536 dimers.
The high spontaneous release of TM536 from membranes is definitely a prerequisite for increasing sTM536 concentration in CM or plasma. However, it is conceivable that some specificities of intracellular trafficking and/or degradation of TM536 or plasma clearance of sTM536 may contribute secondarily to the increased sTM536 concentrations.
We have shown that the ER chaperone/UPR regulator HSPA5 binds to the IMD of sTM536 and detected the TM-HSPA5 complex in the plasma of TM536 patients. Such an interaction indicates the presence of sTM536 in the ER lumen. HSPA5 binds to hydrophobic patches in misfolded proteins,32 so its interaction with the IMD of sTM536 in the ER is not surprising. A limited number of situations in which HSPA5 is secreted have been documented.33 We propose that the ER retention sequence of HSPA5 is masked during its interaction with TM536, allowing the HSPA5-TM536 complex to be secreted.
Unlike TMWT, TM536 is not contained in lipid rafts. However, this specific membrane distribution does not explain its high release. Indeed, TM539 (with the whole IMD but without the cytoplasmic tail) is not present in lipid rafts and yet is not released from cells.
Overexpressed soluble forms of TM have been shown to be more CS-modified than transmembrane TM.34 Our results further demonstrate that the proportion of sTM with CS depends on the release mechanism: conventionally secreted TMFS is more CS-modified than full-length sTM536, which has escaped from the ER membrane. The presence of CS moiety in TM enhances its binding to FIIa.28 In line with this, we show that the absence of CS decreases the ability of sTM to support in vitro PC activation. With regard to natural soluble TM variants, TMFS, which is more CS-modified than TM536, is also more effective in PC activation.
Our results demonstrate that TM536-expressing cells expose less TM on their surface than TMWT-expressing cells, in agreement with previous data showing reduced TM expression in the vessels of ovarian tissue from a TM536 patient.20 The low TM expression on the HUVEC536 surface is consistent with the reduced PC activation measured on these cells. Furthermore, the localization of TM in lipid rafts likely has an effect on its efficacy as a cofactor in PC activation. Indeed, lipid raft disruption increases PC activation in TMWT-expressing cells but not in cells expressing TM excluded from lipid rafts. Consequently, it is likely that the anticoagulant potential of TM536-expressing cells is not optimal.
The exclusion of TM536 from lipid rafts could have consequences beyond coagulation. Indeed, TMWT, EPCR, and protease-activated receptor 1 (PAR-1) have been colocalized in lipid rafts of the endothelial cell plasma membrane.5 In these membrane microdomains, the TM-FII complex activates EPCR-bound PC, leading to PAR-1 activation and triggering cytoprotective signaling. Consequently, TM536, which is excluded from lipid rafts, would not be optimally effective in triggering PAR-1-dependent cytoprotective signaling.
The low TM expression on the surface of TM536-expressing cells is probably only partially attributable to the high release of TM536. Indeed, as expected for an aberrant protein, TM536 is highly degraded by ERAD, which may contribute to its low cell-surface expression. However, the release of sTM536 associated with HSPA5 indicates that a substantial amount of this protein still escapes ERAD.
Interestingly, the release of overexpressed TM536 is reduced by CL, an aminosterol previously shown to promote ERAD processes.27 This finding proposes ERAD activation as an approach to reduce sTM release in TM536 patients. The possibility of activating ERAD (mainly using proteasome activators) to degrade misfolded proteins to restore protein homeostasis is still at an exploratory stage and has been tested almost exclusively in the context of neurodegenerative diseases.35,36
In summary, our study demonstrates that TM536 is inserted into the ER membrane. A fraction of TM536 follows the conventional trafficking pathway as a membrane-inserted protein and is exposed at the cell surface with an abnormal plasma membrane localization (outside lipid rafts). Another fraction extracts from the ER membrane. Part of this fraction is degraded by ERAD. The remaining fraction follows a conventional secretory pathway and is released into the extracellular environment. Activation of ERAD by CL reduces the proportion of TM536 released by the cells. Additionally, cells expressing TM536 exhibit reduced surface expression of TM, which impairs their ability to support the FIIa-dependent activation of PC.
Acknowledgments
The authors thank Karim Fallague (Aix-Marseille University, INSERM, INRAE, C2VN, Marseille, France) for isolating human umbilical venous endothelial cells. The expression vectors for wild-type thrombomodulin, active and inactive RHBDL2, and EPCR were provided by Y. Dargaud (Claude Bernard University, Lyon, France), M. Freeman (Sir William Dunn School of Pathology, University of Oxford, Oxford, United Kingdom), and L. Mosnier (Department of Molecular Medicine, Scripps Research, La Jolla, California), respectively.
This work was supported by INSERM and the Aix Marseille University.
Authorship
Contribution: C.B., A.P., and C.R. performed most of the experiments; N.H. performed thrombin generation measurement; V.E. and C.F. were in charge of patient care; S.S. performed endothelial colony forming cells isolation and culture; R.L. performed the analysis of thrombomodulin on plasma microvesicles; P.-E.M. was involved in patient management and manuscript preparation; and F.P. designed the study, supervised the work, analyzed the data, and wrote the manuscript.
Conflict-of-interest disclosure: The authors declare no competing financial interests.
Correspondence: Franck Peiretti, Aix-Marseille University, INSERM1263, Center for CardioVascular and Nutrition Research, C2VN, Faculté de Médecine Timone, 27 Bd Jean Moulin, Marseille 13385, France; email: franck.peiretti@univ-amu.fr.
References
Author notes
Data are available on request from the corresponding author, Franck Peiretti (franck.peiretti@univ-amu.fr).
The full-text version of this article contains a data supplement.

