Key Points
Genomic analysis of MF identifies alterations associated with high risk of progression and shorter overall survival.
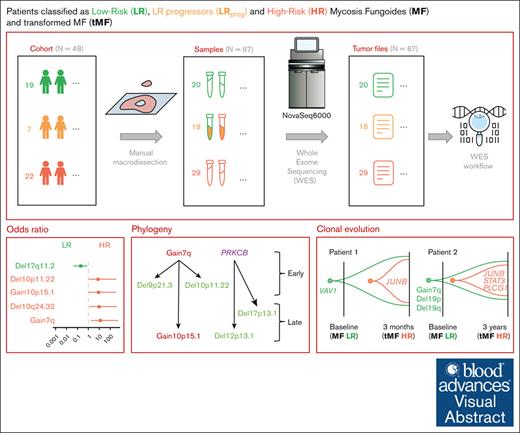
Clonal evolution of MF shows acquisition of JUNB, gain of 10p15.1 (IL2RA/IL15RA), or del12p13.1 (CDKN1B) at progression.
Visual Abstract
Mycosis fungoides (MF) is the most prevalent primary cutaneous T-cell lymphoma, with an indolent or aggressive course and poor survival. The pathogenesis of MF remains unclear, and prognostic factors in the early stages are not well established. Here, we characterized the most recurrent genomic alterations using whole-exome sequencing of 67 samples from 48 patients from Lille University Hospital (France), including 18 sequential samples drawn across stages of the malignancy. Genomic data were analyzed on the Broad Institute’s Terra bioinformatics platform. We found that gain7q, gain10p15.1 (IL2RA and IL15RA), del10p11.22 (ZEB1), or mutations in JUNB and TET2 are associated with high-risk disease stages. Furthermore, gain7q, gain10p15.1 (IL2RA and IL15RA), del10p11.22 (ZEB1), and del6q16.3 (TNFAIP3) are coupled with shorter survival. Del6q16.3 (TNFAIP3) was a risk factor for progression in patients at low risk. By analyzing the clonal heterogeneity and the clonal evolution of the cohort, we defined different phylogenetic pathways of the disease with acquisition of JUNB, gain10p15.1 (IL2RA and IL15RA), or del12p13.1 (CDKN1B) at progression. These results establish the genomics and clonality of MF and identify potential patients at risk of progression, independent of their clinical stage.
Introduction
Primary cutaneous T-cell lymphoma (CTCL) is a clinically heterogeneous group of incurable extranodal lymphomas that target skin-resident mature T cells. Mycosis fungoides (MF) is the most common CTCL, accounting for >50% of all cases.1 It typically exhibits an indolent disease course with slow progression over several years, and patients present with a wide range of clinical symptoms and disease outcomes.2 In the early stages, MF generally manifests as erythematous macules and plaques, which are nonspecific lesions that are difficult to diagnose. Patients may progress from low-risk (LR) clinical stages (tumor-node-metastasis-blood [TNMB] classification system IA to IIA) to high-risk (HR) stages (TNMB IIB to IVB), which involve tumors or generalized erythroderma.2,3 At the cellular level, ∼20% of patients with HR show histological transformation with transformed MF cells, a feature associated with poor prognosis.4-6 Transformation is defined by the presence of >25% large cells (immunoblasts, large pleomorphic cells, or large anaplastic cells), which may or may not express CD30 within the infiltrate of the MF lesion.5 At the molecular level, MF is genetically heterogeneous, with no uniform single nucleotide variants (SNVs) and somatic copy number alterations (SCNAs). Previous microarray gene expression profiling studies of CTCLs, particularly MF, revealed deregulated expression of TP53, PLCG1,7,8 and TNFR29 and deletions of the JAK-STAT signaling inhibitors SOCS1 and HNRNPK.10 Upon histological transformation, loss of chromosomal region 9p21.3, in which the tumor suppressors CDKN2A and CDKN2B reside, is commonly observed.10-13
Nevertheless, the molecular underpinnings of disease progression in patients with MF have not been extensively studied; thus, clinicians rely on suboptimal clinical variables for risk stratification. To identify the molecular drivers of disease progression and aggressiveness, which may help improve clinical practice, we collected samples from patients with MF at different stages of the disease and performed deep whole-exome sequencing (WES) for the detection of somatic events. Specifically, we sequenced DNA from 67 skin samples obtained from 48 patients, including 18 sequential samples from patients who exhibited progression from LR to HR stages. This approach allowed for us to characterize the genomic landscape of MF across the stages of progression, identify putative driver genes contributing to the progression of patients with LR, and study the clonal evolution of tumor cells during MF progression. Overall, this study provides new insights into the genetic risk factors of disease progression in patients with MF, which may help improve clinical prognostication models and lead to the discovery of novel therapeutic approaches for patients with MF. Although these findings identify patients with a HR of progression, further validation in independent cohorts is needed to confirm their clinical utility.
Methods
Patient samples
We studied 67 tumor samples from a cohort of 48 patients diagnosed with MF at the Lille University Hospital between 2003 and 2017. All cases were reviewed by local specialists from the French Study Group on Cutaneous Lymphomas Network. Immunohistochemistry was performed using the following panel: CD20, PAX5, CD2, CD3, CD4, CD5, CD7, CD8, CD30, PD1, and Ki-67. Another immunohistochemistry analysis of CD25 was performed in patient samples with or without gain10p15.1. The diagnosis of MF was confirmed by polymerase chain reaction to detect clonal recombination of the T-cell receptor gene. We defined 2 prognostic groups: the LR group with TNMB stages IA, IB, and IIA and the HR group with either high TNMB stage (IIB, III, and IV) or transformed histology. Samples were extracted from 67 frozen skin biopsy samples stored in the Biology-Pathology-Genetics unit’s tumor bank (certification NF 96900-2014/65453-1). After macrodissection of the tumors, the percentage of tumor cells was visually estimated by microscopic observation. In total, the cohort included 67 tumor samples from 48 patients. For 13 of these patients, sequential samples were collected at different stages of disease progression. This study was approved by the Institutional Review Board of Lille University Hospital and Nord Ouest IV (protocol number: ECH18/03) in accordance with the Declaration of Helsinki, and all patients provided written informed consent.
DNA quality control and WES
The amount of extracted DNA was determined by spectrophotometry using the "Quant-iT Picogreen dsDNA Assay" kit (Thermo Fisher Scientific). For WES, 100 ng of genomic DNA was fragmented on the Covaris ultrasonicator to target a base pair peak of ∼150 to 200 bp. DNA libraries were prepared using the Agilent SureSelect XT low input kit with target region capture using Agilent SureSelect Human All Exon V7 (Agilent Technologies) and the Illumina Dual-Index Adapter primer kit (Illumina). Libraries were generated in an automated manner using the Bravo NGS liquid handling robot in accordance with the supplier’s recommendations. The final libraries were assessed using the Agilent High Sensitivity DNA Analysis kit on the Bioanalyzer 2100 and quantified by quantitative polymerase chain reaction using the Kapa Library Quantification kit (Roche). Libraries were pooled and sequenced using 2 × 100 bp paired-end reads on an Illumina NovaSeq 6000 platform on a S4 flowcell.
Alignment and quality control
Data were analyzed on the Terra computing platform (Broad Institute [BI], Cambridge, MA), which aggregates bioinformatics tools for genomic data analysis. The quality of the raw sequencing output in fastq format was obtained using FastQC14 software and visualized at the whole-cohort level with MultiQC.15 Illumina primers, very small reads (< 30 bp), and poor quality reads were removed with CutAdapt.16 Sequences were aligned with BWA-MEM,17 and alignment quality was estimated using Picard software suite tools. Postalignment cleanup consisted of the removal of duplicate reads with MarkDuplicate18 (Picard, BI), local realignment around insertion-deletions (InDels) with IndelRealigner, and base quality recalibration with BaseRecalibrator and ApplyBQSR.19 During sample preparation in the laboratory, there were risks of contamination or inversion, which were checked with CalculateContamination20 and CrossCheckLaneFingerprints,18 respectively, and no errors were identified. Finally, the potential oxidation of guanine to 8-oxoguanine artifacts that can occur during the preparation of genomic libraries under the combined effect of heat, DNA cutting, and the introduction of metal contaminants were removed with CollectOxoGMetrics.18 Overall, tumor samples meeting all quality control cutoffs had an average coverage of 99.72% on the GRCh37 assembly, with a mean target depth of coverage of 231.85×.
Copy number analysis from WES data
SCNAs and genome-wide allelic variations were detected using ModelSegments20 software. To summarize, the software will use the panel of normal (PoN) of 13 samples to detect copy and allele number variations in each tumor sample and model several segments. The software was run in Tumor-Only mode for the entire set of samples and run again in “Matched-Normal” mode for the 3 tumor samples that had an associated normal sample. Frequent large and focal SCNAs in the cohort were highlighted by GISTIC2.021 using a q-value threshold of 0.01.
Mutation calling of recurrently mutated genes
SNVs and InDels were detected using a Bioinformatics Cancer Genome Analysis (CGA) pipeline called “CGA WES Characterization Pipeline.” SNVs were detected by MuTect22 and InDels by Strelka23 and Mutect224. The results of these 3 software programs were then filtered using MAFPoNFilter25. The latter uses 2 PoNs to segregate somatic from germ line variants: the 1 from our cohort (from 13 WES normal samples) and the controlled access PoN used in the routine analysis of the BI (8334 normal samples from The Cancer Genome Atlas Program database). Somatic variants (SNVs and InDels) were annotated for their oncogenic effect using Variant Effect Predictor26 and Oncotator.27 They were then validated using the MutationValidator tool, which establishes the minimum number of reads carrying the variant for it to be considered somatic. Genes more frequently mutated than chance were determined using MutSig2CV25. Variants carried by genes known to be “fishy genes,” that is, known false-positive genes that are not plausible in the development of cancers, were manually removed according to the list established by Lawrence et al in 2013.28
Panel of normal
In addition to the 3 normal samples from our cohort, 10 additional human blood samples were provided by the Research Blood Component (Watertown, MA). These 13 samples formed a PoN to filter out possible errors during the preparation or sequencing steps, as well as germ line genetic/genomic events. As a final criterion to filter potential germ line variants, we used bash scripts to count the occurrence of mutated variants in our cohort of PoN samples in the fastq format. First, we converted the maf file into a 2-motive list per variant, consisting of 11 nucleotides before and after the variant. The first motive represented the wildtype, corresponding to the reference variant, whereas the second one was the mutated form, representing the alternative variant. Subsequently, we used the “do_it.sh” bash script from the GitHub repository mafouille/HotCount to count the number of occurrences of both wildtype and mutated motives in the PoN. Variants with mutated patterns that appeared more than once in the PoN were excluded. This additional check not only reveals supplementary potential artifacts but also modulates the stringency of the filtering process, complementing the PoN in the pipeline.
Estimation of purity, ploidy, and CCF
ABSOLUTE29 software determined the purity and ploidy of each sample from the SNVs and SCNAs (supplemental Table 10) and thus served us to define the cancer cell fraction (CCF) of each genomic alteration. For tumor samples without associated normal samples, we applied a tumor-only Germline Somatic Log odds filter, as described by Chapuy et al in 2018.30 To summarize, for each variant, its CCF, sample ploidy and purity, and local copy number (CN) were used to calculate the probability that the allelic fraction of the variant was consistent with a modeled allelic fraction for either a germ line or somatic hypothetical event. Thus, the filter set a threshold for each sample to remove additional germ line variants. To eliminate additional germ line events, we set the tumor-only threshold to –1.
GnomAD filtering
We used the genome aggregation database gnomAD to exclude potential germ line mutations. The Human Genome Variation Society genomic identifier (HGVS_genomic_change column in maf file) was used in the VEP GRCH37 Ensembl database to obtain gnomAD allele frequency. A cutoff value of 0.0001 was applied.
Statistical analysis
Time-to-event end points were estimated using the Kaplan-Meier method. Differences in the survival curves were assessed using the log-rank test. The median follow-up was calculated using the reverse Kaplan-Meier method. Time to progression was measured from the date of diagnosis to the date of documented progression to HR. Cox proportional hazards modeling was performed to assess the impact of genetic alterations on the risk of disease progression. Violin plot conditions were compared using the nonparametric Wilcoxon test. Figures and statistical estimations were obtained using R v.3.6.3 and MATLAB. The maf files were analyzed using the R package “maftools” v2.12.05 with oncoplot (waterfall plot, Figure 1A), maf_compare (forest plot, Figure 2A), and somaticInteractions (corrplot, Figure 3B) functions. The maf_compare function performs a Fisher test on all genes between the LR and HR cohorts to detect differentially mutated SNVs/SCNAs. In the generated forest plot, events with a low frequency of less than ∼20% (ie, 9 patients) were not analyzed (Figure 2A). Other figures were generated using the R packages v3.4.0 “survival” v3.4-0 and “survminer” v0.4.9. (Kaplan-Meier graphs, Figure 2), and “chrisamiller/fishplot” v0.5.1 (Fishplots, Figure 4) and ggplot2.
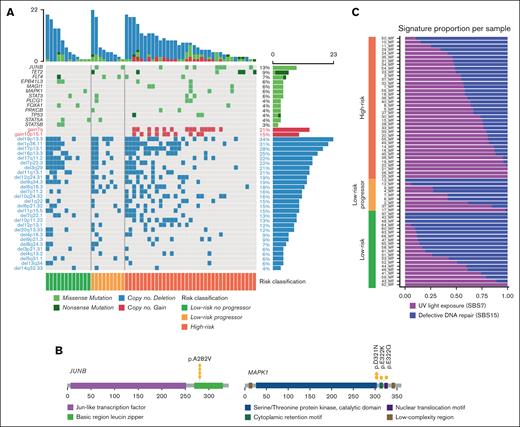
Landscape of most recurrent genomic alterations in MF. (A) Landscape of genomic alterations in 67 tumor samples of MF divided into LR and HR disease based on the TNMB stages. Alterations are divided into SNVs and SCNAs. (B) Driver oncogene maps of JUNB and MAPK1. (C) Relative enrichment of signature activities per samples divided into LR, LR progressors, and HR.
Landscape of most recurrent genomic alterations in MF. (A) Landscape of genomic alterations in 67 tumor samples of MF divided into LR and HR disease based on the TNMB stages. Alterations are divided into SNVs and SCNAs. (B) Driver oncogene maps of JUNB and MAPK1. (C) Relative enrichment of signature activities per samples divided into LR, LR progressors, and HR.
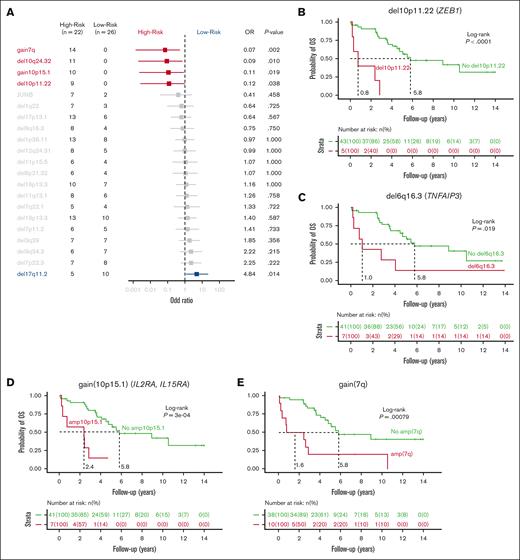
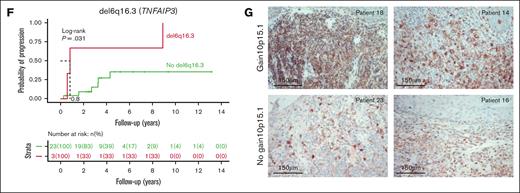
Correlation of genomic events to the disease stage. (A) Forest plot showing the association between individual genes alteration and clinical stage of MF divided into LR and HR, as depicted by OR. (B-E) Kaplan-Meier plots of individual genetic factors predictive of OS in univariate and multivariate models of 48 patients with a newly diagnosed MF: del10p11.22 (B); gain of 10p15.1 (C); gain of 7q (D); and del6q16.3 (E). (F) Kaplan-Meier curves for analysis of time to progression in patients with LR disease. P values were derived from log-rank test. (G) CD25 immunohistochemistry at diagnosis of MF skin biopsies in patients with gain of 10p15.1 (top panels, MF sample of patient 18 and patient 14 with presence of transformed MF cells) or without gain of 10p15.1 (bottom panels, MF sample of patient 23 and patient 16). Scale bars indicate 150 μm.
Correlation of genomic events to the disease stage. (A) Forest plot showing the association between individual genes alteration and clinical stage of MF divided into LR and HR, as depicted by OR. (B-E) Kaplan-Meier plots of individual genetic factors predictive of OS in univariate and multivariate models of 48 patients with a newly diagnosed MF: del10p11.22 (B); gain of 10p15.1 (C); gain of 7q (D); and del6q16.3 (E). (F) Kaplan-Meier curves for analysis of time to progression in patients with LR disease. P values were derived from log-rank test. (G) CD25 immunohistochemistry at diagnosis of MF skin biopsies in patients with gain of 10p15.1 (top panels, MF sample of patient 18 and patient 14 with presence of transformed MF cells) or without gain of 10p15.1 (bottom panels, MF sample of patient 23 and patient 16). Scale bars indicate 150 μm.
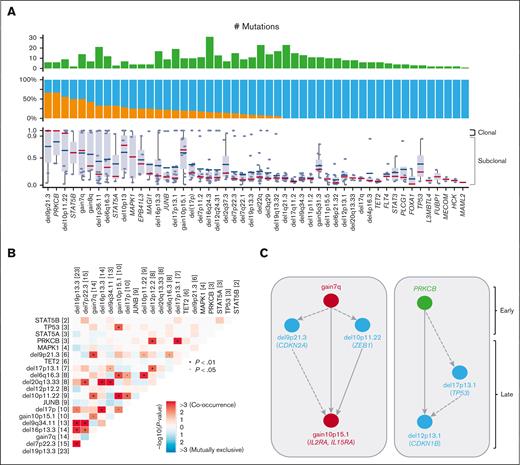
Clonal heterogeneity and inferred timing of genetic drivers. (A) Proportion in which recurrent drivers are found as clonal or subclonal across the 67 samples (top), along with the individual CCF values for each sample affected by a driver (bottom). Median CCF values are shown (bottom, bars represent the median and interquartile range for each driver). (B) Correlation matrix for the most recurrent genomic alterations for the 48 patients with MF, with Fisher exact test to detect such significant pair of mutations. (C) Timing of genomic alterations with early events at top and late events at bottom. Color indicates alteration types. Arrows between 2 alterations were drawn when 2 drivers were found in 1 sample with an excess of clonal to subclonal events. Dashed arrows indicate 1 clonal-subclonal pair and solid arrows indicate ≥2 clonal-subclonal pairs.
Clonal heterogeneity and inferred timing of genetic drivers. (A) Proportion in which recurrent drivers are found as clonal or subclonal across the 67 samples (top), along with the individual CCF values for each sample affected by a driver (bottom). Median CCF values are shown (bottom, bars represent the median and interquartile range for each driver). (B) Correlation matrix for the most recurrent genomic alterations for the 48 patients with MF, with Fisher exact test to detect such significant pair of mutations. (C) Timing of genomic alterations with early events at top and late events at bottom. Color indicates alteration types. Arrows between 2 alterations were drawn when 2 drivers were found in 1 sample with an excess of clonal to subclonal events. Dashed arrows indicate 1 clonal-subclonal pair and solid arrows indicate ≥2 clonal-subclonal pairs.
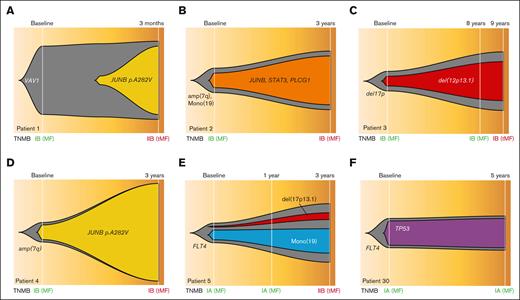
Clonal evolution of sequential samples. (A-E) Fish plots of 5 serial cases of MF with samples at LR stages who progressed to HR stages. (F) One serial case with both time points at LR stage because the patient did not progress. TNMB classification has been indicated (green for LR and dark red for HR samples). tMF, transformed MF.
Clonal evolution of sequential samples. (A-E) Fish plots of 5 serial cases of MF with samples at LR stages who progressed to HR stages. (F) One serial case with both time points at LR stage because the patient did not progress. TNMB classification has been indicated (green for LR and dark red for HR samples). tMF, transformed MF.
This study was approved by the Institutional Review Board of Lille University Hospital and Nord Ouest IV (protocol number: ECH18/03) in accordance with the Declaration of Helsinki, and all patients provided written informed consent.
Results
Genomic landscape of MF
The median age in our cohort was 62.5 years (range, 19-94), with a 60% male predominance, which is consistent with the known distribution of MF in the population.2 Patients were stratified based on the TNMB classification into LR (stage IA, IB, or IIA) and HR (stages IIB to IVB) (supplemental Figure 1A-D; supplemental Tables 1 and 7). We detected mutations by WES and analyzed 67 tumor samples from 48 patients, using a validated pipeline to filter germ line variants and artifacts from tumor-only samples30 (Methods; supplemental Figures 1 and 2). Thirteen patients had sequential sampling (supplemental Figure 1C-D).
We found a median of 3.5 mutations per Mb, corresponding to a median of 135 SNVs or insertion-deletions (InDels) per sample. The most recurrently mutated genes comprise previously reported mutational drivers in TCL, and 51% of patients had a mutation in at least 1 of these drivers (Figure 1A). These included the T-cell differentiation transcription factor JUNB (p.A282V; Figure 1B) in 13% of the cases31-34; the epigenetic factor TET2 in 9% of the cases35-38; the component of the MAPK pathway MAPK1 in 6% of the cases (Figure 1B); the transcription factor FOXA1 involved in interferon signaling and immune response suppression37,39; the tyrosine kinase receptor FLT4; the phospholipase PLCG1 involved in NF-κB and NFAT signaling7,40; the JAK/STAT signaling pathway factors STAT3, STAT5A, and STAT5B; and TP53 (Figure 1A; supplemental Figure 4; supplemental Table 2).
Next, we identified significantly recurrent SCNAs by using GISTIC2.0.21 Overall, SCNAs were the most common genomic alterations and were present in 84% of cases (Figure 1A). Specifically, we detected significantly recurrent alterations, including 8 arm-level and 29 focal copy number losses, as well as 2 arm-level and 1 focal copy gains (q-value ≤ 0.1; supplemental Figures 3A-B; supplemental Table 11). The frequencies of these SCNAs ranged from 6% to 57%, and the number of genes in the focal peaks varied from 1 (MUC12 in del7q22.1) to 576 (del6p21.33) (supplemental Tables 12 and 13). In the focal CN gain10p15.1 (26 genes; frequency of 13%) resides interleukin-2 receptor alpha and interleukin-15 receptor alpha (IL2RA and IL15RA) as well as the NF-κB pathway protein kinase PRKCQ. In particular, IL2RA and IL15RA play crucial roles in the phosphorylation of STAT3 and STAT5 in the JAK-STAT pathway, likely contributing to the pathogenesis of MF.41-43 Among the tumor suppressor genes affected by the most frequent CN loss were TMEM259 (19p13.3, frequency 57%), TP53 (17p13.1, 41%), SUZ12 and NF1 (17q11.2, 33%), NOTCH1 (9q34.3, 26%), CARD11 (7p22.3, 24%), ZEB1 (10p11.22, 17%), TNFAIP3 (6q16.3, 15%), CDKN2A (9p21.3, 11%), and CDKN1B (12p12.2, 9%).
Mutational processes produce distinctive footprints called mutational signatures in the cancer genome that capture both DNA damages and repair mechanisms. We applied SignatureAnalyzer,44 a tool that uses both the 3-bases mutational sequence context and the clustering of the mutation in the genome to define specific COSMIC (Catalogue of Somatic Mutations in Cancer database) single base substitution (SBS) signatures. Here, we detected 2 primary mutational signatures: the UV light exposure signature SBS7 and the defective DNA repair signature SBS15 (supplemental Figures 5A-B and E; supplemental Table 8). The age-related deamination signature, SBS1, was also frequently observed in our cohort but was not sufficiently prevalent to be separated from the UV signature. The enrichment of the SBS7 signature is consistent with previous studies on CTCL32,45,46 and was also significantly associated with HR, suggesting a role of UV radiation in the progression of MF. It is also possible that HR tumors are phylogenically older and have more time to accumulate drivers and UV signature (Figure 1C). Additionally, there was an association between the total number of mutations and SBS7 signature (Wilcoxon test; P = 5.735e-12). Signature SBS15 is 1 of the 7 mutational signatures related to defective DNA mismatch repair and microsatellite instability that are found in different cancer types. The contribution of SBS15 was similar in the LR and HR samples, suggesting a more founder event (supplemental Figure 5G). Next, we determined the relative contribution of SBS7 and SBS15 signatures to the mutational burden of driver genes (supplemental Figure 5E). Five genes were enriched with mutations associated with SBS15, including JUNB, STAT3, MAML2, FLT4, and FOXA1, whereas 9 genes were predominantly associated with SBS7, including TET2, MAPK1, TP53, EPB41L3, MAGI1, PRKCB, HCK, L3MBTL4, and MECOM.
Association of genetic features to disease stage and outcome
We further compared the genomic profiles of patients with LR disease with those of patients with HR disease (supplemental Tables 3-6 and 9). All CN gain7q (odds ratio [OR], 0.07; P = .002) and gain10p15.1 (IL2RA and IL15RA; OR, 0.11; P = .019) were found in patients at HR, as were del10q24.32 (NFKB2; OR, 0.09; P = .010) and del10p11.22 (ZEB1; OR, 0.12; P = .038; Figure 2A). Conversely, del17q11.2 (SUZ12 and NF1) was significantly associated with LR (OR, 4.84; P = .014). We observed a higher mutation rate in HR samples, with a median of 3.95 mutations per Mb compared with 3.02 mutations per Mb in LR samples (P = .019) (supplemental Figure 5F). The increased mutation rate in HR was predominantly associated with the UV light exposure signature SBS7, suggesting either its role in disease progression or else reflecting time and addition of drivers (Figure 1C; supplemental Figure 5G).
Next, we assessed the impact of putative driver mutations at diagnosis on overall survival (OS) in patients with a median follow-up time of 4.3 years (range, 0.3-14). In total, 4 SCNAs were significantly associated with shorter OS, (Figure 2B-E): del10p11.22 (ZEB1; median OS [mOS] of 2.4 vs 8.9 years; P = .00029); gain10p15.1 (IL2RA and IL15RA; mOS of 2.4 vs 5.8 years; P = .00029); gain7q arm (mOS of 2.6 vs 8.9 years; P = .011); and del6q16.3 (TNFAIP3; mOS, 1.9 vs 5.8 years; P = .021). Furthermore, the presence of del10p11.22, gain10p15.1, and del6q16.3 remained a significant risk factor in a multivariate stepwise analysis, accounting for the patient’s clinical stage (supplemental Figures 5C-D). Notably, no SNVs were shown to affect OS. In the LR group, 7 patients progressed, and 19 did not progress during follow-up. Patients with LR disease and del6q16.3 (TNFAIP3) had shorter time to progression (median, 0.8 years vs not reached; P = .0031; Figure 2F). This alteration is present in 15% of patients with LR at diagnosis and could serve as a prognostic marker in clinical practice for future publication with a validation cohort.
Regarding gain10p15.1, we observed a higher expression of CD25 by immunohistochemistry in samples from patients with gain10p15.1 than those of patients without gain10p15.1. This is consistent with a link between gain of IL2RA and the surface expression of CD25, suggesting a role of IL2/IL2RA signaling in the disease progression (Figure 2G).
The clonal architecture and phylogeny of MF
Next, we estimated the CCF for each putative driver and determined whether the alterations were clonal (≥0.9) or subclonal (<0.9). We observed heterogeneity in the clonality of genomic alterations in patients with MF. Certain alterations were frequently clonal, such as del9p21.3 (CDKN2A), del10p11.22 (ZEB1), gain7q, and mutations in PRKCB or STAT5B. Other alterations were more frequently subclonal, such as mutations in TET2, TP53, PLCG1, or del17p, which likely represent later events in the disease course (Figure 3A).
Subsequently, we analyzed the co-occurrence of driver genes and SCNAs. We found that del9p21.3 (CDKN2A) significantly co-occurred with gain7q and del10p11.22 (ZEB1). Gain10p15.1 (IL2RA and IL15RA) was significantly cosegregated with del6q16.3 (TNFAIP3) and TP53 mutations. Del16p13.3 (CREBBP) co-occurred with del17p and de19p13.3 (TMEM259; Figure 3B). We applied a mutation-ordering method to samples with pairs of clonal and subclonal alterations.47 Given that clonal mutations occur before subclonal events, we defined the timing of the main genetic alterations. We observed 2 general patterns defining the phylogeny of the disease (Figure 3C): first, clonal gain7q that often co-occurs with clonal del9p21.3 (CDKN2A) or del10p11.22 (ZEB1), with further acquisition of gain10p15.1 (IL2RA and IL15RA) at progression; second, the clonal mutation of the tyrosine kinase PRKCB followed by del17p13.1 (TP53) and del12p12.1 (CDKN1B). Of note, gain7q and del10p11.22 (ZEB1) are often clonal and associated with an unfavorable outcome suggesting that the molecular path to aggressiveness is made at an early stage of the disease. Gain10p15.1 (IL2RA and IL15RA), which is also associated with HR, represents a transforming molecular event in the disease course.
We further analyzed sequential samples from 7 patients who progressed from early stages (LR progressors) to advanced stages of the disease, with sampling intervals ranging from 3 months to 9 years. We observed evidence of clonal heterogeneity at diagnosis in all 7 cases, indicating that clonal branching had already occurred at the early stage of the disease. Moreover, we noticed cases in which subclones that were initially small at diagnosis exhibited substantial expansion at a later time point, indicating a strong driver potential for their mutations/SCNAs. Specifically, this was observed in 3 patients with small subclones harboring the JUNB mutation or del12p13.1 (CDKN1B), which were selected for and became dominant at disease progression (Figure 4B-D). In these cases, all alterations detected in late-stage samples were already present at the baseline, pointing to a linear pattern of clonal evolution. In another instance, however, a JUNB-mutant subclone was first identified at the time of disease progression, suggesting that further branching had occurred and drove the progression from LR to HR disease (Figure 4A). In this case, the JUNB mutation was acquired on top of a clonal VAV1 mutation, involved in T-cell receptor signaling, and has been reported in various T-cell malignancies (Figure 5). Clonal evolution was also observed during treatment, with the expansion of a resistant del17p13.1 subclone in a patient receiving multiple lines of treatment within 3 years of disease progression (Figure 4E). Finally, in a patient who did not progress and whose 2 samples were sequenced at the LR stage but 5 years apart, no new alterations or increases in the CCF of baseline mutations were noticed at the later time point, implying that clonal heterogeneity at baseline may not be sufficient for disease progression (Figure 4F).
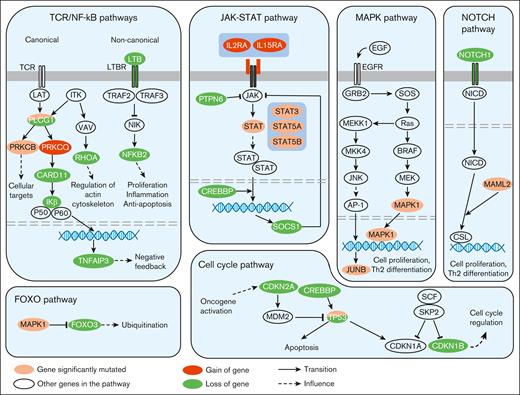
Recurrent genetic alterations affecting key signaling pathways involved in MF. In this diagram, frequently mutated genes with well-established roles in these signaling pathways have been depicted representing the proteins they encode. TCR, T-Cell Receptor.
Recurrent genetic alterations affecting key signaling pathways involved in MF. In this diagram, frequently mutated genes with well-established roles in these signaling pathways have been depicted representing the proteins they encode. TCR, T-Cell Receptor.
Discussion
In this study, we leveraged WES data to analyze tumor samples from 48 patients with newly diagnosed MF, together with sequential samples at later time points from 13 patients. We analyzed the most recurrent genomic alterations, as well as their clonal heterogeneity and clonal evolution, to temporally order these alterations and gain insight into the phylogeny of MF. Our results highlight the complexity of MF, with a median of 135 different genomic alterations per tumor. The most recurrent alterations in MF were consistent with previous observations in TCL in general9,32,36,38,48,49 (MF, Sézary syndrome, primary cutaneous CD30+ T-cell lymphoproliferative disorders, and primary cutaneous γδ T-cell lymphoma), with alterations in the NF-κB pathway (such as deletion NFKB2 in 10q24.32, gain of PRKCQ in 10p15.1, mutation of PRCKB, and deletion of CARD11 in 7p22.3), JAK/STAT pathway (eg, gain of IL2RA and IL15RA in 10p15.1, and mutations in STAT3, STAT5A and STAT5B), MAPK pathway (mutations in JUNB and MAPK1), cell cycle pathway (such as deletion CDKN1B in 12p13.1 and CDKN2A in 9p21.3), and inhibition of apoptosis (deletion and mutations of TP53 and deletion of TNFAIP3 in 6p16.3; Figure 5).
We identified genomic alterations that are associated with HR stages of the disease: gain7q and gain10p15.1 (IL2RA and IL15RA), del10q24.32 (NFKB2), and del10p11.22 (ZEB1), suggesting their role in disease progression. Conversely, del17q11.2 (SUZ12 and NF1) was associated with the LR stages of the disease. The mutational signature SBS7, associated with UV light, was also associated with HR stages and was enriched in the mutational process of genes such as TET2, MAPK1, TP53, and PRKCB. We also describe the different patterns of phylogeny of MF, with early events such as gain7q or mutations in PRCKB and further acquisition of alterations such as gain10p15.1 (IL2RA and IL15RA), del17p13.1(TP53), or del12p13.1 (CDKN1B). This clonal evolution from the LR to HR stages was either linear or branched, with the selection of subclones with strong driving potential.
We also assessed the prognostic value of these genomic alterations during diagnosis. We found 4 SCNAs that were significantly associated with a shorter OS: del10p11.22 (ZEB1), gain10p15.1 (IL2RA, IL15RA), gain7q, and del6q16.3 (TNFAIP3). The identification of these HR genomic alterations can help in the clinical management of MF. Early focal lesions of MF are sometimes difficult to diagnose and histologically differentiate from eczematous or psoriasis dermatitis.50 Specific genomic alterations associated with adverse outcomes can help to guide the diagnosis of MF. Our data illustrate the role of gain10p15.1 (IL2RA and IL15RA) in disease progression. Taken together, these genomic alterations represent potential early indicators that may be useful for MF prognostication but require validation in future studies. This can be therapeutically relevant, because cytokine inhibitors such as bnz-1 are currently being tested in clinical trials.
In conclusion, sequencing a large cohort of patients with MF, including sequential samples, has allowed for us to understand the genomic complexity of MF, temporal ordering of genetic events, and biomarkers that are associated with HR and disease progression. We believe that introducing NGS evaluation at the time of MF diagnosis can improve the identification of patients at a HR of disease progression and their clinical management.
Acknowledgments
This study was supported by a grant from the GEFLUC Flandres Artois Foundation to (S. Manier). The authors acknowledge the Tumorothèque of CHU Lille, the Société Française d’Hématologie, and the I-SITE ULNE foundation for their assistance with this project.
Authorship
Contribution: L.F., I.A., and S. Manier contributed in conceptualization, methodology, and writing including original draft and visualization; L.F., R.S.-P., C. Stewart and M.F. contributed in software; L.F., I.A, A.K.D., R.S.-P., C. Stewart, E.C., M.F, S. Mitra, G.G, I.M.G., and S. Manier contributed in formal analysis; L.F., I.A., A.K.D., L.H.B.I., and S. Manier contributed in investigation; I.A., R.D., S.P., M.-C.C., S.J., M.N., A.O.-O., S.F., O.C., L.M., M.F, T.I., F.M., G.G, I.M.G, and S. Manier contributed in resources; R.D. contributed in validation; L.F. and S. Manier contributed in data curation; all authors contributed in reviewing and editing; G.G, I.M.G., and S. Manier supervised the research; and S. Manier contributed in funding acquisition.
Conflict-of-interest disclosure: The authors declare no competing financial interests.
Correspondence: Salomon Manier, CHU Lille, Hospital Huriez, Rue Michel Polonovski, Lille 59000, France; email: salomon.manier@inserm.fr/ salomon.manier@chu-lille.fr.
References
Author notes
L.F., I.A., and A.K.D. contributed equally to this study.
The WES samples used in this study were deposited in the SRA database (https://www.ncbi.nlm.nih.gov/sra; accession number: PRJNA925900).
Deidentified individual participant data are included as supplements in the online version of this article. Other data are available upon request from the corresponding author, Salomon Manier (salomon.manier@chu-lille.fr).
The full-text version of this article contains a data supplement.

