Key Points
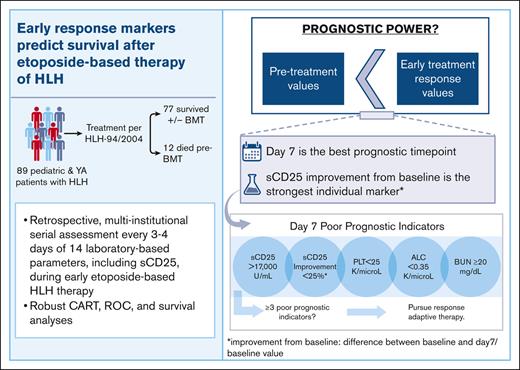
Serial monitoring of sCD25 during etoposide-based therapy of HLH provides the most potent single predictor of pre-BMT mortality.
Response to therapy by day 7 optimally predicts pre-BMT mortality and should drive response-adapted therapeutic strategies for HLH.
Abstract
Hemophagocytic lymphohistiocytosis (HLH) is a life-threatening hyperinflammatory syndrome that is most commonly treated with etoposide and dexamethasone. This standard of care therapy has improved survival, but ∼15% of patients still die in the first months after diagnosis, and poor responses prompting salvage therapy are frequent. Thus, identifying patients at risk promptly is likely to improve outcomes. We conducted a multi-institutional, retrospective study of pediatric and young adults treated per HLH-94 or HLH-2004 from 2010 to 2019 to identify patients at risk for early mortality. Biweekly data during the first 100 days of treatment were analyzed using receiver operating curves to define optimal prognostic indicators and their thresholds. The primary end point was survival to bone marrow transplant (BMT) or ∼1 year if no BMT was pursued. Eighty-nine patients met the study inclusion criteria. Pre-BMT mortality was 13% (n = 12), and overall mortality was 27% (n = 24). Laboratory markers measured on day 7 of therapy more efficiently predicted outcomes than did either pretreatment or later assessments. The most potent day 7 unfavorable marker was improvement in soluble CD25 (sCD25) of less than 25% from pretherapy levels. Absolute sCD25 level, platelet count, absolute lymphocyte count, and blood urea nitrogen were also discriminatory markers (area under the curve ≥ 0.7). The presence of ≥3 of these unfavorable markers was strongly associated with pre-BMT mortality (accuracy, 0.93). Thus, serial monitoring of sCD25 and assessment of other early (day 7) response markers optimally predicts prognosis with etoposide-based therapy and may indicate the need for earlier use of alternative, response-adapted therapeutic strategies for HLH.
Introduction
Hemophagocytic lymphohistiocytosis (HLH) is a severe hyperinflammatory syndrome caused by defects in immunoregulation.1 HLH is recognizable by a distinct constellation of features and laboratory changes, including fever, splenomegaly, markedly elevated inflammatory markers, cytopenias, transaminitis, hypofibrinogenemia, hypertriglyceridemia, and hyperbilirubinemia.1,2
Familial HLH encompasses a spectrum of genetic conditions and often presents early in childhood, with or without a known trigger. Reactive HLH can occur at any age in patients without known genetic defects and is associated with immune-activating triggers such as rheumatologic disorders or malignancies.1 Treatment per the HLH-94/HLH-2004 studies consists of immune suppression with etoposide and dexamethasone and is considered the standard of care for familial HLH and other forms of HLH in some circumstances.1,3,4
The implementation of standardized, etoposide-based therapy has significantly improved overall survival (OS) from an estimated 5-year OS of 21% in 19894,5 to an estimated 5-year OS of 54% and 61% after the HLH-94 and HLH-2004 trials, respectively.4 Despite this marked improvement, early mortality remains high, evidenced by the pre–bone marrow transplant (pre-BMT) mortality rate of 29% and 20% in these trials, with the majority of early deaths occurring within the first months after diagnosis.2,4,6
Uncontrolled disease activity is reported to be the primary cause of pre-BMT deaths and many with an initial response later experience disease reactivation.7-9 Reintensifying etoposide/dexamethasone therapy or switching to salvage therapy is often needed for those with inadequate responses. However, identifying these patients is challenging because there is no current standard definition of refractory disease.9 Several studies have investigated potential prognostic factors at diagnosis and have found correlations between various pretreatment markers and early mortality,2,6,10-15 however, these markers fail to incorporate the variable and dynamic responses seen with initial therapy.
Although prior reports have examined prognostic features in patients with HLH,2,10,12-14,16 they have been limited by extensive missing data, variable treatment regimens, lack of careful optimization of thresholds, and failure to examine the earliest response timepoints. Thus, early risk stratification and treatment response assessment remain a variable, relatively undefined concept in patients with HLH. Furthermore, data regarding the utility of soluble interleukin-2 receptor α (soluble CD25 [sCD25] or sIL-2rα), a key marker of T-cell activation, which may have a more consistent correlation with disease activity than ferritin,1,17 has not been comparatively investigated.
Our objective was to determine the optimal parameters, thresholds, and timing of early risk stratification during initial etoposide/dexamethasone-based HLH therapy, with the goal of identifying patients at risk and providing guidance for response-adaptive therapeutic strategies.
Methods
This is a multi-institutional, retrospective study of patients diagnosed with HLH and evaluated between 2010 and 2019 at Cincinnati Children’s Hospital Medical Center (CCHMC), Arkansas Children’s Hospital (ACH), or Schneider Children’s Medical Center of Israel (SCMCI). Institutional review board approval was obtained at each institution. The study was conducted in accordance with the Declaration of Helsinki.
Patient population
Patients of any age, treated in these pediatric centers, diagnosed with HLH/macrophage activation syndrome, and treated with the HLH-94/HLH-2004 protocols for at least 2 weeks (or to the time of death if it occurred earlier) were eligible for analysis. Exclusion criteria included initial therapy with antithymocyte globulin, HLH secondary to an unidentified malignancy, and insufficient data for a detailed outcome assessment. The diagnosis was verified using HLH-2004 diagnostic criteria1 or 2016 macrophage activation syndrome classification criteria if applicable18 (supplemental Table 1).
Data collection
Patients were identified at CCHMC via a diagnosis code-based bioinformatic strategy, and data were confirmed via chart review. At SCMCI, patients were identified via the Israeli HLH registry, and data were recorded via chart review. At ACH, patients were identified through a manual chart search strategy. Data are available upon request to the corresponding author.
Day 1 was defined as the first day of etoposide administration. Baseline (pretreatment) laboratory markers were defined as the peak pathologic value obtained within 7 days of treatment initiation. Fourteen laboratory markers were analyzed every 3 to 4 days when available for the first 100 days of treatment. Analyzed markers included sCD25, ferritin, hemoglobin, platelet count, absolute neutrophil count, absolute lymphocyte count (ALC), absolute monocyte count, fibrinogen, alanine transaminase, total bilirubin, creatinine, blood urea nitrogen (BUN), lactate dehydrogenase, and triglycerides. Improvement from pretreatment values ([difference between baseline and day X]/baseline value) was used to analyze the kinetic responses of each marker. Laboratories obtained within 3 days of the specified timepoints were eligible for inclusion. Data were truncated at the start of BMT preparation or on the day of death if this occurred within the first 100 days. Creatinine was normalized based on the upper limit of normal for each patient’s age and sex using the current reference ranges at the CCHMC laboratory. sCD25 was recorded using international units (units per mililiter). Splenomegaly was recorded from abdominal imaging, if available and documented from the admission history or physical examination if imaging was not available. Imaging results and cerebral spinal fluid abnormalities were used to assess central nervous system disease.
Outcomes and definitions
The primary end point was survival to BMT or 1 year if no BMT was pursued. Pre-BMT mortality was defined as the failure to achieve either end points. OS was evaluated at 5 years after diagnosis or at the last follow-up if the diagnosis was made less than 5 years before this analysis. Reintensification/salvage therapy was defined as increasing to biweekly etoposide or dexamethasone to 10 mg/m2 after week 2 or using additional agents for HLH control. Administration of rituximab was not considered salvage therapy.
Statistical analysis
Statistical analyses were performed using PRISM version 9.2.0, IBM SPSS Statistics version 28.0.0.0, scikit-learn 1.1.2, and lifelines 0.27.0.19 Continuous variables were summarized with median and interquartile ranges and compared using the Mann-Whitney U test. A P value <.05 was considered statistically significant. Categorical variables were summarized by n (%) and compared using the χ2 test. Classification and regression tree analysis (CART) and receiver operating curves (ROC) with pre-BMT mortality as the outcome binary variable were used to identify optimal prognostic indicators. CART analysis was performed with all early markers, separated by study day. A ROC area under the curve (AUC) ≥0.7 was considered as a satisfying ability to discriminate the patients, and cutoff points were derived from the highest Youden-index point (sensitivity + specificity − 1).20 Multivariate Cox analysis was performed using Breslow method with a small L2 regularization (penalizer = 0.015). Prognostic indicators were validated using the χ2 test to calculate the odds ratios (OR) based on rounded ROC-derived thresholds. Kaplan-Meier curves were generated and compared using the Log-Rank (Mantel-Cox) test. For the main analysis, missing data were left as missing. In a secondary analysis, missing data for each timepoint were imputed using sklearn’s multivariate IterativeImputer where indicated, to further validate findings. The missing data for each timepoint were calculated based on that patient’s data from the given timepoint and prior timepoint. Accuracy, precision, recall, and F score analyses were used to test the predictive power of the outstanding predictive markers and their combinations.
Results
Patient characteristics
Eighty-nine patients from 3 institutions met the criteria for inclusion (Table 1; supplemental Figure 1). The median age was 20 months (range, 0-282). Forty-four patients (49%) had causal genetic defects, and fifteen (17%) had indeterminant or ambiguous genetic findings. Genetic testing was not performed on 1 patient. Among the patients in the study, 10% had an underlying rheumatologic diagnosis, whereas 26% had documented Epstein-Barr virus (EBV) infection around the time of diagnosis. Additionally, 10% of patients experienced acute renal failure (defined by a normalized creatinine ≥2) during the study period (5 survived and 4 died). Fifty-five patients (62%) received a BMT. Pre-BMT mortality was 13% (n = 12). Overall mortality (up to 5 years from the start of treatment) was 27% (n = 24). The adjusted mean completeness of data for all parameters and all patients was 59% (standard deviation [SD], 20.1) throughout the study period (first 100 days), 90% (SD, 8.0) at presentation, 69% (SD, 20.3) at day 7%, and 63% (SD, 20.0) at day 14. There were 74 baseline sCD25 values (83%), 34 day 7 sCD25 values (38%), and 30 day 14 sCD25 values (34%) available for analysis (supplemental Figure 2). Fourteen laboratory parameters were assessed, measured every 3 to 4 days (up to 30 times) over 100 days of therapy. This is >10 times more data points than that has been previously reported in a series of patients with HLH, and even when considering missing data, this was substantially more data-dense than prior reports.
Demographics and patient characteristics
| . | . |
|---|---|
| Age (mo) at start of etoposide, median (range) | 20 (0-282) |
| Gender, n (%) | |
| Male | 52 (58) |
| Female | 37 (42) |
| Active CNS disease at diagnosis, n (%) | 22 (25) |
| Genetics, n (%) | |
| Positive | 44 (49) |
| Indeterminant/ambiguous | 15 (17) |
| Negative | 29 (33) |
| Not obtained | 1 (1) |
| Underlying rheumatologic diagnosis or MAS, n (%) | 9 (10) |
| Received BMT, n (%) | 55 (62) |
| Days to BMT, median (range) | 124 (56-2120) |
| Surviving >1 y without BMT | 22 (25) |
| Salvage therapy/reintensification, n (%) | |
| Within 100-d study period | 28 (31) |
| Within 1 y of treatment initiation | 37 (42) |
| Pre-BMT mortality (survived to BMT or 1 y), n (%) | |
| Survived | 77 (87) |
| Died | 12 (13) |
| OS, n (%) | |
| Survived | 65 (73) |
| Died | 24 (27) |
CNS, central nervous system; MAS, macrophage activation syndrome.
Characterization of salvage therapy and mortality
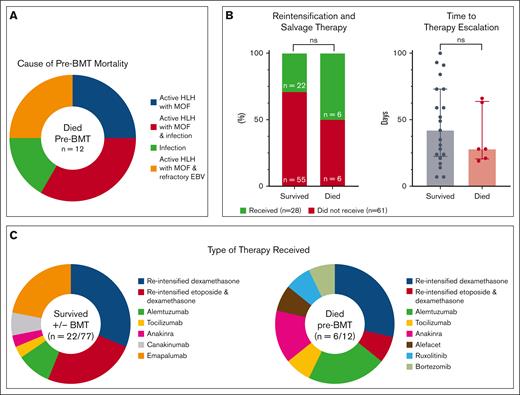
Twenty-eight patients (31%) received salvage/reintensification therapy within the first 100 days (6 with pre-BMT mortality and 22 who survived to or without BMT; supplemental Table 2). The median time to salvage/reintensification therapy was 35 days (range, 7-100) for all patients, 28 days (range, 19-66 days) for patients with pre-BMT mortality, and 42 days (range, 7-100) for survivors. The use of salvage/intensification therapy was not predictive/protective of mortality (P = .1290), nor was the time to therapy escalation (P = .5983; Figure 1B). Two pre-BMT deaths (17%) occurred within 10 days of treatment initiation and 6 (50%) within the first 100 days. One patient (ACH 1) did not die until day 375; however, this occurred after continuous treatment and persistent, refractory/relapsing disease. Ongoing, active HLH and multiorgan failure were associated with 10 pre-BMT deaths (83%). Three of these had active EBV at the time of death, and 4 had other concurrent infections (3 with invasive fungal disease and 1 with Serratia bacteremia). Acute infection (septic shock secondary to Klebsiella pneumonia and necrotizing fasciitis) was attributed as the main cause of death in the remaining 2 patients (Figure 1A; supplemental Table 3). These data confirm that most patients who died pre-BMT are dying from persistent HLH activity and suggest that salvage therapy is not clearly effective, perhaps because of its appropriateness or timing.
Characteristics of mortality and reintensification/salvage therapy in this study. (A) Cause of death for patients with pre-BMT mortality (n = 12). Most patients with pre-BMT mortality had active HLH at time of death. Infection refers to disseminated bacterial and invasive fungal disease. (B) The use of salvage therapy, displayed as percentages, and time to therapy initiation (range, 7-100 days) were not associated with pre-BMT mortality (P > .05). (C) Characteristics of reintensified or alternative therapies for patients who survived or died pre-BMT. Categorical variables were analyzed using Fisher exact t test and continuous variables using the Mann-Whitney U test. Further details of salvage therapies and associated outcomes are shown in supplemental Table 2 and detailed cause of death for patients with pre-BMT mortality in supplemental Table 3. MOF, multiorgan failure; ns, not significant; reintensified etoposide, biweekly etoposide after week 2 of therapy; reintensified dexamethasone, increased dose to 10 mg/m2 after week 2 of therapy.
Characteristics of mortality and reintensification/salvage therapy in this study. (A) Cause of death for patients with pre-BMT mortality (n = 12). Most patients with pre-BMT mortality had active HLH at time of death. Infection refers to disseminated bacterial and invasive fungal disease. (B) The use of salvage therapy, displayed as percentages, and time to therapy initiation (range, 7-100 days) were not associated with pre-BMT mortality (P > .05). (C) Characteristics of reintensified or alternative therapies for patients who survived or died pre-BMT. Categorical variables were analyzed using Fisher exact t test and continuous variables using the Mann-Whitney U test. Further details of salvage therapies and associated outcomes are shown in supplemental Table 2 and detailed cause of death for patients with pre-BMT mortality in supplemental Table 3. MOF, multiorgan failure; ns, not significant; reintensified etoposide, biweekly etoposide after week 2 of therapy; reintensified dexamethasone, increased dose to 10 mg/m2 after week 2 of therapy.
Multiple laboratory criteria during treatment differ between patients who died pre-BMT and those that survived to/without BMT
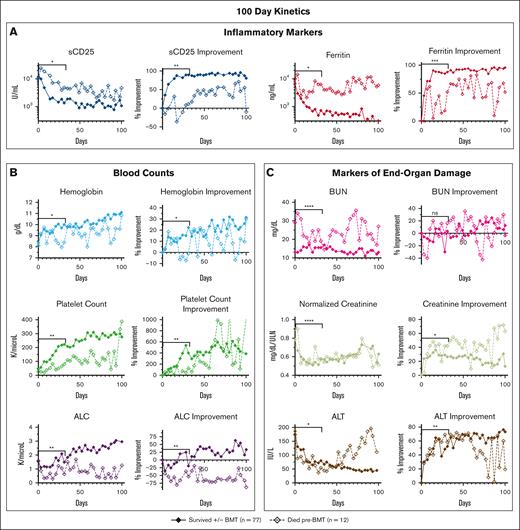
Most underlying factors and presenting features at diagnosis were not significantly associated with outcome (supplemental Figure 3). However, when we examined each parameter’s 31- and 100-day trends and/or kinetic data, numerous parameters diverged during treatment between patients who died before BMT vs those who survived (Figure 2). Lack of improvement (from baseline) in inflammatory markers and renal function markers showed the strongest association with pre-BMT mortality. Laboratory values and clinical features with minimal or no significant difference between groups are shown in supplemental Figure 4. In a subanalysis of patients who survived to BMT (n = 55; 62%) compared with those who survived without BMT (n = 22; 25%), there were minimal differences in response data (supplemental Figure 5).
When followed serially during etoposide-based therapy, multiple HLH-defining and organ-injury markers distinguish patients surviving with HLH from those dying before BMT. Graphs show the serial assessment of the significant absolute laboratory values and their associated improvement from baseline (both plotted as median values) for patients either surviving or dying pre-BMT. Trends in (A) inflammatory markers, (B) blood counts, and (C) markers of end-organ damage were all associated with pre-BMT mortality. Significance was determined using the Mann-Whitney U test assessing values from days 0 to 31 only. Figures show the first 100 days of treatment. Inflammatory markers (A) are displayed on a logarithmic scale. For reference, the day 0 to day 31 median absolute sCD25 was 3864 U/mL for survivors vs 8500 U/mL (overall range, 2939-20 127 U/mL) for patients who died pre-BMT and median absolute ferritin for survivors was 2251 vs 7103 ng/mL (overall range, 1689-17 380 ng/mL) for patients who died pre-BMT. Normalized creatinine was calculated using standard reference ranges for age and gender. Data of nonsignificant absolute laboratory values (P > .05) and their associated improvement from baseline are shown in supplemental Figure 4. Improvement from baseline = (difference between baseline and day X)/baseline value. ∗∗∗∗P < .0001; ∗∗∗P < .001; ∗∗P < .01; ∗P < .05. ALT, alanine transaminase; ns, not significant.
When followed serially during etoposide-based therapy, multiple HLH-defining and organ-injury markers distinguish patients surviving with HLH from those dying before BMT. Graphs show the serial assessment of the significant absolute laboratory values and their associated improvement from baseline (both plotted as median values) for patients either surviving or dying pre-BMT. Trends in (A) inflammatory markers, (B) blood counts, and (C) markers of end-organ damage were all associated with pre-BMT mortality. Significance was determined using the Mann-Whitney U test assessing values from days 0 to 31 only. Figures show the first 100 days of treatment. Inflammatory markers (A) are displayed on a logarithmic scale. For reference, the day 0 to day 31 median absolute sCD25 was 3864 U/mL for survivors vs 8500 U/mL (overall range, 2939-20 127 U/mL) for patients who died pre-BMT and median absolute ferritin for survivors was 2251 vs 7103 ng/mL (overall range, 1689-17 380 ng/mL) for patients who died pre-BMT. Normalized creatinine was calculated using standard reference ranges for age and gender. Data of nonsignificant absolute laboratory values (P > .05) and their associated improvement from baseline are shown in supplemental Figure 4. Improvement from baseline = (difference between baseline and day X)/baseline value. ∗∗∗∗P < .0001; ∗∗∗P < .001; ∗∗P < .01; ∗P < .05. ALT, alanine transaminase; ns, not significant.
Early improvement in sCD25 is the strongest single predictor of pre-BMT mortality
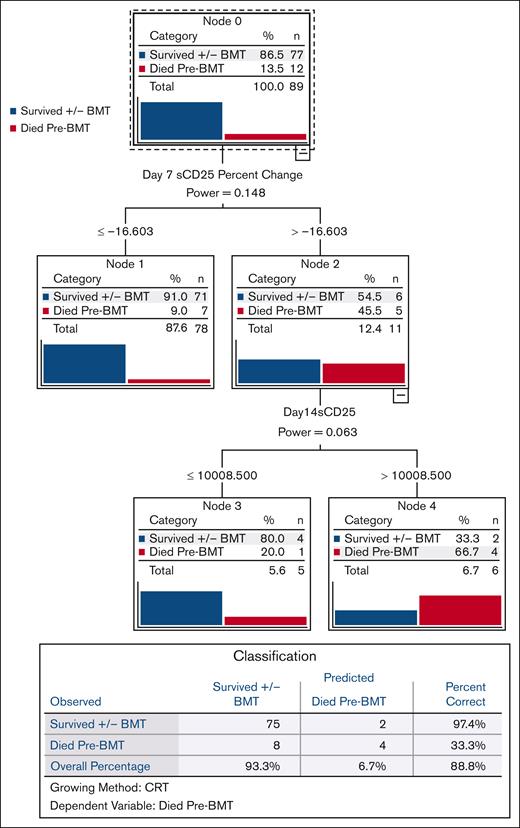
We used CART analysis, a predictive algorithm used in machine learning, to prioritize the most powerful predictors of pre-BMT mortality in a broad, unbiased fashion. Of all pretreatment, day 7, and day 14 parameters, day 7 sCD25 improvement from baseline ([difference between baseline and day 7]/baseline value) was the strongest discriminator of pre-BMT mortality (Figure 3). Because there were significant amount of missing sCD25 data, we also performed CART analysis including imputed data for these missing values, and we observed an identical result for day 7 sCD25 improvement, further validating this finding (supplemental Figure 6). We also performed univariate and multivariate Cox analysis and ROC analysis (described in subsequent sections), and both confirmed the unique predictive power of early sCD25 improvement for pre-BMT mortality.
Improvement in sCD25 by day 7 is the strongest single predictor of pre-BMT mortality. CART analysis, a predictive algorithm used in machine learning, was performed based on pre-BMT mortality as the dependent variable. Independent variables included baseline (pretreatment), day 7, and day 14 parameters. CART growth limits were defined with the Gini method with minimum parent node cases of 3, minimum child node cases of 2, with cross-validation using 10 sample folds. All laboratory parameters (assessed at baseline and weekly thereafter) and their associated improvement from baseline values were included in this analysis. Nonlaboratory parameters included persistent fever at days 7 and 14, splenomegaly at diagnosis, presence of hemophagocytosis, and NK cell activity. CART analysis including imputed data (for any missing data) gave an identical result and is shown in supplemental Figure 6. Improvement from baseline = (difference between baseline and day X)/baseline value. NK cell, natural killer cell.
Improvement in sCD25 by day 7 is the strongest single predictor of pre-BMT mortality. CART analysis, a predictive algorithm used in machine learning, was performed based on pre-BMT mortality as the dependent variable. Independent variables included baseline (pretreatment), day 7, and day 14 parameters. CART growth limits were defined with the Gini method with minimum parent node cases of 3, minimum child node cases of 2, with cross-validation using 10 sample folds. All laboratory parameters (assessed at baseline and weekly thereafter) and their associated improvement from baseline values were included in this analysis. Nonlaboratory parameters included persistent fever at days 7 and 14, splenomegaly at diagnosis, presence of hemophagocytosis, and NK cell activity. CART analysis including imputed data (for any missing data) gave an identical result and is shown in supplemental Figure 6. Improvement from baseline = (difference between baseline and day X)/baseline value. NK cell, natural killer cell.
Day 7 laboratory markers most rapidly and powerfully predict pre-BMT mortality
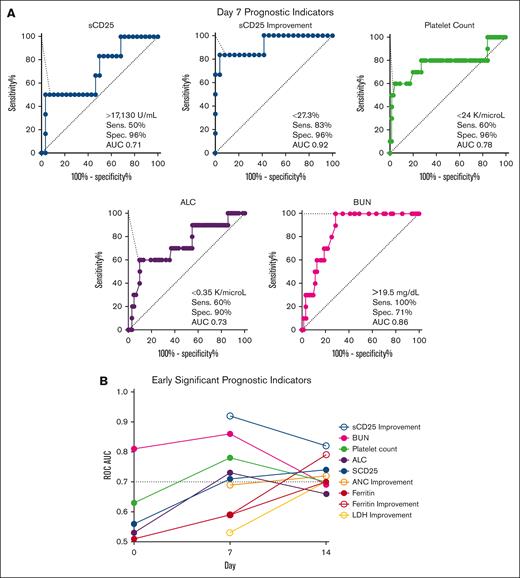
We next created ROCs for all parameters at early timepoints (pretreatment and days 7 and 14) to identify those with the strongest ability to predict pre-BMT mortality (AUC ≥ 0.7) and define optimal analysis thresholds. Day 7 was the timepoint with the strongest discriminatory ability (Figure 4). BUN was the only baseline (pretreatment) parameter with a good discriminatory ability (>14.5 mg/dL; AUC, 0.81); however, it had stronger discriminatory power at day 7. Similar to the CART analysis, day 7 sCD25 improvement from baseline (or lack thereof) had the highest discriminatory power (<27%; AUC, 0.92). Four additional day 7 markers had a strong ability to identify patients dying before BMT (Figure 4A). These included (in order of significance with their optimized threshold) BUN (>19.5 mg/dL; AUC, 0.86), platelet count (<24 × 109 per L; AUC, 0.78), ALC (<0.35 × 10⁹ per L; AUC, 0.73), and absolute sCD25 (>17 130 U/mL; AUC, 0.71). Absolute sCD25 had a slightly stronger discriminatory ability at day 14 (>11 588 U/mL; AUC, 0.74), but all other unfavorable day 7 markers were less discriminatory before treatment and at day 14 (supplemental Table 5).
Multiple laboratory parameters have maximal discriminatory power at day 7 compared with baseline or day 14 for predicting pre-BMT mortality. (A) ROC for day 7 laboratory parameters with AUC ≥ 0.7 are shown. Cutoffs are designated by the point with the highest Youden index. (B) Day 7 and day 14 markers with strong discriminatory power (AUC ≥ 0.7) are shown at baseline (day 0), day 7, and day 14. BUN is the only significant baseline marker. All significant markers and their optimized threshold at each early timepoint are listed in supplemental Table 5. Improvement = (difference between baseline and day X)/baseline value. ALC, absolute lymphocyte; LDH, lactate dehydrogenase; Sens., sensitivity; Spec., specificity.
Multiple laboratory parameters have maximal discriminatory power at day 7 compared with baseline or day 14 for predicting pre-BMT mortality. (A) ROC for day 7 laboratory parameters with AUC ≥ 0.7 are shown. Cutoffs are designated by the point with the highest Youden index. (B) Day 7 and day 14 markers with strong discriminatory power (AUC ≥ 0.7) are shown at baseline (day 0), day 7, and day 14. BUN is the only significant baseline marker. All significant markers and their optimized threshold at each early timepoint are listed in supplemental Table 5. Improvement = (difference between baseline and day X)/baseline value. ALC, absolute lymphocyte; LDH, lactate dehydrogenase; Sens., sensitivity; Spec., specificity.
Interestingly, ferritin and improvement in ferritin from baseline were not predictive of pre-BMT mortality until day 14. Similar to sCD25, day 14 ferritin improvement was a better predictor of mortality than absolute ferritin (AUC 0.79 vs 0.70, respectively). Both ferritin and ferritin improvement showed improved discriminatory ability over time. Pretreatment values of both inflammatory markers were poor discriminators between groups (AUC, <0.70). sCD25 improvement and platelet count were the only 2 markers to remain significant at all 3 early timepoints (days 7, 14, and 21) and absolute sCD25 at all but day 21 (supplemental Table 5).
Pre-BMT mortality risk is optimally predicted by a combination of day 7 prognostic markers
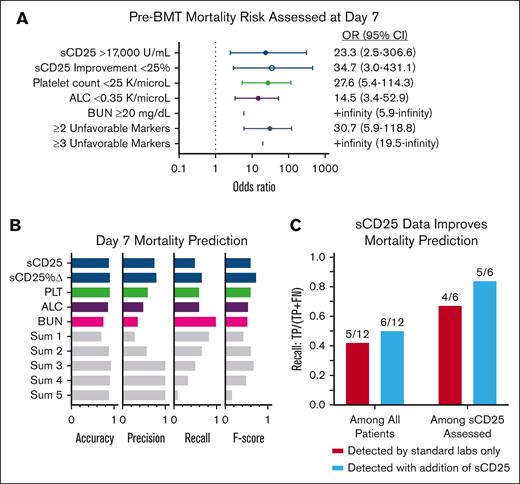
All 5 unfavorable day 7 markers were highly associated with poor prognosis (OR > 1.0, using rounded ROC-derived thresholds; Figure 5A). Each day 7 marker, other than absolute sCD25, remained similarly significant when reanalyzed including imputed data for missing values (supplemental Figure 7A).
Pre-BMT mortality risk is optimally predicted by assessment of 5 response/organ function markers 7 days after initiation of etoposide-based therapy. (A) Forest plots of the OR and 95% CI of pre-BMT mortality prediction by day 7 markers using each timepoint’s associated ROC-derived cutoffs. (Figure 4; supplemental Table 5). Thresholds were rounded for more practical clinical use. An OR could not be estimated for BUN or ≥3 unfavorable markers because all patients who died before BMT had a BUN above the specified cutoff and no survivors had ≥3 poor prognostic markers. Similar analysis using imputed data is shown in supplemental Figure 7A. (B) Accuracy (correct predictions/total predictions), precision (correctly predicted deaths/total predicted deaths), recall (correctly predicted deaths/actual deaths), and F score (harmonic mean of precision and recall; a balanced score of overall performance) based on ROC-derived thresholds for day 7 markers. Sum 1 means at least 1 threshold exceeded, sum 2 any 2 thresholds exceeded, etc. (C) Recall analysis of patients with pre-BMT mortality whose outcome was correctly predicted using standard laboratories only vs those with sCD25 data available. The models improved by 8% and 17% when sCD25 data were included. Improvement = (difference between baseline and day 7 values)/baseline value. Pts, patients.
Pre-BMT mortality risk is optimally predicted by assessment of 5 response/organ function markers 7 days after initiation of etoposide-based therapy. (A) Forest plots of the OR and 95% CI of pre-BMT mortality prediction by day 7 markers using each timepoint’s associated ROC-derived cutoffs. (Figure 4; supplemental Table 5). Thresholds were rounded for more practical clinical use. An OR could not be estimated for BUN or ≥3 unfavorable markers because all patients who died before BMT had a BUN above the specified cutoff and no survivors had ≥3 poor prognostic markers. Similar analysis using imputed data is shown in supplemental Figure 7A. (B) Accuracy (correct predictions/total predictions), precision (correctly predicted deaths/total predicted deaths), recall (correctly predicted deaths/actual deaths), and F score (harmonic mean of precision and recall; a balanced score of overall performance) based on ROC-derived thresholds for day 7 markers. Sum 1 means at least 1 threshold exceeded, sum 2 any 2 thresholds exceeded, etc. (C) Recall analysis of patients with pre-BMT mortality whose outcome was correctly predicted using standard laboratories only vs those with sCD25 data available. The models improved by 8% and 17% when sCD25 data were included. Improvement = (difference between baseline and day 7 values)/baseline value. Pts, patients.
Considering the lack of rapid availability of sCD25 in many centers, we next assessed the cumulative effect of any unfavorable day 7 prognostic marker. Patients with ≥2 of any unfavorable day 7 marker had a significantly higher risk of pre-BMT mortality (OR, 30.7; 95% confidence interval [CI], 5.9-118.8), and the presence of ≥3 of any unfavorable day 7 marker was associated with 100% pre-BMT mortality (OR, +infinity; 95% CI, 19.5-infinity; Figure 5A). A similar result was observed when including imputed data (OR, 34.5; 95% CI, 7.4-139.2; supplemental Figure 7A). In the recall analysis, the presence of 3 markers (Sum 3) achieved the highest accuracy (0.93) and precision (1.0). Accuracy measures the overall correctness of predictions, whereas precision focuses on the validity of positive predictions, specifically for predicting deaths. Among the markers, sCD25 improvement had the strongest balance between false positives and false negatives, as indicated by its F score (0.72), which considers both precision and recall. Recall measures the ability to correctly identify positive instances, and a higher recall indicates fewer instances were missed or falsely labeled. The combination of 3 unfavorable parameters yielded an F score of 0.63, slightly lower than sCD25 improvement’s performance (0.72).
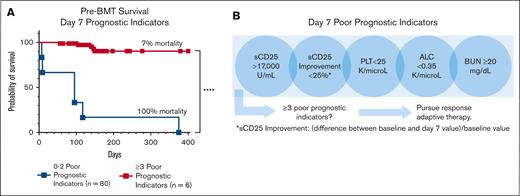
In the survival analysis, each significant day 7 marker was associated with pre-BMT mortality. As the number of poor prognostic indicators increased, so did the probability of pre-BMT mortality, validating the additive effect of multiple unfavorable markers (supplemental Figure 7C). Those with ≥3 unfavorable day 7 markers had a significantly higher risk of pre-BMT mortality than patients with <3 unfavorable markers (P < .0001; Figure 6A). Analyses including imputed data for missing measures further supported this finding (supplemental Figure 7). Similar analyses using significant day 14 markers are shown in supplemental Figure 8. Although all 5 prognostic markers are valuable, inclusion of sCD25 measurement at day 7 improved predictive performance, further emphasizing the value of sCD25 monitoring during therapy (Figure 6C). Thus, we conclude that the indicated day 7 laboratory assessments, critically including the specialized sCD25, are key predictors of poor outcome and may guide treatment decisions (Figure 6B).
The presence of ≥3 (of 5) unfavorable day 7 poor prognostic indicators is strongly associated with pre-BMT mortality. (A) Kaplan-Meier pre-BMT survival estimates based on markers obtained around day 7 of therapy. The addition of imputed data for missing values are shown in supplemental Figure 7 and gave a similar result. Survival analysis using individual day 7 markers is shown in supplemental Figure 9C. (B) An illustration of the early response assessment tool for patients receiving etoposide-based therapy indicating the need for a data-based, responsive-adaptive therapeutic strategy for HLH. Improvement = (difference between baseline and day 7 values)/baseline value; ∗∗∗∗P < .0001.
The presence of ≥3 (of 5) unfavorable day 7 poor prognostic indicators is strongly associated with pre-BMT mortality. (A) Kaplan-Meier pre-BMT survival estimates based on markers obtained around day 7 of therapy. The addition of imputed data for missing values are shown in supplemental Figure 7 and gave a similar result. Survival analysis using individual day 7 markers is shown in supplemental Figure 9C. (B) An illustration of the early response assessment tool for patients receiving etoposide-based therapy indicating the need for a data-based, responsive-adaptive therapeutic strategy for HLH. Improvement = (difference between baseline and day 7 values)/baseline value; ∗∗∗∗P < .0001.
Discussion
In this retrospective, multiinstitutional study, we found that early evaluations of treatment response, rather than disease severity at presentation, are the optimal predictors of pre-BMT mortality during etoposide-based therapy for pediatric HLH. Through a comprehensive assessment of baseline and response features, we identified that treatment response powerfully predicts pre-BMT mortality, with day 7 being the earliest and strongest timepoint for mortality prediction. The most robust single predictor of outcome was the improvement of sCD25 from baseline (pretreatment). However, for optimal mortality prediction, it is essential to evaluate sCD25, platelets, BUN, and ALC around day 7 of therapy. Having ≥3 of these laboratory markers in an unfavorable range was associated with 100% mortality. This study provides the most detailed and complete data set to date on responses after HLH-94/2004 therapy, including serial assessment of sCD25, which holds unique prognostic value. Our findings suggest that implementing data-driven response-adapted therapies, similar to approaches in leukemia therapy, could improve outcomes for patients with HLH.
It is well-established that early mortality during HLH therapy remains a major challenge1,2,4,6,10,11,13,14,21 and necessitates an accurate method for early risk stratification. Consistent with prior studies,2,10 we found that platelet count and ferritin level at day 14 were predictive of mortality. However, sCD25 improvement from baseline, a parameter not included in the above-mentioned studies, outperformed both markers in our analysis. Moreover, most parameters were more potent predictors of pre-BMT mortality at day 7, an earlier timepoint not included in prior reports. Thus, our optimized response marker assessment allows for earlier and more accurate identification of patients at high risk, allowing earlier consideration of alternative therapies.
Although response to therapy has been recognized for decades as one of the most important predictive factors in patients with malignancy, a careful prognostic assessment of changes from pretreatment abnormalities has not been previously described in patients with HLH. Prior studies have evaluated pretreatment parameters for prognostication of early2,6,10,11,14 or overall mortality.12,13,16,22,23 Although multiple parameters were variably found to have a significant association with poor outcomes, many patients within these cohorts did not receive HLH-directed therapy, received steroid-only therapy, or were treated with protocols other than HLH-94/2004. Strikingly, we found that with standard, etoposide-based initial treatment, most pretreatment variables did not predict outcomes. This result suggests that in most cases (all but the earliest deaths), mortality is not due to the severity of the patient’s initial condition but is related to the patient’s poor responsiveness to, or toxicity from, etoposide-based therapy. Consistent with this idea, patients dying pre-BMT displayed markedly slower initial improvement of inflammatory markers and cytopenias, as well as greater treatment-emergent lymphopenia (Figure 2). Of note, treatment-emergent lymphopenia after etoposide has not been previously reported. Thus, patients faring poorly on HLH94/2004 experienced less anti-inflammatory and more myelo/lymphosuppressive effects from this therapeutic strategy.
For both sCD25 and ferritin, an early improvement from baseline (or lack thereof) was a stronger predictor of pre-BMT mortality than either inflammatory marker’s absolute value at any point (Figure 4). The utility of ferritin rate of decline during HLH-directed therapy was previously reported by Lin et al, who found that a decrease in ferritin by less than 50% during the first 10 weeks of therapy was associated with increased risk of death.16 Similarly, Bin et al showed that ferritin percent change at week 2 was associated with resolution of disease at week 8.2 However, those with earlier mortality were not included in this analysis, and neither study assessed the best timeframe to analyze this change nor included a similar analysis using sCD25.
Our data show that sCD25 and its improvement from baseline, a parameter not included in most similar studies, is the strongest individual risk factor for early mortality. In 1989, Komp et al first showed that this surrogate marker of T-cell activation was significantly elevated in 9 children with untreated HLH, and in the 5 patients with longitudinal data, this level was significantly reduced after treatment.24 Since its adoption into the HLH-2004 diagnostic criteria, sCD25 has also been used for monitoring disease activity and is thought to correlate with current disease activity more consistently than ferritin.1,17 However, data on its prognostic implications are sparse. Notably, the degree of elevation in sCD25 was significantly higher than the threshold in the HLH-2004 criteria1,14 (Figure 2). Prior studies have shown that the degree of elevation at presentation is associated with survival and that disease resolution is associated with improved sCD25 level.15,17,23,25,26 However, to our knowledge, no prior study has reported the prognostic implications of sCD25 level in response to specific HLH-directed therapy at early timepoints and in direct comparison with other relevant parameters. The utility of day 7 sCD25 improvement in predicting pre-BMT mortality was validated with multiple statistical methodologies, including CART (Figure 3), COX proportional hazard model (supplemental Table 4), ROC (Figure 4), and survival analyses (Figures 5 and 6). Thus, our findings indicate that sCD25 should be monitored not only initially for diagnostic purposes but at least weekly as a key measure of response with prognostic importance.
Beyond sCD25, we found that the presence of ≥3 of the day 7 poor prognostic indicators (sCD25 >17 000 U/mL; sCD25 improvement from baseline, <25%; platelet count <25 × 109 per L; ALC <0.35 × 10⁹ per L; and BUN ≥20 mg/dL) significantly predicted pre-BMT mortality (OR, +infinity; 95% CI, 19.5 to infinity; imputed OR, 34.5; 95% CI, 7.4-139.2; Figure 6) and should prompt consideration of alternative or salvage therapies. Although a proportion of our patients with pre-BMT mortality did receive salvage/reintensification therapy, the median timepoint in which this cohort received this was day 28, which was not statistically different from the group surviving to/without BMT (Figure 1B). Our findings indicate that salvage therapy is being considered and started far later than what is optimal and suggest that earlier identification and treatment of refractory disease could improve outcomes. Future studies are warranted to evaluate the prognostic implications of prompt treatment modification for patients at high risk.
Of note, BUN was the only baseline or pretreatment marker with a strong ability to discriminate patients who survived to BMT from those who did not (>14.5 mg/dL; AUC, 0.81) and remained a potent predictor of pre-BMT mortality at day 7 (>19.5 mg/dL; AUC, 0.86; Figure 4; supplemental Table 5). Indeed, all patients with pre-BMT mortality with day 7 BUN data available had a BUN ≥20 mg/dL. Similar findings were recently reported in a cohort of patients with EBV-related HLH in whom BUN was associated with early mortality.15 In our study, causes for baseline and/or day 7 BUN elevation appear to be multifactorial. Although steroid exposure may elevate BUN, pre-etoposide steroid exposure (initiated >3 days before etoposide) rates were similar between the groups (9 of 77 survivors [16%]; and 2 of 12 patients [17%] with pre-BMT mortality) and is therefore an unlikely contributor to this finding. Elevation of BUN was associated with early organ failure (circulatory collapse requiring vasopressors, n = 6 [50%]; renal failure, n = 4 [33%]; hepatic failure, n = 4 [33%]; and/or gastrointestinal bleeding, n = 2 [17%]; supplemental Table 3) and likely had a multifactorial etiology. Coinciding thrombotic microangiopathy27 (TMA) may be contributing to organ dysfunction, because it has been reported to occur at a high rate in patients with refractory HLH, potentially due to coactivation of both interferon and complement pathways.28,29 Early thrombotic microangiopathy specific features were present in 5 of 12 patients (42%) with pre-BMT mortality (supplemental Table 3). Future studies to investigate this potential link could improve clinical outcomes in patients at high risk.28 This retrospective study has limitations, including missing data (supplemental Figure 2) and its retrospective nature. However, the completeness of baseline and nonspecialty laboratory assessments was ∼90%, which is notably higher than previous reports. Furthermore, our study involved much more frequent serial laboratory assessments compared with prior studies and much more detailed data, even considering missing elements. Furthermore, the proportion of missing day 7 parameters did not affect pre-BMT mortality prediction, and our findings were consistent in imputed data analysis (supplemental Figures 6 and 7). Prospective, multicenter studies with larger sample sizes are warranted to validate the utility of these prognostic indicators on day 7 and assess the impact of early escalation to salvage/reintensification therapy on early mortality in patients at high risk.
In conclusion, we show that early evaluation of treatment response is vital for prediction of pre-BMT mortality risk in children and young adults with HLH. Failure to improve sCD25 from baseline is the most potent individual predictor of pre-BMT mortality, and serial assessments should be incorporated into clinical practice. Furthermore, assessment of a short list of laboratory parameters (absolute sCD25 level, sCD25 improvement from baseline, platelet count, ALC, and BUN) after 1 week of etoposide-based therapy is highly predictive of pre-BMT mortality. Finally, observing ≥3 day 7 poor prognostic indicators is highly associated with pre-BMT mortality and should prompt consideration of response-adapted therapeutic strategies that can potentially improve outcomes.
Acknowledgments
The authors thank Diana Epperson, Krassimir Kotzev, and Alka Chandel, members of the CCHMC Informatics for Integrating Biology and the Bedside (i2b2) program, who assisted with patient identification and data retrieval.
This project was supported by the CCHMC Research Innovation in Support of Excellence award, Liam’s Lighthouse Foundation, and the Angel Adalida Foundation. BioRender.com was used to create the visual abstract.
Authorship
Contribution: A.Z.L., B.F., and M.B.J. initiated the project and its initial design. B.V., A.Z.L., and M.B.J analyzed the data and wrote the manuscript with inputs from other authors; B.V., A.Z.L., B.F., J.M., T.B., D.B.S., and J.Y. collected the data; B.F., P.K., J.Y., and J.M. edited the manuscript and provided essential inputs; and P.K. helped in designing the statistical plan, contributed to key figures and analyses, and edited the manuscript.
Conflict-of-interest disclosure: A.Z.-L. is a consultant for Sobi. M.B.J. receives research support from and is a consultant for Sobi. The remaining authors declare no competing financial interests.
Correspondence: Michael B. Jordan, Division of Immunobiology, Cincinnati Children’s Hospital Medical Center, 3333 Burnet Ave, ML7038, Cincinnati, OH, 45229; e-mail: michael.jordan@cchmc.org.
References
Author notes
∗B.V. and A.Z.L. contributed equally to this study.
Data are available upon request from the corresponding author, Michael B. Jordan (Michael.jordan@cchmc.org).
The full-text version of this article contains a data supplement.

