Key Points
Oncogenic MAF, unlike physiological MAF, activates cell proliferation.
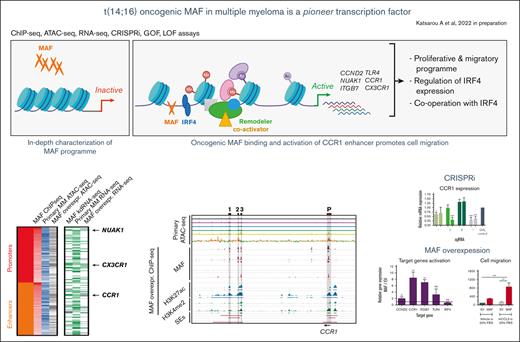
MAF acts as a pioneer TF in myeloma to de novo activate, in cooperation with IRF4, an oncogenic transcriptional program and phenotype.
Abstract
Deregulated expression of lineage-affiliated transcription factors (TFs) is a major mechanism of oncogenesis. However, how the deregulation of nonlineage affiliated TF affects chromatin to initiate oncogenic transcriptional programs is not well-known. To address this, we studied the chromatin effects imposed by oncogenic MAF as the cancer-initiating driver in the plasma cell cancer multiple myeloma. We found that the ectopically expressed MAF endows myeloma plasma cells with migratory and proliferative transcriptional potential. This potential is regulated by the activation of enhancers and superenhancers, previously inactive in healthy B cells and plasma cells, and the cooperation of MAF with the plasma cell-defining TF IRF4. Forced ectopic MAF expression confirms the de novo ability of oncogenic MAF to convert transcriptionally inert chromatin to active chromatin with the features of superenhancers, leading to the activation of the MAF-specific oncogenic transcriptome and the acquisition of cancer-related cellular phenotypes such as CCR1-dependent cell migration. These findings establish oncogenic MAF as a pioneer transcription factor that can initiate as well as sustain oncogenic transcriptomes and cancer phenotypes. However, despite its pioneer function, myeloma cells remain MAF-dependent, thus validating oncogenic MAF as a therapeutic target that would be able to circumvent the challenges of subsequent genetic diversification driving disease relapse and drug resistance.
Introduction
Transcription factors (TFs), in addition to their developmental roles can also act as primary or secondary oncogenes when deregulated.1-4 For instance, chromosomal translocations that juxtapose oncogenes to the immunoglobulin heavy chain (IgH) superenhancer (SE) are a seminal genetic mechanism of oncogenesis in mature B-cell lineage malignancies, including lymphomas5 and multiple myeloma (MM).6 Several of these juxtaposed and overexpressed genes for example, BCL6 and MYC, are TFs whose normal expression is temporally and spatially regulated during B-cell development. However, when their regulation is perturbed by an IgH translocation, they acquire transforming activity and drive oncogenesis. In MM, the physiological lineage–affiliated transcriptional program imposed by the TF IRF47 is modified by its synergy with MYC, leading to the deregulation of several oncogenic pathways.8
However, the manner by which the ectopic expression of a TF not expressed during B-cell development shapes the chromatin landscape that provides the platform to activate an oncogenic transcriptional program remains to be explored.
MAF is a leucine zipper TF of the AP superfamily9 that regulates several developmental processes.10-13 In hematopoiesis, MAF is required for the development of follicular T helper (Tfh) cells12 and M2 macrophages,14 but its expression pattern in the B lineage has not been defined. Functions regulated by MAF during the development of different cell types include the promotion of differentiation at the expense of cell proliferation, stromal adhesion ability of the cells through the regulation of genes such as ITGB7,15 and the regulation of cytokine genes required for the specialized functions of Tfh cells16 and macrophages.14
Although MAF can be directly oncogenic when overexpressed in different cell types,17,18 its role in humans as a direct oncogene with tumor-initiating capability has been shown only in MM,19 an incurable malignancy of the bone marrow plasma cells (PCs). Indeed, transgenic mice overexpressing MAF in the B-cell compartment develop lymphoma with some myeloma-like features.18
Myeloma initiating events (MIEs), that is, genetic events necessary but not sufficient for malignant transformation and clinical myeloma, include either chromosomal hyperdiploidy or translocations that bring MMSET, CCND1, and MAF to the vicinity of an IgH enhancer.6 These events are thought to take place during Ig class-switch recombination in the germinal center B (GCB) cells.20 However, only the PC-derived myeloma and not GCB or post-GCB cell lymphomas are associated with MAF, suggesting that PCs provide the permissive cellular context required for the malignant potential of MAF to be realized. The well-studied MAF-associated transcriptional signatures highlight the MAF-dependent deregulation of oncogenes, such as cell cycle regulator CCND2 and ITGB7.21,22 However, how oncogenic MAF molds chromatin and the regulatory genome that determine the distinct transcriptional oncogenic program associated with t(14;16) in MM remains unknown.
Materials and methods
Cell lines
The MM.1S, NCI-H929 (ATCC, USA), JJN3, KMS12 BM, and U266 (DSMZ, Germany) human MM cell lines were used.
Supplemental Methods include descriptions of the cell cycle, intracellular staining, migration, chromatin immunoprecipitation (ChIP)-re-ChIP, restriction enzyme digestion accessibility, CRISPR interference assays, lentiviral constructs, and production. They also include detailed descriptions of omic experimental and computational approaches.
Results
Redefining the oncogenic, MAF-associated transcriptome
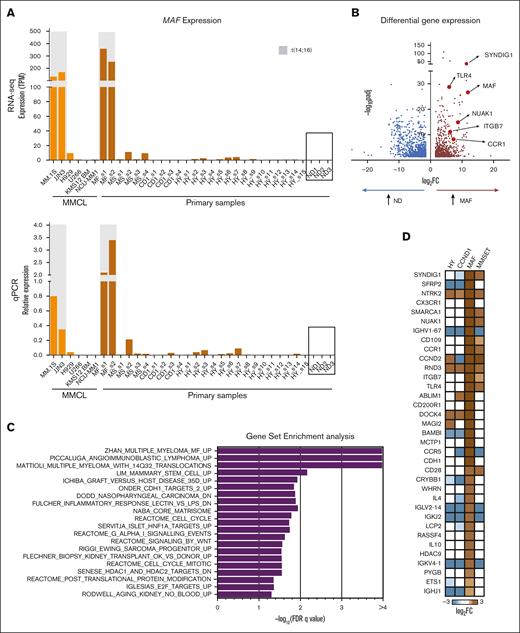
A direct comparison of MAF-translocated myeloma PCs with healthy bone marrow PCs has not been reported. Gene expression analysis showed that MAF is expressed the most in MAF-translocated myeloma, with no detectable expression in healthy PCs, indicating that the expression of oncogenic MAF in myeloma is ectopic (Figure 1A; supplemental Figure 1A). Upon a comparison of the transcriptomes of purified healthy and MAF-translocated myeloma PCs, several genes (eg, ITGB7, NUAK1, CCR1, and MAF itself) previously identified as specific to the MAF subgroup compared with other subgroups were found overexpressed (Figure 1B; supplemental Figure 1B; supplemental Table 1), whereas gene set enrichment analysis (GSEA) revealed the MAF myeloma signature as the most highly enriched (Figure 1C). In addition, a cell cycle signature was enriched in overexpressed genes. Although, previously, myeloma cell proliferation was ascribed to the upregulation of CCND2 by MAF,23 here, we identify several other upregulated genes (eg, CDK6 and PLK4; Figure 2D) known to support cell proliferation.
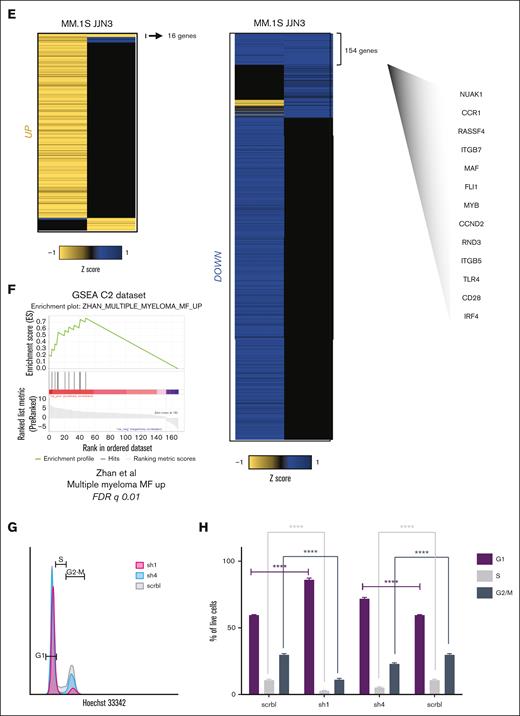
The oncogenic MAF-associated transcriptome. (A) MAF expression by RNA sequencing (RNA-seq) (top) and MAF messenger RNA quantification via qPCR (bottom) in the same primary myeloma PC samples (dark) compared with myeloma cell lines (light) and healthy donor PCs (boxed). Shaded in gray are the MAF-translocated cells. Expression via qPCR normalized to GAPDH, using 2 delta CT method relative to a housekeeping gene: MF; MAF, MS; MMSET, CD1; and CCND1. (B) Volcano plot showing differential gene expression in MAF primary myeloma cells as compared with healthy donor (ND) bone marrow plasma cells (Padj < .05; log2FC ≥1.5). Genes highlighted for illustration represent previously validated MAF target genes in myeloma (NUAK1, CCR1, and ITGB7) or genes previously associated with the MF molecular group in gene expression studies. (C) GSEA of the genes upregulated in MAF primary samples (MAF s1 and MAF s2) compared with healthy PCs (ND1, ND2, and ND3). Only pathways with false discovery rate q value < .05 are shown. (D) Heatmap of selected genes depicting significant differential expression compared with healthy PCs across genetic subgroups. (E) Heatmaps showing shared upregulated and downregulated genes in the MM.1S and JJN3 MAF-translocated cell lines transduced with anti-MAF short hairpin 1 RNA (sh1-RNA) and sh4-RNA, compared with the scrbl control. A selective list of differentially downregulated genes common to both cell lines is shown and includes genes previously associated with the MAF molecular group (CCND2, NUAK1, CCR1, and ITGB7) as well as genes not previously linked specifically to MAF in myeloma (FLI1, MYB, CD28, IRF4, and ITGB5). (F) GSEA of genes differentially downregulated by MAF knockdown in both cell lines, against the MF subgroup top upregulated genes, as previously identified by Zhan et al (G–H). Cell cycle analysis performed on transduced MM.1S cells on day 6 of the experiment. Cells were gated on green fluorescent transduced live cells that are double negative for annexin V and propidium iodide staining. Hoechst stain was used to assess the cell cycle. In each panel, an overlay of representative flow cytometry histograms is shown (G) along with bar graphs showing the mean percentage (and standard deviation) of cells found at each cell cycle stage (H). ∗∗∗∗P < .0001; 2-way analysis of variance (ANOVA; Tukey post hoc multiple comparisons correction) for n = 3 independent experiments. HY, hyperdiploid, ns, nonsignificant.
The oncogenic MAF-associated transcriptome. (A) MAF expression by RNA sequencing (RNA-seq) (top) and MAF messenger RNA quantification via qPCR (bottom) in the same primary myeloma PC samples (dark) compared with myeloma cell lines (light) and healthy donor PCs (boxed). Shaded in gray are the MAF-translocated cells. Expression via qPCR normalized to GAPDH, using 2 delta CT method relative to a housekeeping gene: MF; MAF, MS; MMSET, CD1; and CCND1. (B) Volcano plot showing differential gene expression in MAF primary myeloma cells as compared with healthy donor (ND) bone marrow plasma cells (Padj < .05; log2FC ≥1.5). Genes highlighted for illustration represent previously validated MAF target genes in myeloma (NUAK1, CCR1, and ITGB7) or genes previously associated with the MF molecular group in gene expression studies. (C) GSEA of the genes upregulated in MAF primary samples (MAF s1 and MAF s2) compared with healthy PCs (ND1, ND2, and ND3). Only pathways with false discovery rate q value < .05 are shown. (D) Heatmap of selected genes depicting significant differential expression compared with healthy PCs across genetic subgroups. (E) Heatmaps showing shared upregulated and downregulated genes in the MM.1S and JJN3 MAF-translocated cell lines transduced with anti-MAF short hairpin 1 RNA (sh1-RNA) and sh4-RNA, compared with the scrbl control. A selective list of differentially downregulated genes common to both cell lines is shown and includes genes previously associated with the MAF molecular group (CCND2, NUAK1, CCR1, and ITGB7) as well as genes not previously linked specifically to MAF in myeloma (FLI1, MYB, CD28, IRF4, and ITGB5). (F) GSEA of genes differentially downregulated by MAF knockdown in both cell lines, against the MF subgroup top upregulated genes, as previously identified by Zhan et al (G–H). Cell cycle analysis performed on transduced MM.1S cells on day 6 of the experiment. Cells were gated on green fluorescent transduced live cells that are double negative for annexin V and propidium iodide staining. Hoechst stain was used to assess the cell cycle. In each panel, an overlay of representative flow cytometry histograms is shown (G) along with bar graphs showing the mean percentage (and standard deviation) of cells found at each cell cycle stage (H). ∗∗∗∗P < .0001; 2-way analysis of variance (ANOVA; Tukey post hoc multiple comparisons correction) for n = 3 independent experiments. HY, hyperdiploid, ns, nonsignificant.
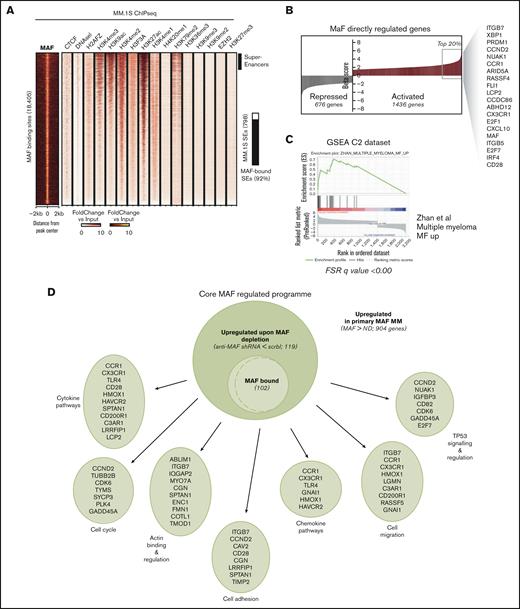
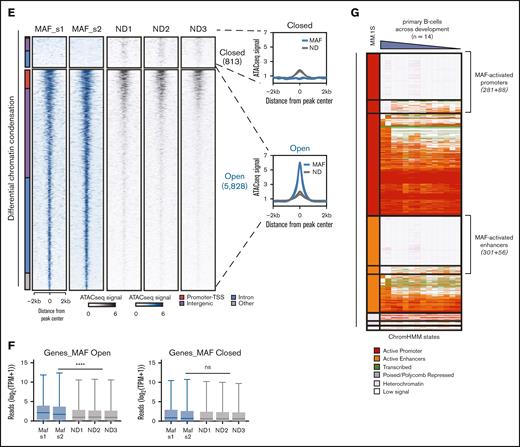
Oncogenic MAF-associated and -activated regulatory genome. (A) Heatmap depicting the genome-wide MAF binding sites (left), as obtained from ChIP-seq assays against MAF in MM.1S cells, represented as fold change over input. On the right, respective maps of histone marks and other epigenetic markers in MM.1S on the same binding sites (fold change over input), obtained from ENCODE consortium project repository. Activatory histone marks as well as EZH2, a histone methyltransferase and transcriptional repressor, H3K27me3, and heterochromatin histone marks H3K9me2/3 have been included. SEs in the MAF binding sites are depicted by the black bars on the right. (B) MAF directly regulated targets as identified via beta-plus analysis of shRNA up and downregulated genes, ranked based on the beta score. Highlighted are some of the genes in the top 20% of MAF-regulated targets, some of which were previously identified as MAF targets or MF molecular group–associated genes in gene expression studies. (C) GSEA shows a significant enrichment of MAF targets against the top 50 upregulated genes in the MF molecular group identified by Zhan et al. (D) Integration of predicted MAF direct targets obtained from MM cell line assays (MAF-bound and downregulated upon MAF depletion) with genes found differentially expressed in MAF primary myeloma PC (genes upregulated in MAF myeloma PCs compared with healthy PCs) yielded a set of 102 core MAF-regulated genes. Functional annotation of the genes was performed using multiple curated molecular signature data sets. Only pathways involving 4 or more MAF core target genes are shown. (E) Differential chromatin accessibility (ATAC-seq) in MAF primary samples (MAF_s1 and MAF_s2) as compared with healthy PCs (ND1, ND2, and ND3). Heatmaps depicting the regions with differential chromatin accessibility between MAF samples and healthy PCs (Padj < .05, log2FC = 1), either displaying enhanced accessibility (open) or reduced accessibility in MAF samples (closed). Bar (left) illustrates the genomic annotation of these regions. (F) Box plots depicting expression (in reads) of genes annotated to MAF open (blue) or MAF closed (gray) regions per sample, ∗∗∗∗P < .0001; Mann-Whitney U test. (G) Heatmap of the MAF-associated regions with the corresponding histone mark map of healthy tonsillar PCs (first 2 samples on the right of MM.1S) and B cells across B-cell maturation stages (Blueprint Consortium data), identifying a group of epigenetically defined promoters and enhancers, which lack activatory marks in tonsillar PCs or both in PCs and throughout B-cell development, thus defining the MAF-activated regions.
Oncogenic MAF-associated and -activated regulatory genome. (A) Heatmap depicting the genome-wide MAF binding sites (left), as obtained from ChIP-seq assays against MAF in MM.1S cells, represented as fold change over input. On the right, respective maps of histone marks and other epigenetic markers in MM.1S on the same binding sites (fold change over input), obtained from ENCODE consortium project repository. Activatory histone marks as well as EZH2, a histone methyltransferase and transcriptional repressor, H3K27me3, and heterochromatin histone marks H3K9me2/3 have been included. SEs in the MAF binding sites are depicted by the black bars on the right. (B) MAF directly regulated targets as identified via beta-plus analysis of shRNA up and downregulated genes, ranked based on the beta score. Highlighted are some of the genes in the top 20% of MAF-regulated targets, some of which were previously identified as MAF targets or MF molecular group–associated genes in gene expression studies. (C) GSEA shows a significant enrichment of MAF targets against the top 50 upregulated genes in the MF molecular group identified by Zhan et al. (D) Integration of predicted MAF direct targets obtained from MM cell line assays (MAF-bound and downregulated upon MAF depletion) with genes found differentially expressed in MAF primary myeloma PC (genes upregulated in MAF myeloma PCs compared with healthy PCs) yielded a set of 102 core MAF-regulated genes. Functional annotation of the genes was performed using multiple curated molecular signature data sets. Only pathways involving 4 or more MAF core target genes are shown. (E) Differential chromatin accessibility (ATAC-seq) in MAF primary samples (MAF_s1 and MAF_s2) as compared with healthy PCs (ND1, ND2, and ND3). Heatmaps depicting the regions with differential chromatin accessibility between MAF samples and healthy PCs (Padj < .05, log2FC = 1), either displaying enhanced accessibility (open) or reduced accessibility in MAF samples (closed). Bar (left) illustrates the genomic annotation of these regions. (F) Box plots depicting expression (in reads) of genes annotated to MAF open (blue) or MAF closed (gray) regions per sample, ∗∗∗∗P < .0001; Mann-Whitney U test. (G) Heatmap of the MAF-associated regions with the corresponding histone mark map of healthy tonsillar PCs (first 2 samples on the right of MM.1S) and B cells across B-cell maturation stages (Blueprint Consortium data), identifying a group of epigenetically defined promoters and enhancers, which lack activatory marks in tonsillar PCs or both in PCs and throughout B-cell development, thus defining the MAF-activated regions.
Comparing the transcriptomes of 30 myeloma PCs from different genetic subgroups with those from healthy PCs, we found that the MAF transcriptome comprised(shared as well as selective to the MAF subgroup) differentially expressed genes (supplemental Figure 1B-C). These MAF-selective genes distinguished and clustered the MAF samples together (supplemental Figure 1D). Notably, we identified a set of novel genes, not previously linked to MAF (eg, CD28), as well as previously described genes that are overexpressed in MAF-translocated MM (Figure 1D).
We further validated MAF-dependent genes and cellular pathways by performing RNA sequencing using MAF-depleted myeloma cells. Firstly, using an intracellular flow-cytometric MAF expression assay, we confirmed high MAF expression in cell lines with MAF-IgH translocation (MM.1S, JJN3, and RPMI 8226) but not in those with CCND1-IgH translocation (U266 and KMS12BM), whereas H929 MAF expression in the MMSET/NSD2-IgH cell line was lower than that in the MAF-translocated cells (supplemental Figure 2A-B). As expected, 2 MAF-targeting short hairpin RNAs (supplemental Figure 2C-D) resulted in MAF depletion and a significant loss of MAF-expressing but not MAF-negative (MAF–) myeloma cells (supplemental Figure 2E). Transcriptome analysis upon MAF depletion in MM.1S cells (supplemental Figure 3A-B; supplemental Table 2) helped confirm the downregulation of MAF signature genes (supplemental Figure 3C-E) compared with that in scramble control, whereas GSEA and pathway enrichment analysis revealed the enrichment of DNA replication and cell cycle, cytokine and chemokine pathways, and integrin signaling in the downregulated genes (supplemental Figure 3E).
Transcriptome analysis in JJN3 cells after MAF depletion (supplemental Figure 3F-I; supplemental Table 2) and its intersection with that of MAF-depleted MM.1S cells (Figure 1E) revealed a core set of MAF-dependent genes comprising previously described genes (eg, NUAK1, ITGB7, and CCND2; Figure 1E-F), as well as novel genes such as CD28 and TFs such as MYB, FLI1, and IRF4 (Figure 1E), with the latter 2 having established roles in myeloma PC survival and proliferation.8,24 Finally, in line with transcriptome analysis, we confirmed the cell cycle arrest in MAF-depleted myeloma cells (Figure 1G-H; supplemental Figure 3J).
Therefore, oncogenic MAF activates cell cycle by regulating multiple genes in the cell cycle pathway, and MAF-translocated myeloma cells are highly “addicted” to MAF, a finding that contrasts with the previously known physiological prodifferentiation and antiproliferative role of MAF in development.
Oncogenic MAF cistrome and regulome
Although we recently reported the first oncogenic MAF cistrome in MM.1S,25 the regulome of oncogenic MAF has not yet been defined.
Here, by defining the MAF cistrome in additional myeloma cells, we found a similar number of MAF binding sites between the 2 MAF-translocated cell lines MM.1S and JJN3, with a smaller number of peaks found in H929 cells, whereas 1725 peaks were shared by all 3 cell lines (supplemental Figure 4A). The majority of MAF binding sites were found in intergenic and intronic areas, potentially representing enhancer sites, with similar genomic distribution noted in the MMSET-translocated H929 cells (supplemental Figure 4B-D). The most highly enriched TF binding motif after MAF was that of IRF4 (supplemental Figure 4B-C).
Next, the integration of MAF cistrome with histone marks and chromatin accessibility revealed that nearly all MAF-bound sites are regions of active transcription, whereas >90% of either H3K27ac- or indeed MED1-defined SEs were MAF-bound (Figure 2A: supplemental Figure 4E).
Several MAF-dependent known and novel genes identified in this study were bound by MAF (supplemental Figure 4F). To define the compendium of genes directly regulated by MAF, we integrated the MAF cistrome with the transcriptome of MAF-depleted myeloma cells (Figure 2B). This led to the identification of 1436 and 676 genes that were predicted to be directly activated or repressed by oncogenic MAF, respectively (Figure 2B; supplemental Figure 4G-H). TFs critical for MM biology (IRF4, XBP1, PRDM1, FLI1, and E2F1) were among the top 20% most likely TFs to be activated by MAF (Figure 2B), whereas MAF-activated genes were enriched for MAF transcriptional signature (Figure 2C) and cell cycle, cytokine, and integrin signaling pathways (supplemental Figure 4I).
When the differential gene expression of primary MAF-translocated cells vs healthy PCs was integrated with the MAF cistrome, a core of 102 overexpressed genes involved in the cell cycle, cell adhesion, and cell migration was predicted to be directly regulated by MAF (Figure 2D).
Therefore, oncogenic MAF shapes myelomagenesis by binding to and regulating putative enhancers and SEs.
MAF-associated and -activated regulatory genome
Next, we compared our previously reported data set of paired chromatin accessibility–transcriptome profiles of myeloma (n = 28; MAF-translocated = 2) with that of healthy bone marrow PCs (n = 3).25 MAF-translocated myeloma displayed enhanced accessibility, with 88% of differentially accessible regions being more accessible in myeloma than in healthy PCs (Figure 2E). In addition, similar to the MAF cistrome, genomic annotation of these regions revealed that most of them were intronic or intergenic.
Differentially accessible regions were annotated to nearby (<1 Mb) differentially expressed genes. The peaks displaying enhanced accessibility in MAF samples were associated with increased gene expression (P < .0001; Figure 2F), suggesting that overaccessible peaks drive the oncogenic transcriptome in MAF samples. In line with this, GSEA of the overaccessible region–linked differentially expressed genes showed enrichment for the MAF transcriptional signatures (supplemental Figure 5A).
The integration of the differentially accessible regions with the MAF cistrome showed that 1661 of 5828 (29%) regions with enhanced accessibility in MAF-translocated myeloma, as compared with healthy PCs, were also found to be MAF-bound (supplemental Figure 5B). These MAF-associated, that is, MAF-bound and overaccessible, regions are also mostly found in intronic and intergenic areas (supplemental Figure 5C). Their chromatin status annotation via ChromHMM showed that they are overwhelmingly enriched for histone marks of active transcription and specifically active enhancers (supplemental Figure 5D). In addition, they are enriched in MAF and IRF family motifs (supplemental Figure 5E), highlighting a potential cooperative IRF4-MAF function.
Because the juxtaposition of MAF to the IgH enhancer as a result of t(14;16) takes place in the GCBs, we interrogated MAF expression in the mature B-cell developmental trajectory. We found that MAF is not expressed at any stage of B-cell development, that is, naive, germinal center, memory B cells, or plasma blasts, thus confirming genuine ectopic expression of oncogenic MAF in myeloma (supplemental Figure 5F).
Based on this observation, we predicted that a substantial fraction of the 1661 MAF-associated regions would be devoid of chromatin marks in healthy PCs. Indeed, 44% (726 of 1661) of the MAF-associated regions did not display any activatory epigenetic marks in healthy PCs, whereas most of these regions (582 of 726 [80%]) also lacked activatory marks throughout the B-cell maturation stages (Figure 2G; supplemental Figure 5D; supplemental Table 3). We termed these regions, that is, MAF-bound promoters or enhancers, which acquire chromatin accessibility and hallmarks of active chromatin in myeloma cells although they are mostly inactive in healthy PCs and throughout normal B-cell development, as MAF-activated. These findings suggest an ability of ectopic, oncogenic MAF to de novo enhance chromatin accessibility and establish regulatory regions that not only enhance the expression of genes already expressed in healthy PCs (eg, ITGB7) but also activate the transcription of genes not expressed in healthy PCs (eg, NUAK1 and SYNDIG1).
Ectopic MAF activates transcriptionally inert chromatin
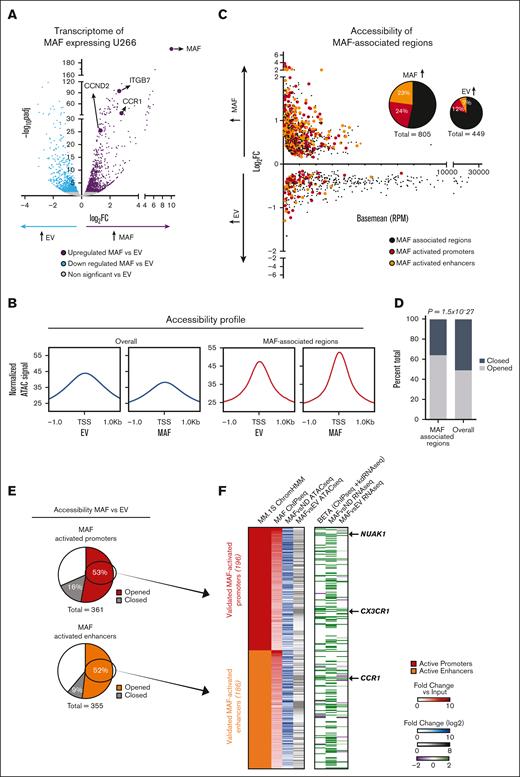
To further investigate the role of MAF in the de novo activation of the putative MAF-activated regions, we caused the overexpression of MAF in the MAF– U266 MM cell line, which overexpresses CCND1 but lacks expression of CCND2, via a lentivirus vector. Transcriptome and validatory messenger RNA quantitative polymerase chain reaction (qPCR) analysis of MAF-high and -low expressing U266 cells (supplemental Figure 6A-B) showed the upregulation of MAF and its target genes (Figure 3A; supplemental Figure 6B; supplemental Table 4). Furthermore, differentially expressed genes were enriched in MAF signature genes (supplemental Figure 6C-D), whereas nearly a third of genes upregulated upon the ectopic expression of MAF in U266 cells were also downregulated upon MAF knockdown in MAF-translocated myeloma cells (supplemental Figure 6E). Taken together, these data confirmed that ectopic MAF expression in U266 cells indeed recapitulated transcriptome changes imposed by the translocation of MAF in MM.
Ectopic MAF is sufficient to convert chromatin from an inert to an activatory state. (A) Volcano plot of transcriptome after MAF overexpression in the U266 myeloma cell line compared with empty vector (EV) control. MAF itself as well as indicative known MAF target genes are highlighted. (B) Metagene accessibility profiles seen in MAF-overexpressing U266 cells compared with EV control cells, genome-wide (overall, blue) and in MAF-associated regions (red). (C) M versus A plot of differential accessibility after MAF overexpression, focusing on the MAF-associated regions. Highlighted are the MAF-activated promoters and MAF-activated enhancers, in red and orange, respectively. Pie charts depicting a fraction of MAF-associated regions with increased or reduced accessibility in MAF-overexpressing cells and percentage of MAF-activated promoters and enhancers in each. (D) Ratios of open vs closed differential accessibility regions after MAF overexpression, with P-value representing hypergeometric distribution test (E) Fraction of MAF-activated promoters and enhancers showing enhanced accessibility in MAF-overexpressing U266 cells. (F) Heatmap depicting fold change in signal or corresponding gene expression for each of the opened MAF-activated promoters and enhancers after MAF overexpression. (From left to right) MAF ChIP-seq; fold change over input in ChIP-seq of MAF in MM.1S, MAF vs ND ATAC-seq; log2fold change in the ATAC-seq signal of primary MAF MM samples when compared with healthy PCs, MAF vs EV ATAC-seq; log2fold change in ATAC-seq signal in MAF-overexpressing U266 cells when compared with EV control, Beta (ChIP-seq + knockdown (kd) RNA-seq); beta score of change in gene expression after MAF shRNA-mediated knockdown in MM.1S cells, MAF vs ND RNA-seq; log2fold change in gene expression in primary MAF MM samples when compared with healthy PCs; MAF vs EV RNA-seq; and log2fold change of gene expression in MAF-overexpressing U266 cells when compared with EV control.
Ectopic MAF is sufficient to convert chromatin from an inert to an activatory state. (A) Volcano plot of transcriptome after MAF overexpression in the U266 myeloma cell line compared with empty vector (EV) control. MAF itself as well as indicative known MAF target genes are highlighted. (B) Metagene accessibility profiles seen in MAF-overexpressing U266 cells compared with EV control cells, genome-wide (overall, blue) and in MAF-associated regions (red). (C) M versus A plot of differential accessibility after MAF overexpression, focusing on the MAF-associated regions. Highlighted are the MAF-activated promoters and MAF-activated enhancers, in red and orange, respectively. Pie charts depicting a fraction of MAF-associated regions with increased or reduced accessibility in MAF-overexpressing cells and percentage of MAF-activated promoters and enhancers in each. (D) Ratios of open vs closed differential accessibility regions after MAF overexpression, with P-value representing hypergeometric distribution test (E) Fraction of MAF-activated promoters and enhancers showing enhanced accessibility in MAF-overexpressing U266 cells. (F) Heatmap depicting fold change in signal or corresponding gene expression for each of the opened MAF-activated promoters and enhancers after MAF overexpression. (From left to right) MAF ChIP-seq; fold change over input in ChIP-seq of MAF in MM.1S, MAF vs ND ATAC-seq; log2fold change in the ATAC-seq signal of primary MAF MM samples when compared with healthy PCs, MAF vs EV ATAC-seq; log2fold change in ATAC-seq signal in MAF-overexpressing U266 cells when compared with EV control, Beta (ChIP-seq + knockdown (kd) RNA-seq); beta score of change in gene expression after MAF shRNA-mediated knockdown in MM.1S cells, MAF vs ND RNA-seq; log2fold change in gene expression in primary MAF MM samples when compared with healthy PCs; MAF vs EV RNA-seq; and log2fold change of gene expression in MAF-overexpressing U266 cells when compared with EV control.
Chromatin accessibility assessed via assay for transposase-accessible chromatin with sequencing showed that 1254 of 1661 (76%) MAF-associated regions acquired differential accessibility upon MAF overexpression in U266 cells (Figure 3B), with 805 (64%) of these 1254 representing enhanced accessibility as compared with empty vector control cells (Figure 3C). Comparing the fraction of enhanced accessibility with the total number of differentially accessible regions observed in the MAF-associated vs genome-wide regions (64.2% vs 49.1%, respectively) indicated that these observations were not random (hypergeometric distribution test P = 1.52 × 10⁻²⁷; Figure 3D).
Among the MAF-associated regions, the MAF-activated regions described earlier were of the highest interest. Upon MAF expression in U266 cells, 382 of 726 MAF-activated regions acquired enhanced accessibility (P = 1.23 × 10-46; Figure 3C-E), whereas only a very small proportion displayed decreased accessibility. Intersection with chromatin and transcriptome data sets revealed that the MAF-activated regions in the MAF-overexpressing U266 cells corresponded to chromatin regions in MAF-translocated MM.1S cells that displayed biochemical hallmarks of transcriptionally active chromatin regulating the transcription of MAF signature genes (Figure 3F).
On-chromatin MAF cooperation with IRF4 and MAF-dependent expression of IRF4
It is likely that for ectopically expressed MAF to act as a pioneer TF, it would require the cooperative function of DNA- or chromatin-binding factors. Because motif analysis of the MAF cistrome suggested an enrichment of IRF4 binding motifs (supplemental Figure 4B-C), we further investigated the functional and on-chromatin interaction between these TFs.
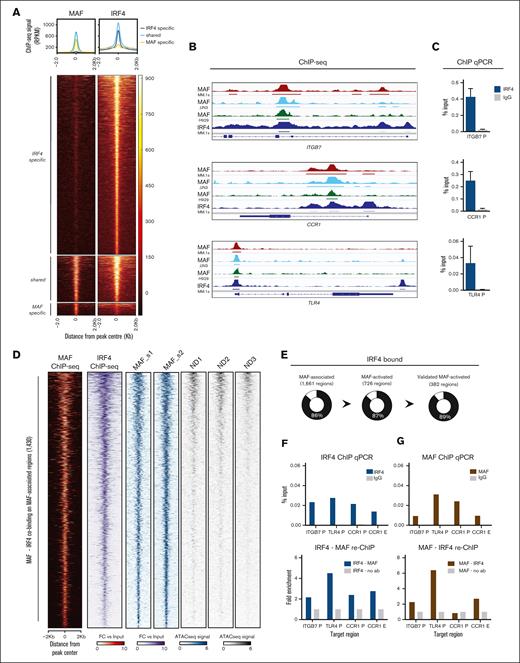
Firstly, we identified 13 398 chromatin regions of co-occupancy by MAF and IRF4 (Figure 4A; supplemental Figure 7A), including key MAF transcriptional targets, with IRF4 binding also confirmed via ChIP-qPCR (Figure 4B-C). Focusing on the MAF-associated and -activated regions, we found that >80% were cobound by IRF4 (Figure 4D-E).
On-chromatin MAF cooperation with IRF4 and MAF-dependent expression of IRF4. (A) Heatmap and histogram of MAF and IRF4 ChIP-seq in MM.1S myeloma cells, indicating peaks shared and specific to each transcription factor. ChIP-seq peak intensity in reads per kilobase per million mapped reads. (B) Reads per kilobase per million mapped reads browser plots of key MAF target genes showing the binding of MAF in MM.1S (red), JJN3 (light blue), and H929 (green) as well as IRF4 in MM.1S (dark blue). MAF ChIP-seq tracks represent FC over input, with horizontal bars below tracks indicating peaks with q < .01. IRF4 ChIP-seq tracks represent normalized ChIP-seq signal (bars showing peaks, with q < .01). (C) ChIP-qPCR against IRF4 of the same target genes in MM.1S cells, against IgG control, expressed as percent input DNA. Bars represent mean + standard error of the mean of n = 4 experiments. (D) Heatmap illustrating the MAF-associated regions found to be cobound by IRF4. IRF4 ChIP-seq data in MM.1S are illustrated in purple (IRF4 ChIP-seq). In red, MAF binding on the MAF-associated regions in MM.1S (MAF ChIP-seq). In blue, the ATAC-seq peaks obtained from the 2 primary MAF myeloma samples (MAF_s1 and MAF_s2), compared with the peaks found in healthy PCs (ND1, ND2, and ND3, in gray). (E) Pie charts depicting the percentage of MAF-associated, MAF-activated and the validated by overexpression experiments MAF-activated regions cobound by IRF4 (black). (F-G). Reciprocal ChIP-re-ChIP for MAF and IRF4 at promoters or putative enhancers, respectively, of the gene targets shown (n = 2).
On-chromatin MAF cooperation with IRF4 and MAF-dependent expression of IRF4. (A) Heatmap and histogram of MAF and IRF4 ChIP-seq in MM.1S myeloma cells, indicating peaks shared and specific to each transcription factor. ChIP-seq peak intensity in reads per kilobase per million mapped reads. (B) Reads per kilobase per million mapped reads browser plots of key MAF target genes showing the binding of MAF in MM.1S (red), JJN3 (light blue), and H929 (green) as well as IRF4 in MM.1S (dark blue). MAF ChIP-seq tracks represent FC over input, with horizontal bars below tracks indicating peaks with q < .01. IRF4 ChIP-seq tracks represent normalized ChIP-seq signal (bars showing peaks, with q < .01). (C) ChIP-qPCR against IRF4 of the same target genes in MM.1S cells, against IgG control, expressed as percent input DNA. Bars represent mean + standard error of the mean of n = 4 experiments. (D) Heatmap illustrating the MAF-associated regions found to be cobound by IRF4. IRF4 ChIP-seq data in MM.1S are illustrated in purple (IRF4 ChIP-seq). In red, MAF binding on the MAF-associated regions in MM.1S (MAF ChIP-seq). In blue, the ATAC-seq peaks obtained from the 2 primary MAF myeloma samples (MAF_s1 and MAF_s2), compared with the peaks found in healthy PCs (ND1, ND2, and ND3, in gray). (E) Pie charts depicting the percentage of MAF-associated, MAF-activated and the validated by overexpression experiments MAF-activated regions cobound by IRF4 (black). (F-G). Reciprocal ChIP-re-ChIP for MAF and IRF4 at promoters or putative enhancers, respectively, of the gene targets shown (n = 2).
Highlighting the physical proximity of MAF and IRF4, their distances at cobound sites, genome-wide and in the 1661 MAF-associated regions were 74 and 75 bp, respectively (supplemental Figure 7B). Furthermore, we confirmed this proximity by using MAF-IRF4 ChIP-re-ChIP at select regulatory regions of ITGB7, TLR4, and CCR1 (Figure 4F-G).
The previously established SE of IRF428 was among the regions co-occupied by MAF and IRF4 (supplemental Figure 7C-D). Notably, MAF depletion resulted in a significant reduction of IRF4 expression (supplemental Figure 7E), suggesting that IRF4 transcriptional regulation in myeloma cells is directly MAF-dependent, thus revealing an unknown mechanism of MAF-dependent myelomagenesis.
Genome-wide mapping of the pioneer factor function of oncogenic MAF
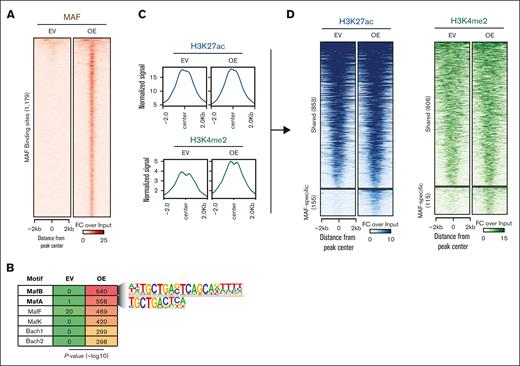
Together, our findings predict that oncogenic MAF has the ability to bind transcriptionally to inert chromatin to bring about chromatin opening and activate regulatory potential. To further address this concept, we performed ChIP sequencing of MAF and H3K27ac/H3K4me2 histone marks in MAF-overexpressing U266 cells. We obtained 1179 high-quality MAF peaks (Figure 5A), which were highly enriched for the MAF binding motif (Figure 5B). Overall, although genome-wide H3K27ac did not change, the H3K4me2 histone mark load increased (Figure 5C). Consistent with an MAF pioneer factor function, overlay of the MAF cistrome with histone marks showed that 15% and 16% of these MAF-bound areas acquired de novo H3K27ac and H3K4me2 histone marks, respectively (Figure 5D).
Genome-wide MAF binding and shaping of chromatin activity by ectopic MAF. (A) Heatmap of MAF chromatin binding as assessed using ChIP-seq in U266 cells transduced with EV or vector encoding MAF complementary DNA (OE). (B) Motif enrichment at MAF-bound genomic areas. (C) MA plots showing genome-wide enrichment for the indicated histone marks. (D) Heatmaps showing MAF-bound chromatin areas with preexisting (shared) or de novo enrichment (MAF-specific) for the indicated histone marks. OE, overexpression.
Genome-wide MAF binding and shaping of chromatin activity by ectopic MAF. (A) Heatmap of MAF chromatin binding as assessed using ChIP-seq in U266 cells transduced with EV or vector encoding MAF complementary DNA (OE). (B) Motif enrichment at MAF-bound genomic areas. (C) MA plots showing genome-wide enrichment for the indicated histone marks. (D) Heatmaps showing MAF-bound chromatin areas with preexisting (shared) or de novo enrichment (MAF-specific) for the indicated histone marks. OE, overexpression.
The pioneer function of oncogenic MAF activates SE-regulating myeloma cell migration
Among the de novo formed SEs and their putative target genes, we focused on CCR1, which although only very lowly expressed in other MM subtypes, healthy PCs, or mature B cells, is highly expressed in MAF-translocated myeloma (supplemental Figure 8A). Furthermore, CCR1 regulates the migratory-metastatic potential of myeloma cells.29
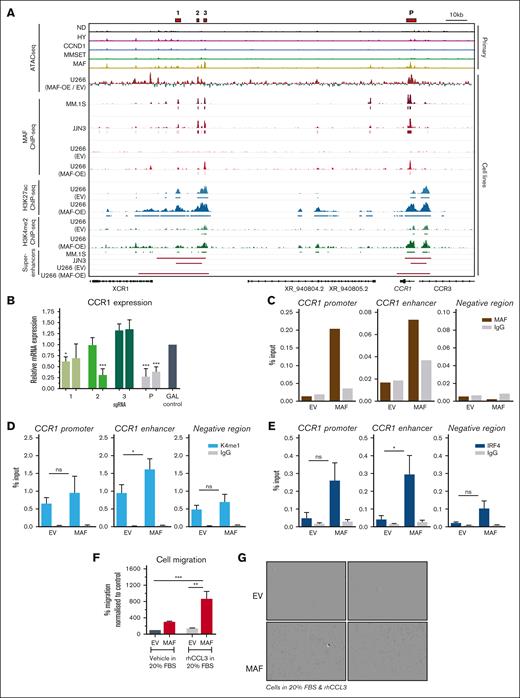
In MAF-translocated primary MM, the promoter and putative enhancer of CCR1 are marked by prominent chromatin accessibility, which is notably absent in healthy PCs and other MM genetic subgroups (Figure 6A; supplemental Figure 8B). In MAF-translocated myeloma cells, these regions are bound by MAF (Figure 6A). Furthermore, the ChromHMM analysis revealed that accessibility peak 2 of the enhancer is not active in healthy PCs or B cells (supplemental Figure 8B). Indeed, the ectopic MAF expression in U266 cells generated the chromatin accessibility peak corresponding to peak 2 and the promoter peak present in myeloma cells with MAF translocation (Figure 6A). This was further validated via a restriction enzyme-based chromatin accessibility assay (supplemental Figure 8C). In addition, the CCR1 promoter and enhancer that were de novo rendered accessible upon the ectopic expression of MAF in U266 cells, acquired MAF binding and enhanced the deposition of H3K4me2 and sufficient H3K27ac load to qualify as SEs, which are also present in the MAF-translocated myeloma cells (Figure 6A).
Pioneering role of MAF in the regulation of CCR1 SE. (A) IGV browser snapshot showing integration at the CCR1 putative SE and promoter of different data sets, as indicated; that is, in primary myeloma cells, myeloma cell lines MM.1S and JJN3, and in U266 cells expressing MAF. 1, 2, 3, and promoter peak (P) indicate accessibility peaks of interest. (B) CCR1 expression, as measured using qPCR, after CRISPR interference targeting of each of the enhancer peaks, 1, 2, and 3, and P, shown as red bars in the IGV plot. JJN3 cells were transduced with a dead Cas9-KRAB vector, with a guide targeting each 1 of the peaks, and RNA was harvested on day 4 after doxycycline induction. Two guides were used per peak and compared with a nontargeting gal4 control guide. Expression normalized to GAPDH and gal4 control. Bars represent mean + standard deviation, n = 3. ∗P < .05; ∗∗∗P < .001 using 1-way ANOVA with Dunnett post hoc multiple comparisons correction. C-D. ChIP-qPCR validation against the indicated TF (MAF, n = 2; IRF4, n = 3) and H3K4me1 (n = 3) at peak 2, the CCR1 promoter and chromatin region without binding. ∗P < .05; ns; not significant, 1-way ANOVA with Dunnett post hoc multiple comparisons correction. (F) Migration assay assessing the migration of EV and MAF overexpressing U266 cells in the presence of serum or the CCR1 chemokine ligand CCL3. Bars represent mean + standard error of the mean, n = 4. ∗∗P < .01; ∗∗∗P < .001 using 1-way ANOVA with Tukey post hoc multiple comparisons correction. MAF; MAF-overexpressing U266. (G) Microphotographs of Incucyte-based migration assays with EV and MAF-overexpressing (MAF) U266 myeloma cells. Magnification, ×10. HY, hyperdiploid; MAF; MAF-overexpressing U266.
Pioneering role of MAF in the regulation of CCR1 SE. (A) IGV browser snapshot showing integration at the CCR1 putative SE and promoter of different data sets, as indicated; that is, in primary myeloma cells, myeloma cell lines MM.1S and JJN3, and in U266 cells expressing MAF. 1, 2, 3, and promoter peak (P) indicate accessibility peaks of interest. (B) CCR1 expression, as measured using qPCR, after CRISPR interference targeting of each of the enhancer peaks, 1, 2, and 3, and P, shown as red bars in the IGV plot. JJN3 cells were transduced with a dead Cas9-KRAB vector, with a guide targeting each 1 of the peaks, and RNA was harvested on day 4 after doxycycline induction. Two guides were used per peak and compared with a nontargeting gal4 control guide. Expression normalized to GAPDH and gal4 control. Bars represent mean + standard deviation, n = 3. ∗P < .05; ∗∗∗P < .001 using 1-way ANOVA with Dunnett post hoc multiple comparisons correction. C-D. ChIP-qPCR validation against the indicated TF (MAF, n = 2; IRF4, n = 3) and H3K4me1 (n = 3) at peak 2, the CCR1 promoter and chromatin region without binding. ∗P < .05; ns; not significant, 1-way ANOVA with Dunnett post hoc multiple comparisons correction. (F) Migration assay assessing the migration of EV and MAF overexpressing U266 cells in the presence of serum or the CCR1 chemokine ligand CCL3. Bars represent mean + standard error of the mean, n = 4. ∗∗P < .01; ∗∗∗P < .001 using 1-way ANOVA with Tukey post hoc multiple comparisons correction. MAF; MAF-overexpressing U266. (G) Microphotographs of Incucyte-based migration assays with EV and MAF-overexpressing (MAF) U266 myeloma cells. Magnification, ×10. HY, hyperdiploid; MAF; MAF-overexpressing U266.
Next, using CRISPR interference, we targeted the promoter and 3 enhancer accessibility peaks, including peak 2, which is present only in the MAF-translocated myeloma subgroup (Figure 6A,B). By using 2 guide RNAs per target peak, we found that CCR1 expression was significantly reduced upon targeting peak 1 and more prominently upon targeting peak 2 and the promoter peak, thus, demonstrating the higher activating potential of the promoter and peak 2 (Figure 6B). By contrast, targeting peak 3, the most prominent of the accessibility peaks did not reduce the expression of CCR1. Further assessment of chromatin status in MAF-overexpressing U266 cells using ChIP-qPCR showed that upon ectopic MAF expression, the critical peak 2 becomes MAF-bound and is marked by the enhancer histone marks H3K4me1, in addition to H3K4me2 and H3K27ac (Figure 6A,C-D). Interestingly, ectopic MAF binding potentiates IRF4 binding to these regions, exemplifying the cooperation between the 2 TFs (Figure 6E). However, because MAF overexpression did not result in the upregulation of IRF4 (supplemental Figure 6B), it is likely that IRF4 is recruited to MAF-bound sites from its existing pool.
JQ1 is a bromodomain and extraterminal bromodomain inhibitor that preferentially inhibits BRD4 chromatin binding at SEs.30 To further explore the role of the SE in the regulation of CCR1 expression, we analyzed ChIP-seq and transcriptomic data of MM.1S cells treated with JQ1 or dimethyl sulfoxide vehicle control.28 This revealed a reduction in both BRD4 and MED1 binding at the CCR1 SE upon JQ1 treatment (supplemental Figure 8D). Consequently, CCR1 expression was reduced (supplemental Figure 8E), further demonstrating the importance of the SE for CCR1 expression. Similarly, IRF4 expression, regulated by the paradigmatic IRF4 SE previously identified in MM.1S cells28 was also reduced, commensurate with the reduced binding of BRD4 and MED1 (supplemental Figure 8D-E).
Notably, MAF-overexpressing U266 cells demonstrated a significantly higher migration in a transwell assay, both in the presence of the CCR1 chemokine ligand CCL3 and serum (Figure 6F-G), thus, directly linking de novo changes in chromatin peak 2 and promoter to the acquisition of a myeloma cell phenotypic trait. In further support of these findings, the introduction of exogenous MAF into the MAF– myeloma cell line NCU.MM1 (Figure 1A) resulted in the increased expression of MAF signature genes and enhanced migration of NCU.MM1 cells (supplemental Figure 8F-H).
Finally, using a similar approach, we also validated the pioneering function of oncogenic MAF in the activation of an enhancer that regulates the transcription of CX3CR1, a chemokine receptor gene that among the myeloma genetic subgroups is uniquely and ectopically expressed in MAF-translocated myeloma (supplemental Figure 9A-F). Of note, CX3CR1 has been previously implicated in myeloma cell adhesion and the activation of osteoclasts.31
Together, these findings demonstrate the ability of ectopic oncogenic MAF, through its pioneer TF function, to regulate oncogenic transcriptional programs and cancer-promoting cellular phenotypes by converting inaccessible, transcriptionally inert chromatin to accessible, transcriptionally active regulatory regions.
Discussion
Pioneer factors are a subset of TFs that determine cell lineage fate by binding to closed, transcriptionally inert chromatin and converting it to active, transcriptionally poised regulatory chromatin, often with enhancer function, with subsequent activation of lineage-affiliated transcriptional programs.32-34 In addition to normal development, a handful of pioneer factors have been shown to also function in oncogenesis. However, the role of pioneer factors such as FOXA1 and GATA-1 in oncogenesis is only secondary, which contrasts with that of MAF, an MIE event in 3% or 5% of all MM cases.
Because MAF is not expressed in mature B cells and PCs, its ectopic expression in GCB cells because of its translocation to the IgH enhancer takes place in a cellular context that lacks epigenetic memory dictated by MAF. In this regard, we clearly demonstrate that ectopically expressed MAF binds to chromatin areas that lack accessibility and are transcriptionally inert. The lack of prior developmental “memory” of MAF constitutes an essential criterion33 for defining its action as pioneering, that is, the ability for a de novo conversion from closed to open chromatin. The pioneering activity of MAF is predicted to regulate its core oncogenic transcriptional program involved in cell adhesion, migration, and proliferation. This is demonstrated by the ability of exogenous MAF to de novo generate areas of accessible chromatin in MAF– cells. These acquire regulatory activity, as denoted by the acquisition of H3K27ac and H3K4me1/2 marks, leading to the deregulation of genes critical for MAF-mediated oncogenesis, with CCR1 (and CX3CR1) being a case-in-point. Indeed, previous work has demonstrated the requirement for CCR1 for the migratory-metastatic potential of myeloma cells and the induction of osteolytic bone disease.29,35 We identify and validate a CCR1 enhancer, which although minimally or not accessible by healthy PCs or other myeloma subtypes, is characterized by the enhanced accessibility and the presence of an MAF-unique and dependent accessibility peak marked by MAF binding and activatory H3K27ac and H3K4me2 signals in MAF-translocated MM. This unique peak contributes substantially to CCR1 overexpression that is characteristic of MAF-translocated myeloma, and it is generated continuously and de novo. The consequences of the pioneering activity of MAF in the regulation of CCR1 are reflected at a cellular level, with the enhanced migratory potential of the myeloma cells in response to the CCR1 chemokine ligand CCL3, thus directly linking chromatin pioneering events to the acquisition of a cancer-defining phenotype.
An unresolved question is whether after the pioneer factor–mediated chromatin reprogramming, the activation of the oncogenic program can be maintained in the absence of the pioneer TF. In the case of the pluripotency TF OSK (ie, OCT4, SOX2, and KLF4), which can reprogram somatic cells into induced pluripotent stem cells36 by acting as a pioneer factor,37 the chromatin status and induced pluripotent stem cells identity can be stably maintained after the exposure to the OSK factors for a defined period.38 Notably, the OSK factors can cooperate with oncogenic KRASG12D to induce tumors that subsequently become OSK-independent.39 In this study, our analysis of MAF-depleted myeloma cells that bear activation of RAS as a major secondary oncogenic event (MM.1S KRASG12A and JJN3 NRASQ61K), clearly demonstrates that myeloma cell survival and proliferation, which are part of the core MAF-generated transcriptional program, remain dependent on oncogenic MAF. An important implication of these observations is that a therapeutic approach that would reliably decrease the expression or impair the function of oncogenic MAF will result in a profound antimyeloma effect that would be independent of secondary oncogenic events, clonal evolution, and diversification.
Pioneer TFs are thought to activate inert chromatin in cooperation with other TFs and chromatin remodelers.1,32,33,40 Although the chromatin remodelers involved in the pioneering function of MAF in myeloma are to be determined, our work identifies IRF4 as the TF cooperating with oncogenic MAF at almost all MAF-bound and activated regulatory regions. Importantly, we find that MAF regulates IRF4 expression by binding to the IRF4 SE28 and recruits IRF4 to the MAF binding sites. Because IRF4 is indispensable for myeloma cell survival,8 its transcriptional regulation by oncogenic MAF constitutes another major mechanism through which MAF sustains myelomagenesis. Future work will explore whether a lack of IRF4 abolishes or reduces MAF binding, thus influencing the MAF-regulated transcriptome, and establishing the transcriptional networks regulated by IRF4 in MAF-translocated myeloma.
One weakness of this work is that the pioneering function of oncogenic MAF was ascertained in the context of myeloma cells already harboring a different MIE. Comparing and contrasting the impact of chromatin changes of ectopic MAF in GCB cells undergoing class-switch recombination while differentiating into plasma blasts and PCs will provide a more precise context to affirm the findings regarding the pioneering function of MAF.
In conclusion, we show that a pioneer factor function of ectopic MAF results in profound and de novo chromatin changes, which underpin the ability of oncogenic MAF to promote aberrant cell proliferation and migration; however, despite such profound chromatin changes, myeloma cells remain MAF-dependent.
Acknowledgments
The authors acknowledge support from the London Institute of Medical Sciences/National Institute for Health Research (NIHR) Flow Cytometry Facility and the Imperial NIHR Biomedical Research Centre Genomics Facility.
The authors acknowledge funding from Kay Kendall Leukaemia Fund, Imperial NIHR Biomedical Research Centre, Hammersmith Hospital Charity Fund, and Blood Cancer UK.
Authorship
Contribution: A. Katsarou and N.T. performed experiments, analyzed data, and cowrote the manuscript; K.P., I.V.K., F.P., K.K., and P.M.R.S. performed experiments; J.A.-B. analyzed data; N.F. developed and donated critical reagents and developed the protocol; M.P., E.H., and A.C. donated patient samples; I.M.S. analyzed data and supervised research; V.S.C. performed experiments, supervised research, and cowrote the manuscript; A. Karadimitris supervised research and cowrote the manuscript; and all authors contributed to the writing of the manuscript.
Conflict-of-interest disclosure: The authors declare no competing financial interests.
Correspondence: Anastasios Karadimitris, Department of Immunology and Inflammation, Hugh & Josseline Langmuir Centre for Myeloma Research, Centre for Haematology, Imperial College London, London W12 0NN, United Kingdom; e-mail: a.karadimitris@imperial.ac.uk; and Valentina S. Caputo, Imperial College London, Commonwealth Building, Hammersmith Campus, Room 4S10, London, United Kingdom; e-mail: v.caputo@imperial.ac.uk.
References
Author notes
High throughput sequencing data reported in this study are deposited in the Gene Expression Omnibus database (accession number GSE210858).
Data are available on request from the corresponding author, Anastasios Karadimitris (a.karadimitris@imperial.ac.uk).
The full-text version of this article contains a data supplement.

