

Key Points
The combined administration of pharmacological inhibitors of DNMT1 and LSD1 synergistically increase HbF in healthy baboons.
The drug combination induced high levels of HbF and F-cells in both nonanemic and anemic (phlebotomized) baboons.

Abstract
Increased fetal hemoglobin (HbF) levels reduce the symptoms of sickle cell disease (SCD) and increase the lifespan of patients. Because curative strategies for bone marrow transplantation and gene therapy technologies remain unavailable to a large number of patients, the development of a safe and effective pharmacological therapy that increases HbF offers the greatest potential for disease intervention. Although hydroxyurea increases HbF, a substantial proportion of patients fail to demonstrate an adequate response. Pharmacological inhibitors of DNA methyltransferase (DNMT1) and lysine-specific demethylase 1A (LSD1), 2 epigenome-modifying enzymes associated with the multiprotein corepressor complex recruited to the repressed γ-globin gene, are powerful in vivo inducers of HbF. The hematological side effects of these inhibitors limit feasible clinical exposures. We evaluated whether administering these drugs in combination could reduce the dose and/or time of exposure to any single agent to minimize adverse effects, while achieving additive or synergistic increases in HbF. The DNMT1 inhibitor decitabine (0.5 mg/kg per day) and the LSD1 inhibitor RN-1 (0.25 mg/kg per day) administered in combination 2 days per week produced synergistic increases in F-cells, F-reticulocytes, and γ-globin messenger RNA in healthy baboons. Large increases in HbF and F-cells were observed in healthy, nonanemic, and anemic (phlebotomized) baboons. Combinatorial therapy targeting epigenome-modifying enzymes could thus be a useful strategy for producing larger increases in HbF to modify the clinical course of SCD.
Introduction
Sickle cell disease (SCD) is caused by a mutation in the β-globin gene1 that triggers polymerization of deoxygenated sickle hemoglobin (HbS). Approximately 100 000 patients with SCD in the United States and millions worldwide2 suffer from chronic hemolytic anemia, painful crises, multisystem organ damage, and reduced life expectancy.3 Hematopoietic stem cell transplantation can be curative, but most of the patients do not have a suitable donor.4 Advanced gene editing technologies also offer the possibility of a cure,5,6 but the likelihood that these strategies can be mobilized to treat large number of patients residing in low-income countries is remote. A pharmacological treatment to increase fetal hemoglobin (HbF [α2γ2]) as a therapy for SCD has been a long sought goal because increased levels of HbF inhibit the polymerization of HbS7,8 and are associated with reduced symptoms and increased lifespan in patients with SCD.9,10 Therefore, the development of an orally available, easily administered drug regimen that increases HbF to high levels and maximizes its distribution throughout the erythrocyte population should be pursued.
Extensive efforts to elucidate the mechanism of γ-globin repression during adult erythropoiesis have identified a set of transacting factors, including the orphan nuclear receptors TR2/TR4, BCL11A, and LRF (ZBTB7A), that recognize and bind to specific DNA sequences within the γ-globin promoter to repress γ-globin gene expression.11-14 TR2/TR4, the first repressor characterized, recruits a multiprotein corepressor, the direct repeat erythroid definitive (DRED) complex, to the direct repeat elements within the γ-globin promoter.15 Biochemical purification of DRED showed that it consisted of a tetrameric core element containing TR2/TR4, DNA methyltransferase 1 (DNMT1) and LSD1 (lysine-specific demethylase 1A; KDM1A) with additional proteins including histone deacetylases (HDACs), the G9A histone methyltransferase, and CoRest that are associated with the core to form the larger DRED complex. BCL11A was initially identified by genome-wide association studies16,17 and confirmed to be a γ-globin repressor in transgenic knockout mouse experiments, showing that deletion of BCL11A prevented repression of mouse embryonic globins and the human γ-globin gene during development.18 BCL11A also binds to the γ-globin promoter12,13,18 and recruits a multiprotein corepressor complex containing HDACs, DNMT1, and LSD1 to repress γ-globin expression.19 Recruitment of corepressor complexes also facilitates γ-globin repression by ZBTB7A.13,14 Whether these repressors are recruited in a sequential, dependent manner during differentiation or act independently has not been established.
Thus, recruitment of multiprotein corepressor complexes containing epigenome-modifying enzymes, including DNMT1, LSD1, HDACs, and G9A, is instrumental in the mechanism of γ-globin repression. These epigenome-modifying enzymes maintain high levels of DNA methylation, low levels of histone H3 K4 methylation and histone acetylation, and high levels of H3 K9 methylation, which are characteristic of repressed genes and are targets for therapeutic interventions to increase HbF.20-23 The use of HDAC and G9A inhibitors in vivo has been limited by toxicity, but new and more promising agents are currently in development.24-26 Our previous work has shown that inhibitors of DNMT and LSD1 are potent activators of HbF in vivo in baboons,27-31 considered the best animal model to investigate the effect of potential HbF-stimulating drugs owing to the conservation of structure and developmental regulation of the β-globin gene locus between baboons and man.32-34 Significantly, experimental results in baboons have been translated to clinical trial in patients with SCD.35-40
The goal of this study was to develop an effective pharmacological therapy using a combination of drugs that target different repressive epigenome-modifying enzymes within the corepressor complex, based on the hypothesis that administration of these drugs in combination would allow a reduction in dose and/or time of exposure to any single agent to minimize adverse effects while achieving additive or synergistic increases in HbF. We tested this hypothesis using a combination of the DNMT1 inhibitor decitabine and LSD1 inhibitor RN-1 in baboons.
Materials and methods
Animals
Seven baboons (P anubis [PA] and P anubis/cynocephalus hybrids) were used in this study. The baboons were housed at the Biologic Resource Laboratory of the University of Illinois, Chicago. All animal treatments were approved by the Institutional Animal Care and Use Committee of the University of Illinois, Chicago.
Drugs
Decitabine was obtained from the laboratory of Dr. Yogen Saunthararajah. RN-1 was obtained from Cayman chemical company. The drugs were dissolved in phosphate-buffered saline (pH 7.2) and filtered through a 22 μm syringe filter immediately before subcutaneous injection.
F-cells and F-retics
Levels of F-cells and F-reticulocytes (F-retics) were analyzed by flow cytometry using a Cytomics FC500 (Beckman Coulter) after staining with thiazole orange and PE-conjugated anti-HbF (BD Bioscience).27
HPLC
Globin chain separation was achieved by high-performance liquid chromatography (HPLC) using a LithoCART 250-4 column (VWR) and an Agilent 1260 infinity II HPLC system with acetonitrile-methanol gradients41 Lysates were prepared from baboon peripheral blood by freeze-thaw lysis, clarified by centrifugation (12 000 rotation per minutes for 15 minutes), and filtered through a 22 μm Agilent PES membrane filter before injection.
RT-PCR
RNA was isolated using the RNeasy Minikit (#74104; Qiagen) and treated with RNase-free DNase I (#AM1906; Ambion) according to the manufacturer’s instructions. Purified RNA was used for cDNA synthesis using the RevertAid First Strand cDNA Synthesis Kit (#K1622; Thermo Scientific). Real-time polymerase chain reaction (RT-PCR) was conducted using custom designed primer-probe combinations to analyze globin transcripts. Absolute numbers of globin transcripts were determined by extrapolation from standard curves prepared from the cloned amplicons.42
Statistics
The significance of differences in F-cells, F-retics, and γ-globin messenger RNA (mRNA) between low- and high-HbF group baboons, as well as differences between baboons treated with either RN-1 or decitabine were determined by paired t test. Drug combination effects were evaluated using the response additivity approach with 2-way analysis of variance analysis based on a 2X2 factorial experimental design performed using excel. The combination index (CI) was calculated as CI = Ea + Eb/Eab, where Ea and Eb represent the effects of RN-1 and decitabine, respectively, and Eab represents the effect of the drug combination. The P value represents the significance of the interaction effect given by 2-way analysis of variance analysis.43,44
Results
Baboon HbF baseline levels define 2 groups
We analyzed 7 baboons that were either P anubis or P anubis/P cynocephalus hybrids for differences in baseline pretreatment levels of F-retics, F-cells, and γ-globin mRNA. These baboons comprised 2 groups that differed significantly in these parameters and were thus designated as the low- and high-HbF groups, respectively (Figure 1A-B). The low-HbF group comprised 4 individuals with levels of baseline F-cells (2.15 ± 0.57%), F-retics (2.16 ± 0.52%), and γ-globin mRNA (0.01 ± 0.004 γ/γ ± β) significantly lower than levels of F-cells (14.4 ± 3.16%; P < .001), F-retics (12.2 ± 5.9%; P < .02), and γ-globin mRNA (0.052 ± 0.014 γ/γ ± β; P < .01) measured in 3 high-HbF group individuals.

Differences in baseline F-cells, γ-globin mRNA, and F-retics among the 7 baboons. (A) Individual values of high-HbF group baboons: unfilled circles; low-HbF group baboons: filled circles. (B) Mean values of high-HbF group baboons: unfilled bar; low-HbF group baboons: filled bar.
Differences in baseline F-cells, γ-globin mRNA, and F-retics among the 7 baboons. (A) Individual values of high-HbF group baboons: unfilled circles; low-HbF group baboons: filled circles. (B) Mean values of high-HbF group baboons: unfilled bar; low-HbF group baboons: filled bar.
Effect of RN-1 alone
The effect of RN-1 (0.25 mg/kg per day; 2d) on F-retics and peripheral blood RNA was tested in individual baboons of both the low- and high-HbF groups. For all experiments, F-retics were measured in peripheral blood samples (1-2 mL) obtained pretreatment and at a minimum of 3 posttreatment samples between day 7 and day 10 after the first day of drug administration (d1) to identify the peak F-retic response. The expression of γ-globin mRNA was measured by RT-PCR using RNA isolated from peripheral blood samples collected pretreatment and on the day of the peak F-response.
RN-1 increased the levels of F-retics by >7-fold (15.80 ± 4.81%; P < .001) and γ-globin mRNA by >12-fold (0.08 ± 0.01 γ/γ + β; P < .001) compared with the pretreatment levels in the low-HbF group. In the high-HbF group, RN-1 increased F-retics levels by 1.9-fold (31.40 ± 4.91%; P < .01) and γ-globin mRNA by 4.2-fold (0.15 ± 0.05 γ/γ + β; P < .02). Significant differences in the levels of F-retics (P < .01) and γ-globin mRNA (P < .05) between the 2 groups were maintained after RN-1 administration (Table 1; Figure 2A-B).
Effect of RN-1 and Decaitabine, alone and in combination, on F-retics and γ-globin mRNA in low- and high-HbF group baboons
| HbF group | Animal | Drug | F-retics | γ-globin mRNA (γ/γ + β) | Animal | Drug | F-retics | γ-globin mRNA (γ/γ + β) | Animal | Drug | F-retics | γ-globin mRNA (γ/γ + β) |
|---|---|---|---|---|---|---|---|---|---|---|---|---|
| Low | 9197 | RN1 | 13.8 | 0.07 | 9197 | DAC | 6.3 | 0.022 | 9197 | Comb | 38.3 | 0.13 |
| 9197 | RN1 | 16.2 | 0.072 | 9197 | DAC | 7.9 | 0.023 | 9197 | Comb | 43.6 | 0.16 | |
| 9254 | RN1 | 11.9 | 0.097 | 9254 | DAC | 6.3 | 0.053 | 9254 | Comb | 53.7 | 0.23 | |
| 9254 | RN1 | 21.3 | 0.082 | 9254 | DAC | 3.3 | 0.039 | 9254 | Comb | 54.3 | 0.26 | |
| Mean | 15.6 | 0.080 | 5.95 | 0.034 | 47.5 | 0.19 | ||||||
| SD | 4.25 | 0.012 | 1.92 | 0.014 | 7.84 | 0.06 | ||||||
| High | 9194 | RN1 | 25.8 | 0.076 | 9194 | DAC | 27.9 | 0.14 | 9194 | Comb | 61.5 | 0.289 |
| 9194 | RN1 | 32.5 | 0.146 | 9194 | DAC | 28.4 | 0.09 | 9194 | Comb | 61.8 | 0.275 | |
| 9194 | RN1 | 37.5 | 0.181 | 9255 | DAC | 29.1 | 0.127 | 9255 | Comb | 71.8 | 0.304 | |
| 9255 | RN1 | 29.8 | 0.171 | 9255 | DAC | 15.4 | 0.093 | 9255 | Comb | 66.5 | 0.268 | |
| Mean | 31.4 | 0.144 | 25.2 | 0.113 | 65.4 | 0.284 | ||||||
| SD | 4.91 | 0.047 | 6.55 | 0.025 | 4.82 | 0.016 |
Comb, DAC/RN-1 combination; DAC, decitabine; SD, standard deviation.

Effect of RN-1, decitabine, and the RN-1/decitabine combination. (A) F-retics and (B) γ-globin mRNA. Untreated: unfilled bars; RN-1:diagonal bars, decitabine: filled bars, Combination: horizontal bars. Interaction (left) and additivity (right) plots showing the synergistic effect of RN-1 and decitabine in combination on (C) F-retics and (D) γ-globin mRNA.
Effect of RN-1, decitabine, and the RN-1/decitabine combination. (A) F-retics and (B) γ-globin mRNA. Untreated: unfilled bars; RN-1:diagonal bars, decitabine: filled bars, Combination: horizontal bars. Interaction (left) and additivity (right) plots showing the synergistic effect of RN-1 and decitabine in combination on (C) F-retics and (D) γ-globin mRNA.
Effect of decitabine alone
The effect of decitabine (0.5 mg/kg per day; 2d) was also tested in individual baboons of both the low- and high-HbF groups. Decitabine increased F-retics 2.4-fold in the high-HbF group (25.20 ± 6.55%; P < .001) and 4.8-fold in the low-HbF group (5.95 ± 1.92%; P < .01) compared with the pretreatment baseline levels. Within the high-HbF group decitabine increased γ-globin mRNA 3.1-fold (0.11 ± 0.03 γ/γ + β; P < .01) and 4.8-fold in the low-HbF group (0.034 ± 0.00.01 γ/γ + β; P < .02) compared with the pretreatment levels. Differences in the levels of F-retics (P < .01) and γ-globin mRNA (P < .01) between the 2 groups were maintained after decitabine treatment (Table 1; Figure 2A-B).
Effect of RN-1 and decitabine in combination
The effect of RN-1 (0.25 mg/kg per day; 2d) and decitabine (0.5 mg/kg per day; 2d) in combination was then determined in 2 baboons of each HbF group. Within the low-HbF group, F-retics increased to high levels after administration of the combination (47.5 ± 7.84%) and to even higher levels in the high-HbF group animals (65.4 ± 4.82%; P < .01). Among all animals treated, the drugs in combination increased F-retics (56.44 ± 11.32%; n = 8), 2.4-fold higher than RN-1 alone (23.60 ± 9.33%; P < .001; n = 8), and 3.6-fold higher than decitabine alone (15.58 ± 11.21%; P < .001; n = 8).
The level of γ-globin mRNA attained after administration of the combination to the low-HbF group animals (0.20 ± 0.06 γ/γ + β) was 2.8-fold greater than RN-1 alone (0.07 ± 0.03 γ/γ + β; P < .01) and 5.7-fold greater than decitabine alone (0.034 ± 0.014 γ/γ + β; P < .01). In the high-HbF group the combination induced a level of γ-globin mRNA (0.28 ± 0.02 γ/γ + β; n = 4) 2-fold greater than RN-1 alone (0.14 ± 0.045 γ/γ + β; P < .01) and 2.6-fold greater than decitabine alone (0.11 ± 0.024 γ/γ + β; P < .001). The level of γ-globin mRNA induced after administration of the drug combination remained significantly different between the low- and high-HbF group animals (P < .05). Among all baboons the combination increased γ-globin mRNA (0.24 ± 0.06 γ/γ + β; n = 8) to a level 2.2-fold greater than with RN-1 alone (0.11 ± 0.05 γ/γ + β; P < .001; n = 8) and 3.4-fold higher than decitabine alone (0.07 ± 0.05 γ/γ + β; P < .001; n = 8). Thus, the drug combination resulted in vigorous increases in γ-globin mRNA in all animals.
Increases in F-retics and γ-globin mRNA induced by the drug combination were synergistic compared with either drug alone, as shown by the CI, Interaction plots, and Additivity plots (Figure 2C-D). RN-1 and decitabine administered in combination induced synergistic increases in both F-retics and γ-globin mRNA among all baboons (F-retics: CI = 0.49; P < .01; γ-globin mRNA: CI = 0.60; P < .02)
Effect of prolonged treatment with RN-1 and decitabine in combination
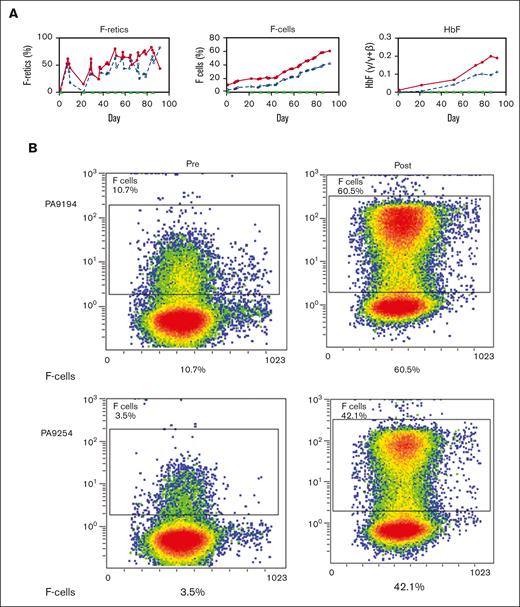
Two healthy nonanemic baboons, PA 9254 (low-HbF group) and PA 9194 (high-HbF group), were selected to study the effects of the long-term administration of the RN-1/decitabine combination. The drug combination (0.25 mg/kg per day RN-1; 0.5 mg/kg per day decitabine; 2d) was administered weekly on 2 consecutive days after a 2 week break after the first 2-day treatment to monitor the initial effect. A total of 22 doses were given over 13 weeks. Peripheral blood samples (1-2 mL) were obtained twice a week to monitor changes in F-cells, F-retics, HbF, and complete blood count. The levels of F-retics were elevated throughout the treatment period in both animals and consistently increased in F-cells and HbF (Figure 3A). Over the 13-week period, F-cells increased >12 fold to 42.5% in the low-HbF group baboons, whereas HbF (γ/γ + β) also rose >12 fold to 0.10, corresponding to an HbF/F cell value of 23.5%. In the high-HbF group animal, F-cells increased 5.7 fold to 60.5%, whereas HbF levels (γ/γ+β) rose 10 fold to 0.2, corresponding to an HbF/F cell value of 33.0% (Figure 3; Table 2). The use of decitabine or RN-1 alone is associated with neutropenia (decitabine, RN-1), thrombocytopenia (RN-1), or thrombophilia (decitabine). After administration of RN-1 and decitabine in combination to healthy baboons, platelet and absolute neutrophil counts were generally maintained within the normal range throughout the treatment period (Figure 4). However, reticulocyte counts decreased and remained suppressed throughout the treatment period. Absolute reticulocytes during the treatment period were reduced by >70% compared with the pretreatment (PA 9194:84 × 103/μL pretreatment, 23 ± 9.5 × 10³/μL treatment period (mean ± standard deviation); PA 9254: 87 × 103/μL pretreatment, 19.5 ± 10.7 × 10³/μL treatment period (mean ± standard deviation). This reduction in reticulocyte production was associated with a progressive decrease in hemoglobin throughout the treatment period in both animals (Figure 4).
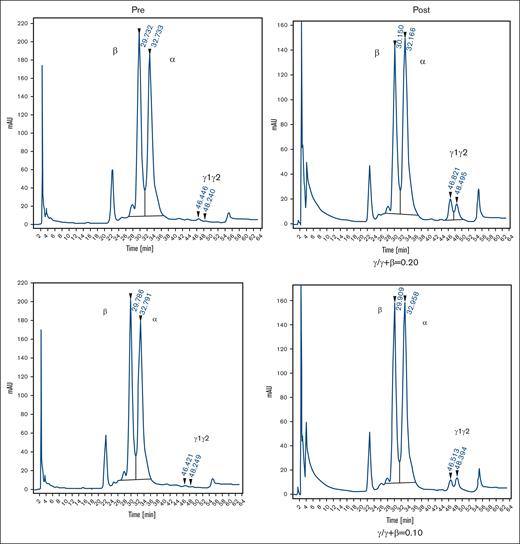
Effect of prolonged treatment with RN-1 and decitabine in combination in healthy, nonanemic baboons. (A) Effect on F-retics, F-cells, and HbF. The results for the 2 baboons (PA 9194 [solid lines] and PA 9254 [dashed lines]) are shown. Filled triangles indicate the time of drug administration. (B) Pretreatment and posttreatment levels of F-cells and HbF in 2 baboons treated with RN-1 and decitabine in combination for 13 weeks. Left panels: flow cytometric determination of F-cells; right panels HPLC analysis of globin chains in peripheral blood.
Effect of prolonged combination treatment of healthy baboons
| Animal | HbF group | F-cells | HbF | HbF/F-cell | ||
|---|---|---|---|---|---|---|
| Before | After | Before | After | After | ||
| PA 9254 | Low | 3.5 | 42.5 | 0.008 | 0.10 | 23.5 |
| PA 9194 | High | 10.7 | 60.5 | 0.02 | 0.20 | 33.0 |
| Animal | HbF group | F-cells | HbF | HbF/F-cell | ||
|---|---|---|---|---|---|---|
| Before | After | Before | After | After | ||
| PA 9254 | Low | 3.5 | 42.5 | 0.008 | 0.10 | 23.5 |
| PA 9194 | High | 10.7 | 60.5 | 0.02 | 0.20 | 33.0 |
| ANC (per μL) | Platelets (× 103/μL) | ||||||
|---|---|---|---|---|---|---|---|
| Before | Nadir | Mean | Before | Nadir | Max | Mean | |
| PA 9254 | 2170 | 1460 | 2780 + 1250 | 409 | 256 | 616 | 353 + 81 |
| PA 9194 | 3880 | 1400 | 3245 + 1604 | 274 | 198 | 403 | 257 + 44 |
| ANC (per μL) | Platelets (× 103/μL) | ||||||
|---|---|---|---|---|---|---|---|
| Before | Nadir | Mean | Before | Nadir | Max | Mean | |
| PA 9254 | 2170 | 1460 | 2780 + 1250 | 409 | 256 | 616 | 353 + 81 |
| PA 9194 | 3880 | 1400 | 3245 + 1604 | 274 | 198 | 403 | 257 + 44 |
ANC, absolute neutrophil count; Max, maximum.

Effect of drug combination on hematological values during long-term treatment of nonanemic baboons. (A) Effect on ANC, platelets, hemoglobin, and absolute reticulocyte counts in 2 healthy, nonanemic baboons, PA 9144 (solid line), PA 9254 (dashed line). Filled triangles indicate the days of drug administration. ANC, absolute neutrophil count.
Effect of drug combination on hematological values during long-term treatment of nonanemic baboons. (A) Effect on ANC, platelets, hemoglobin, and absolute reticulocyte counts in 2 healthy, nonanemic baboons, PA 9144 (solid line), PA 9254 (dashed line). Filled triangles indicate the days of drug administration. ANC, absolute neutrophil count.
Effect of decitabine and RN-1 in combination in anemic baboons
The effect of the drug combination was further investigated in 2 phlebotomized, anemic baboons to better model anemia and enhanced reticulocytosis of SCD and to study the effect of the drug combination in the presence of high levels of erythropoietin (Epo) induced by anemia. Two animals, 1 from each HbF group (PA 9254, low-HbF group; PA 9194, high-HbF group), were subjected to repeated phlebotomies to induce high levels of reticulocytosis 10 days before the first dose of the drug. Two rounds of the drug combination (decitabine 0.5 mg/kg per day; RN-1 0.25 mg/kg per day; 2 days per week) were administered for 2 consecutive weeks. Phlebotomies were performed as necessary to maintain a hematocrit at ∼20 during the course of the experiment. In PA 9254 (low-HbF group) F-cells increased 2.7-fold from 17.4% pretreatment to 48.5% after 1 cycle of administration of the drug combination, whereas HbF increased from 0.03 γ/γ + β to 0.19 γ/γ + β. Administration of an additional 1 week cycle of the drug combination boosted F-cells to 60.6% and HbF to 0.28 γ/γ + β (Figure 5B-D). One cycle of treatment with the drug combination of PA 9194 (high-HbF group) increased F-cells from 20.5% pretreatment to 48.6% and HbF from 0.04 γ/γ + β pretreatment to 0.24 γ/γ + β. After an additional cycle of the drug combination, F-cells increased to 66.2% and HbF to 0.33 γ/γ + β (Figure 5B-D). Therefore, high levels of both F-cells and HbF per F cell (PA 9254: 46% HbF/F cell, 9194: 50% HbF/F cell) were attained after only 4 doses of the drug combination. After the administration of the drug combination to these anemic baboons, a transient 20% to 40% decrease in reticulocyte levels was observed (Figure 5A).

Effect of drug combination on anemic baboons. (A) Effect on absolute reticulocyte counts in PA 9194 (solid line) and PA 9254 (dashed line). (B) Effect on HbF (γ/γ + β). (C) HPLC chromatograms showing the increase in HbF observed after the administration of 1 cycle and 2 cycles of the drug combination in PA 9254 (top row) and PA 9194 (bottom row). (D) Flow cytometry data showing levels of F-cells pretreatment after 1 cycle and 2 cycles of drug administration in PA 9254 (top row) and PA 9194 (bottom row).
Effect of drug combination on anemic baboons. (A) Effect on absolute reticulocyte counts in PA 9194 (solid line) and PA 9254 (dashed line). (B) Effect on HbF (γ/γ + β). (C) HPLC chromatograms showing the increase in HbF observed after the administration of 1 cycle and 2 cycles of the drug combination in PA 9254 (top row) and PA 9194 (bottom row). (D) Flow cytometry data showing levels of F-cells pretreatment after 1 cycle and 2 cycles of drug administration in PA 9254 (top row) and PA 9194 (bottom row).
Discussion
These experiments showed for the first time that the combined administration of 2 drugs targeting different enzymes contained in the γ-globin corepressor complex produced synergistic increases in F-retics and γ-globin mRNA in vivo in baboons. These results confirm that the synergistic effect of these 2 drugs on HbF levels previously reported in cultured human CD34+ cells also occurs in vivo.45 A previous study testing this drug combination in mice with SCD observed increased levels of F-retics and γ-globin RNA in mice treated with the combination compared with those treated with either drug alone, although the doses and frequency of dosing differed from those in this study.46 Long-term treatment of 2 healthy and nonanemic baboons with the drug combination on a 2 day per week schedule resulted in impressive increases in the levels of F-cells and HbF in the absence of thrombocytopenia, thrombophilia, or severe neutropenia, which are the principal adverse hematological side effects associated with these drugs in patients and baboons. We observed unexpected decreases in hematocrit, hemoglobin, and red blood cell counts owing to a reduction in reticulocyte counts in baboons during the long-term treatment experiment. This effect was not observed in a previous study of baboons treated with RN-1 alone (0.25 mg/kg; 5 days per week) for >250 days. Importantly, baboons in that study responded with vigorous increases in reticulocytes upon blood loss following an accidental wound in 1 animal and increased menstrual bleeding in another, indicating that treatment with RN-1 alone did not adversely affect reticulocyte production.28 The results suggests that the drug combination may alter the expression of genes involved in erythroid differentiation to inhibit erythropoiesis. Additional studies to determine the effect of drug combination on erythroid differentiation and gene expression are required to test this hypothesis. In the 2 anemic baboons, the effect of the drug combination on reticulocytes was transient and less severe, suggesting that high levels of Epo may partially overcome the inhibition of reticulocyte production. Epo levels in patients with SCD are considered low for their degree of anemia.47 Epo therapy to augment endogenous Epo levels may increase HbF in patients with SCD, particularly in combination with hydroxyurea, which can allow more aggressive dosing48 and therefore, could be considered in future clinical studies in patients with SCD treated with our drug combination. Furthermore, the ability of the drug combination to dramatically increase HbF should enhance red blood cell survival in patients with SCD. Other reported effects of LSD1 inhibitors on disease pathology in mice with SCD, likely because of enhanced mitochondrial clearance, are predicted to have additional beneficial effects on patients.49,50
Species-related genetic factors have been previously shown to influence HbF induction in response to erythropoietic stress and DNMT1 inhibitors.51-53 We analyzed the effect of RN-1 and decitabine in 2 groups of baboons with either high- or low-baseline HbF expression. Previous studies have used baboons imported from Africa or those with well-known breeding records from our facility. Baboons used in these experiments were derived from captive populations at breeding facilities in the United States, where P anubis/cynocephalus hybrids are common and mistakes in species designation may occur owing to unintentional matings and errors in record keeping.54 Baseline expression of HbF in untreated baboons, rather than species designation, may offer a better strategy to classify baboons with differences in HbF expression.
Our results clearly showed that the combined administration of these drugs increases F-retics and γ-globin mRNA in a synergistic manner, strongly suggesting the potential effectiveness of a combinatorial drug regimen in patients with SCD. Both decitabine and RN-1 were chosen based on their ability to inhibit the enzymatic activities of DNMT1 and LSD1, respectively, within the γ-globin corepressor. The exact mechanism responsible for this synergistic effect remains unknown, because each drug has additional effects. Although recent experiments conducted in the HuDep-2 cell line where BCL11A was depleted by Protac–mediated targeted degradation suggested that DNA methylation is not sufficient to repress γ-globin expression,55 these results could also be the result of the inability of the NURD complex containing MBD2, a “reader” of DNA methylation required for γ-globin repression, to be recruited to the γ-globin promoter in the absence of BCL11A.56 Decitabine treatment results in proteolysis and depletion of DNMT1 from cells.57 DNMT1 also interacts with LSD158,59 and can act as a scaffold protein for multiprotein corepressor complexes, suggesting that depletion of DNMT1 by decitabine alters the integrity and/or abundance of the corepressor complex and thus the recruitment of other epigenome-modifying enzymes and/or readers to the γ-globin promoter. LSD1 has also been shown to be required for global DNA methylation in embryonic stem cells.60 LSD1 has major effects on erythroid differentiation and its reduction is associated with alteration of lineage-specific differentiation, expansion of progenitors, and inhibition of terminal erythroid differentiation.61-65 These effects on differentiation may be of mechanistic significance as expression of γ-globin is favored in more primitive erythroid progenitors.66
We concluded that a combination of decitabine and the LSD1 inhibitor RN-1 produces a synergistic effect on γ-globin expression, leading to potent increases in HbF and F-cells in healthy, nonanemic, and anemic baboons. Although additional dosing strategies, schedules, and drug combinations remain to be explored, these results suggest that combinatorial drug therapy targeting epigenome-modifying enzymes may be a useful strategy for modifying the clinical course of SCD.
Acknowledgments
This work was supported by the National Institutes of Health and the National Heart, Lung, and Blood Institute (P01 146372).
Authorship
Contribution: V.I. performed and analyzed all flow cytometry and RT-PCR assays; K.V. assisted in planning of baboon studies, performed all baboon treatments; X.Z. advised on statistical analysis of the data; J.R. proofread and edited the manuscript; A.E.R. collaborated with the conception and planning of studies; Y.S. assisted in planning the experiments and interpretation of data; R.M. assisted in planning of experiments and interpretation of data; D.L. planned experiments, performed HPLC analysis, and wrote the manuscript; and A.E.R., Y.S., and R.M. proofread and edited the manuscript.
Conflict-of-interest disclosure: Y.S. has equity and serves as the Board of EpiDestiny. The remaining authors declare no competing financial interests.
Correspondence: Donald Lavelle, Department of Medicine, University of Illinois at Chicago, Jesse Brown VA Medical Center, Chicago, IL 60612; e-mail: dlavelle@uic.edu.

